
Why October Could Trigger a Market Rally
by Jason Bodner All, Big Money Insights Weekly, StocksThe world changed on Sept. 11, 2001. For those who were there, and for those who lost someone who was, I take a moment to remember them. History lives through memory…never forget.
In 1962, U.S. Naval researchers discovered something remarkable. When a nickel-titanium alloy called Nitinol bent out of shape and then heated, it snapped back to its original form.
It showed that metal had memory.
You can observe this with a paper clip. Bend it under pressure, apply heat, and it pops back to exactly what it was. The shape memory effect isn’t just a metaphor, markets have the same property.
What the Pressure Looks Like
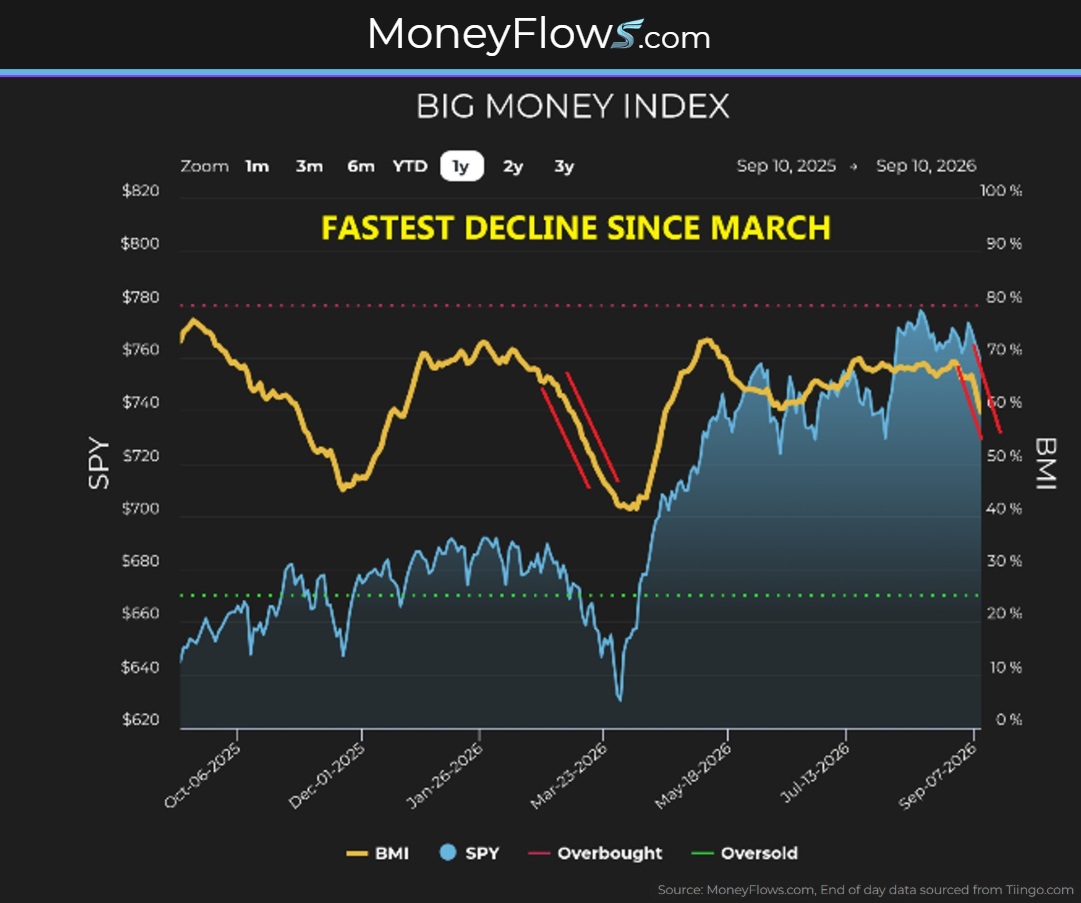
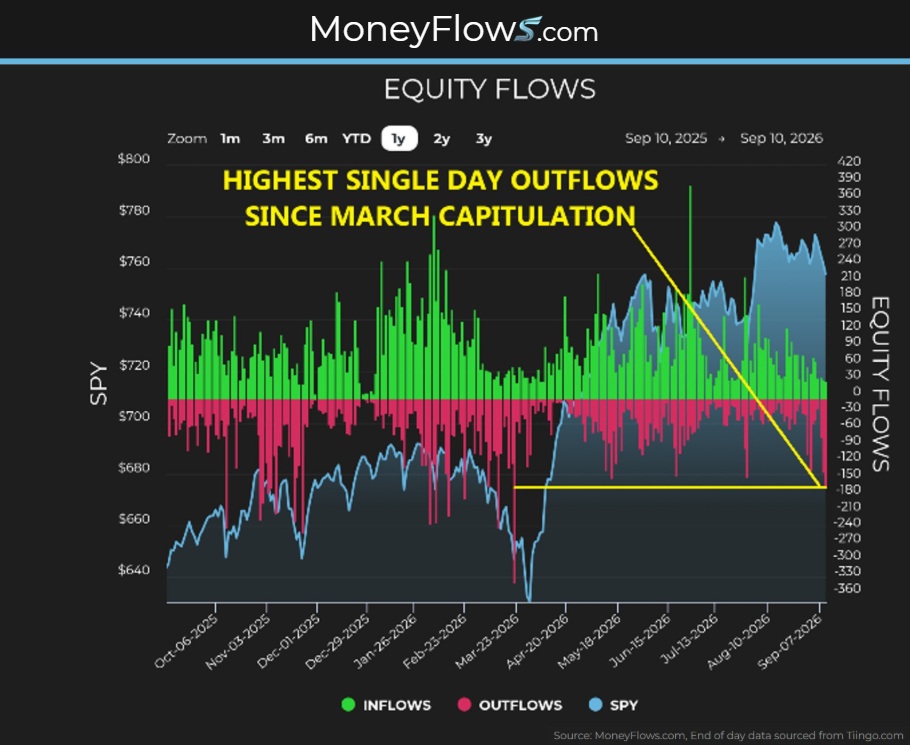
On Aug. 27, the Big Money Index fell 9.5 points, from 69.2% to 59.7%, in 10 sessions. It was the fastest decline since the March selloff. Brent crude rose 21% in the same period. Wednesday saw 161 equity outflows, the highest single-day reading since the capitulation on March 20.
The selling is real, broadening, and intensifying.
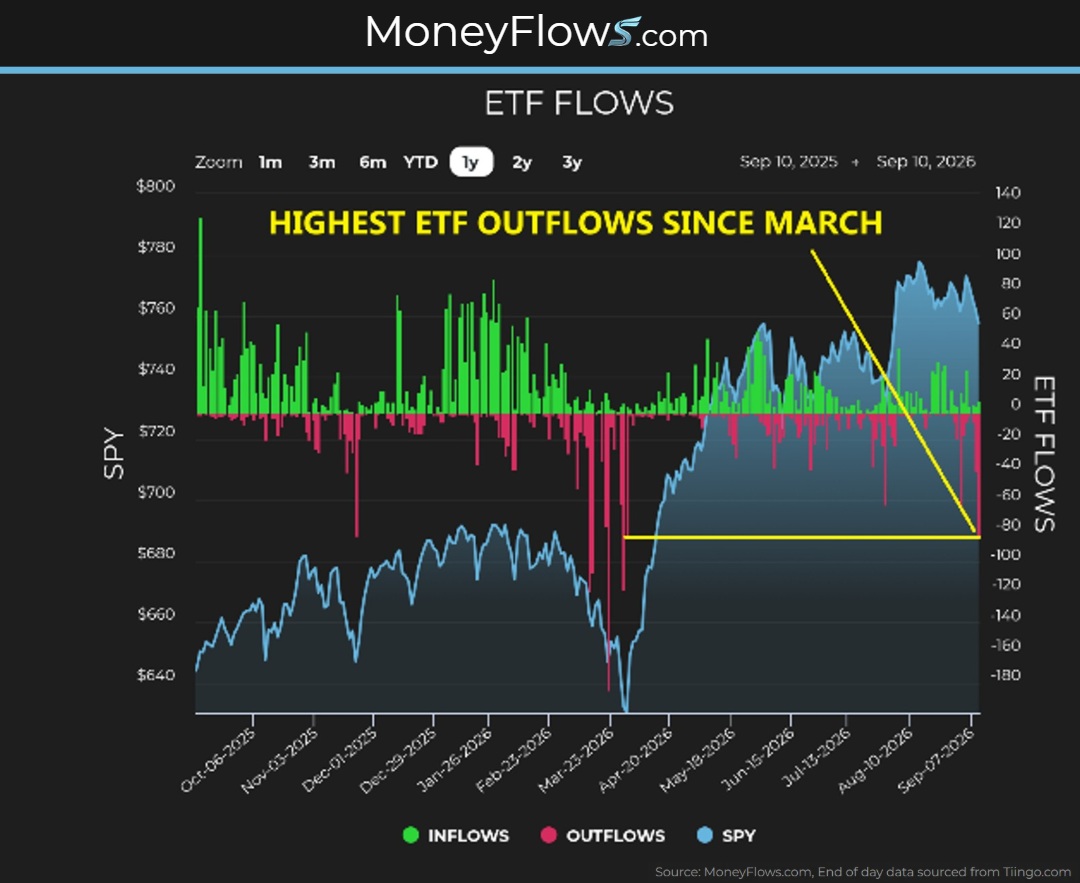
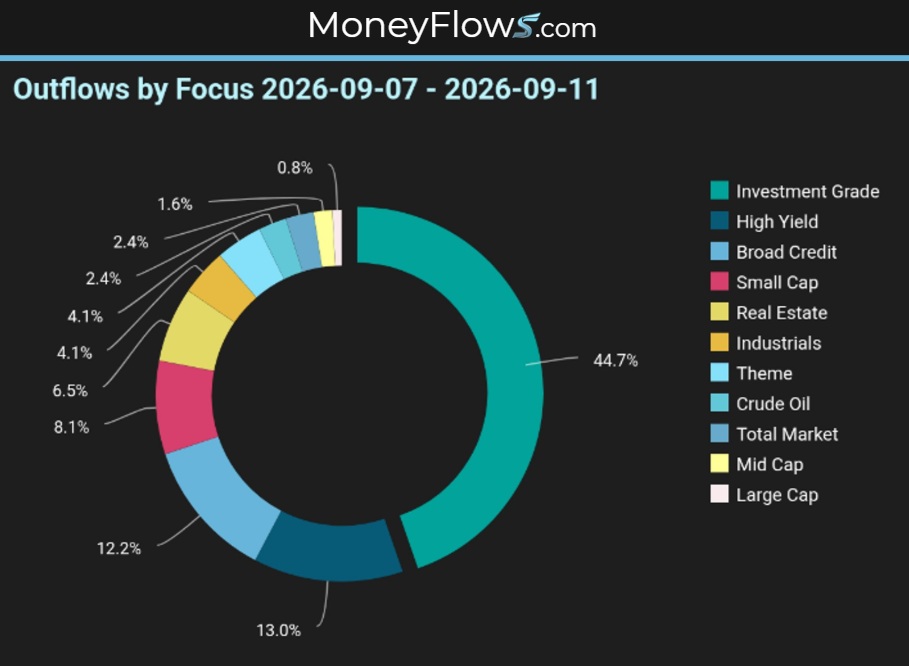
Exchange-traded fund flows confirm it. There were 86 fixed income ETF outflows across every maturity, credit quality, and geography. Alongside them, 34 equity ETFs were sold too:
The Context the Data Provides
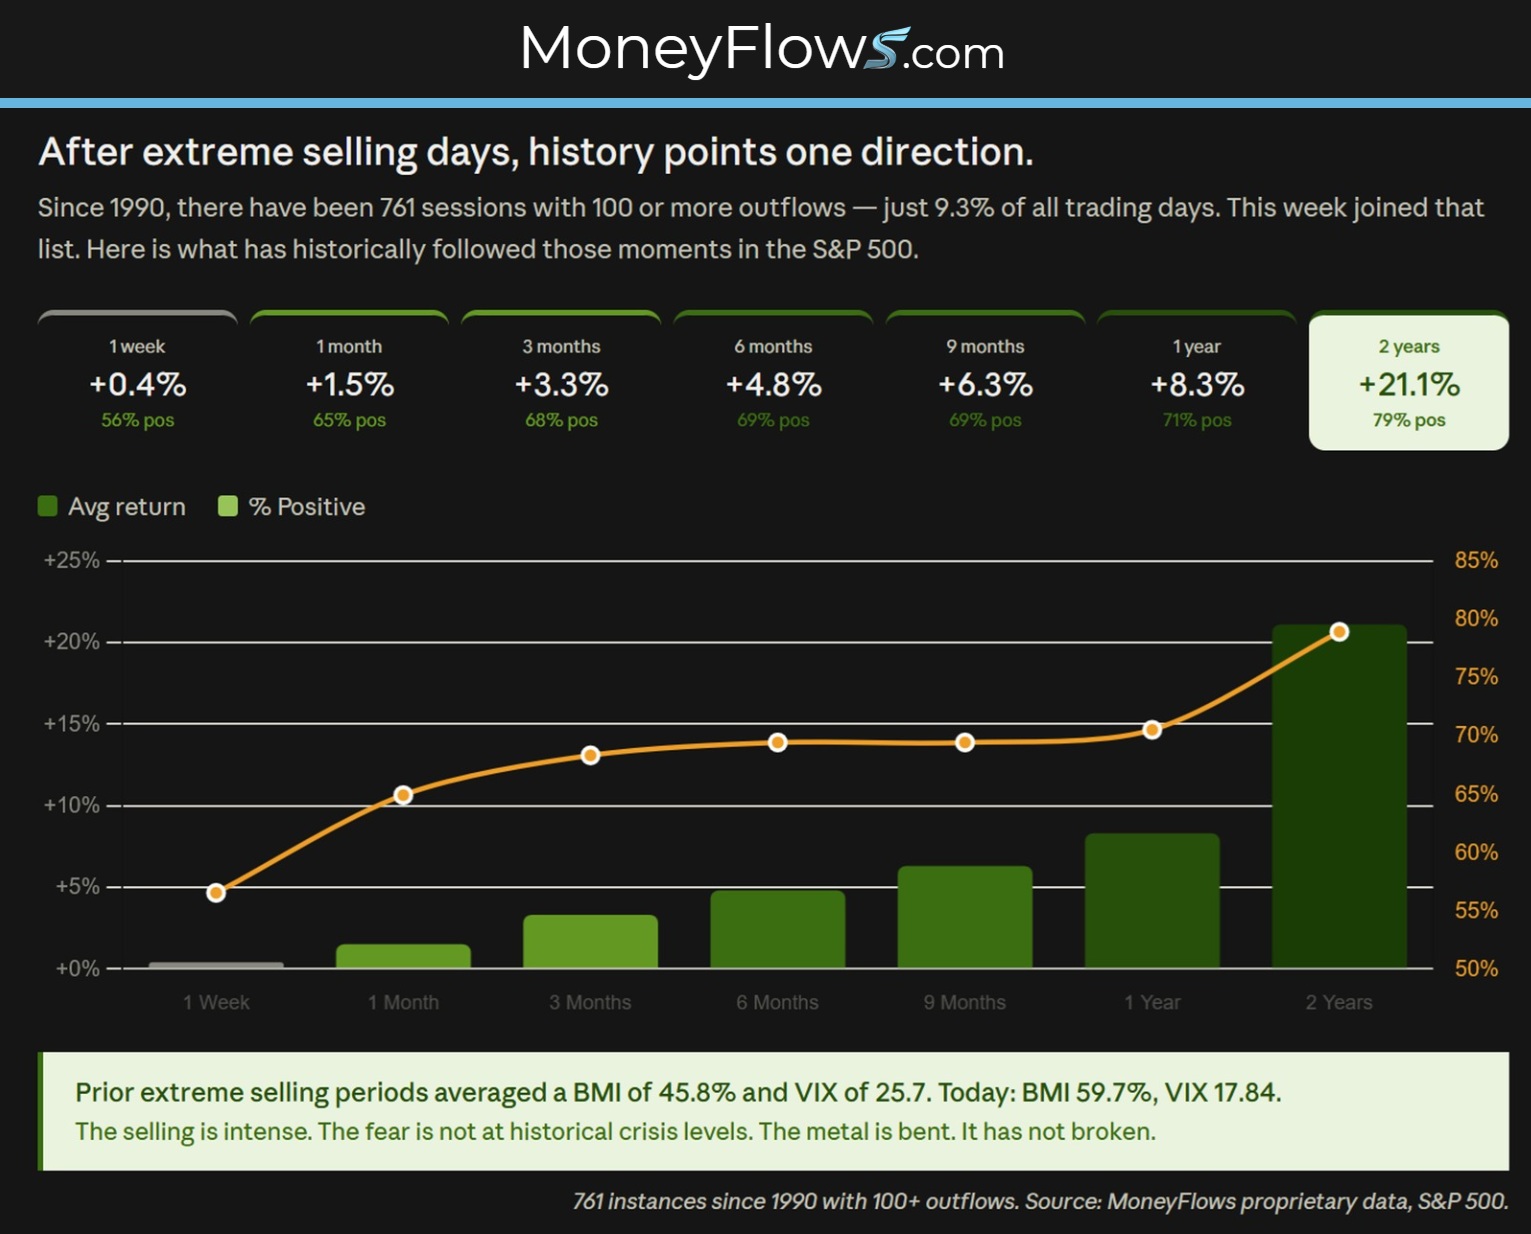
When things get bumpy, we think crisis. But here’s what makes now different: outflow counts exceeded 100 on Sept. 9-10. The 36-year daily average is 37, so 100 is nearly triple. Since 1990, there were 761 sessions with 100 or more outflows (including this week). Out of 9,214 trading sessions, that’s relatively rare. It’s about 9.3% of all days in 36 years.
However, the future looks bright. Check out the forward historical returns for instances of 100 outflows or more:
Stock Market Selloff & Oil Shock
The prior averages saw a BMI of 45.8% and a CBOE Volatility Index (VIX) of 25.7. This week’s BMI sits at 59.7% and the VIX at 17.84. Selling may be intensifying, but fear is not yet at historical crisis levels. The metal is bent, not broken.
Oil drives everything right now. The Strait of Hormuz handles one-fifth of global oil. Disrupt that flow and oil spikes, inflation rises, bond yields ramp, and the Federal Reserve faces pressure, even though monetary policy can’t produce oil.
Brent at $107 per barrel going into midterms is economically and politically untenable. The recent Venezuelan deal securing a 35% equity stake in 65 billion barrels of reserves suggests preparations began before the escalation. The incentives for resolution are enormous.
The latest consumer price index report shows why you need to look beneath the headline. The CPI rose 0.4% in August. Stripping out food and energy, core CPI rose 0.3%, above the expected 0.2%.
Unpacking it further, hotels and airline fares rose. August was a heavy travel month. Medical care and car insurance costs fell. Inflation wasn’t accelerating everywhere.
Still, the CME FedWatch probability of a September rate hike blasted to roughly 90%.
That puts the Fed in a tough spot. Higher rates can squelch demand, but they won’t make more oil or reopen blocked passages. Higher rates only add pressure to consumers getting killed at the pump.
When the oil shock fades, inflation pressure fades with it. If it doesn’t, the Fed’s job gets harder.
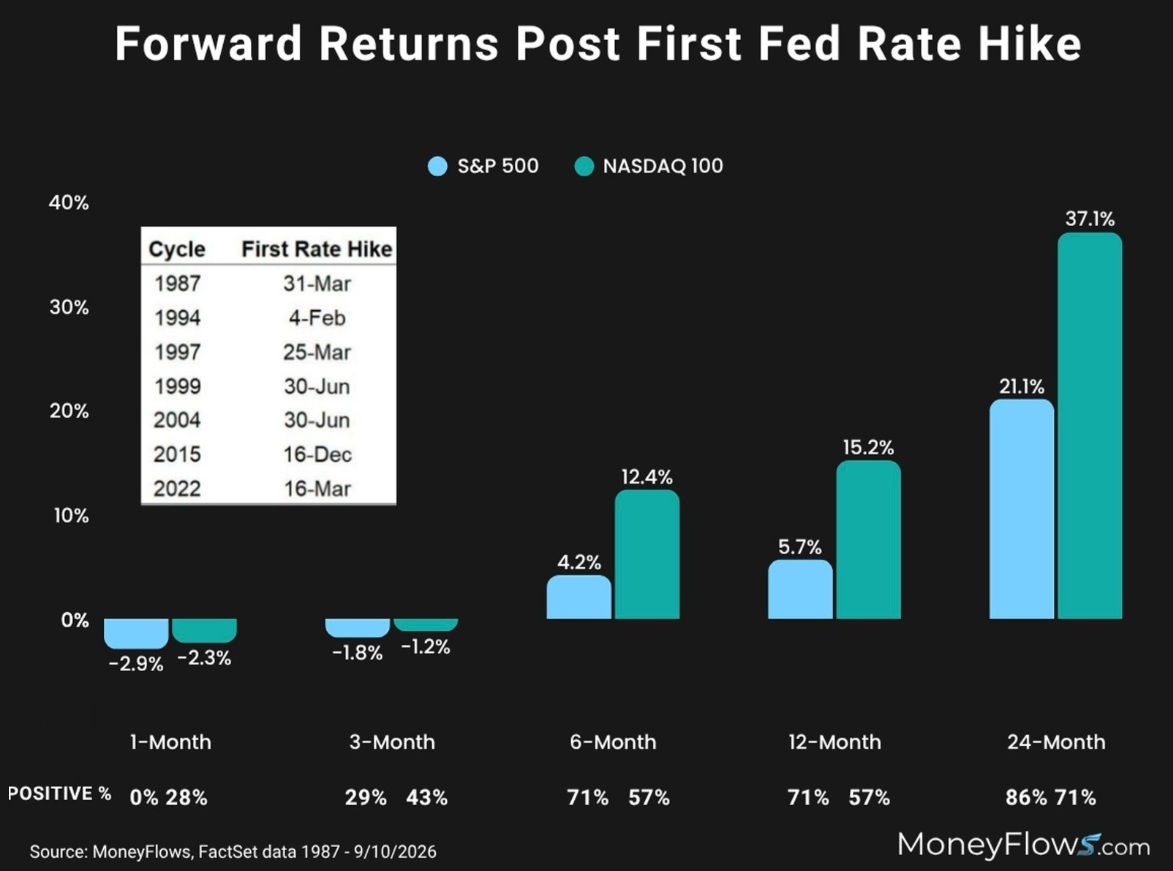
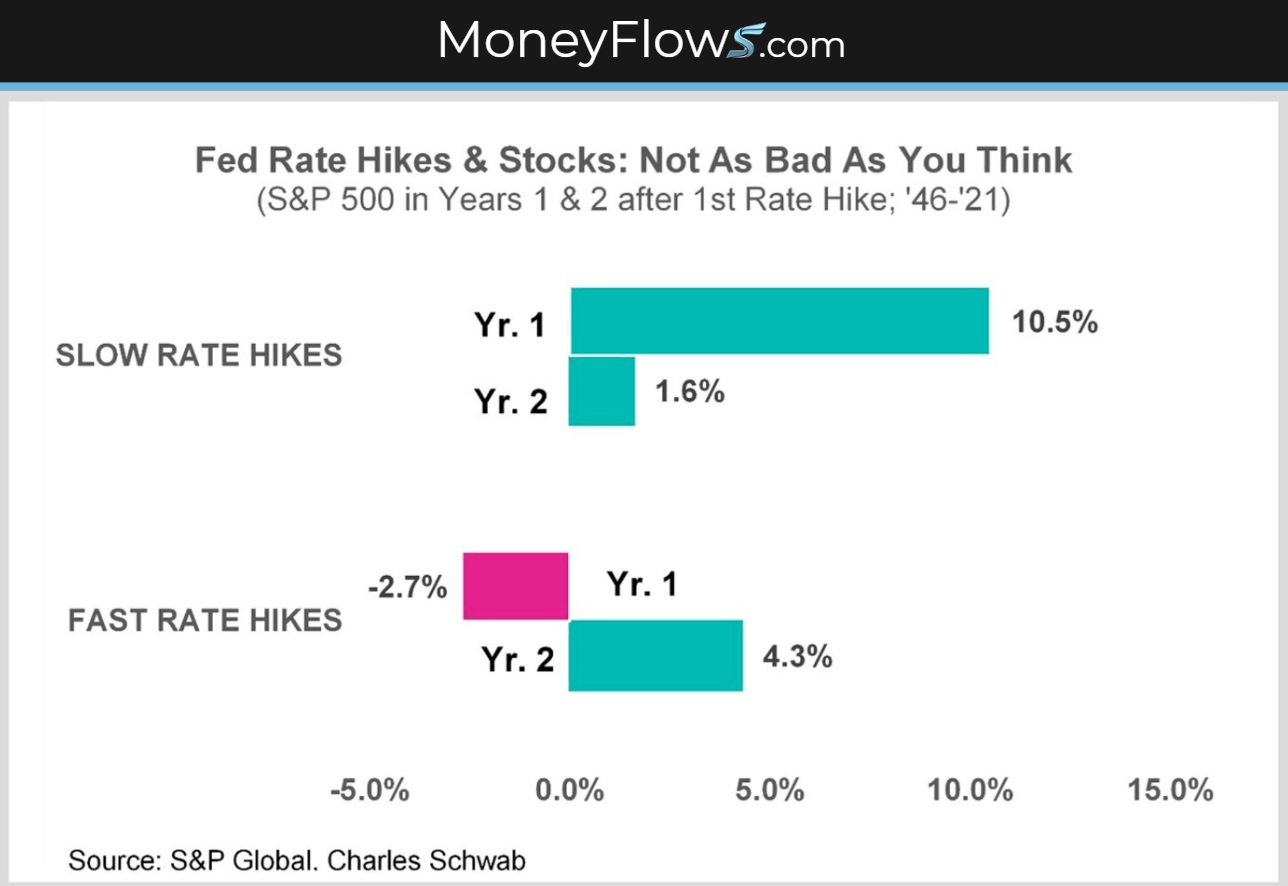
But don’t fear rate hikes yet. History shows how slow rate hikes don’t bother stocks, but fast ones do:
Why October Could Trigger a Market Rally
The Roadmap Has Mile Markers
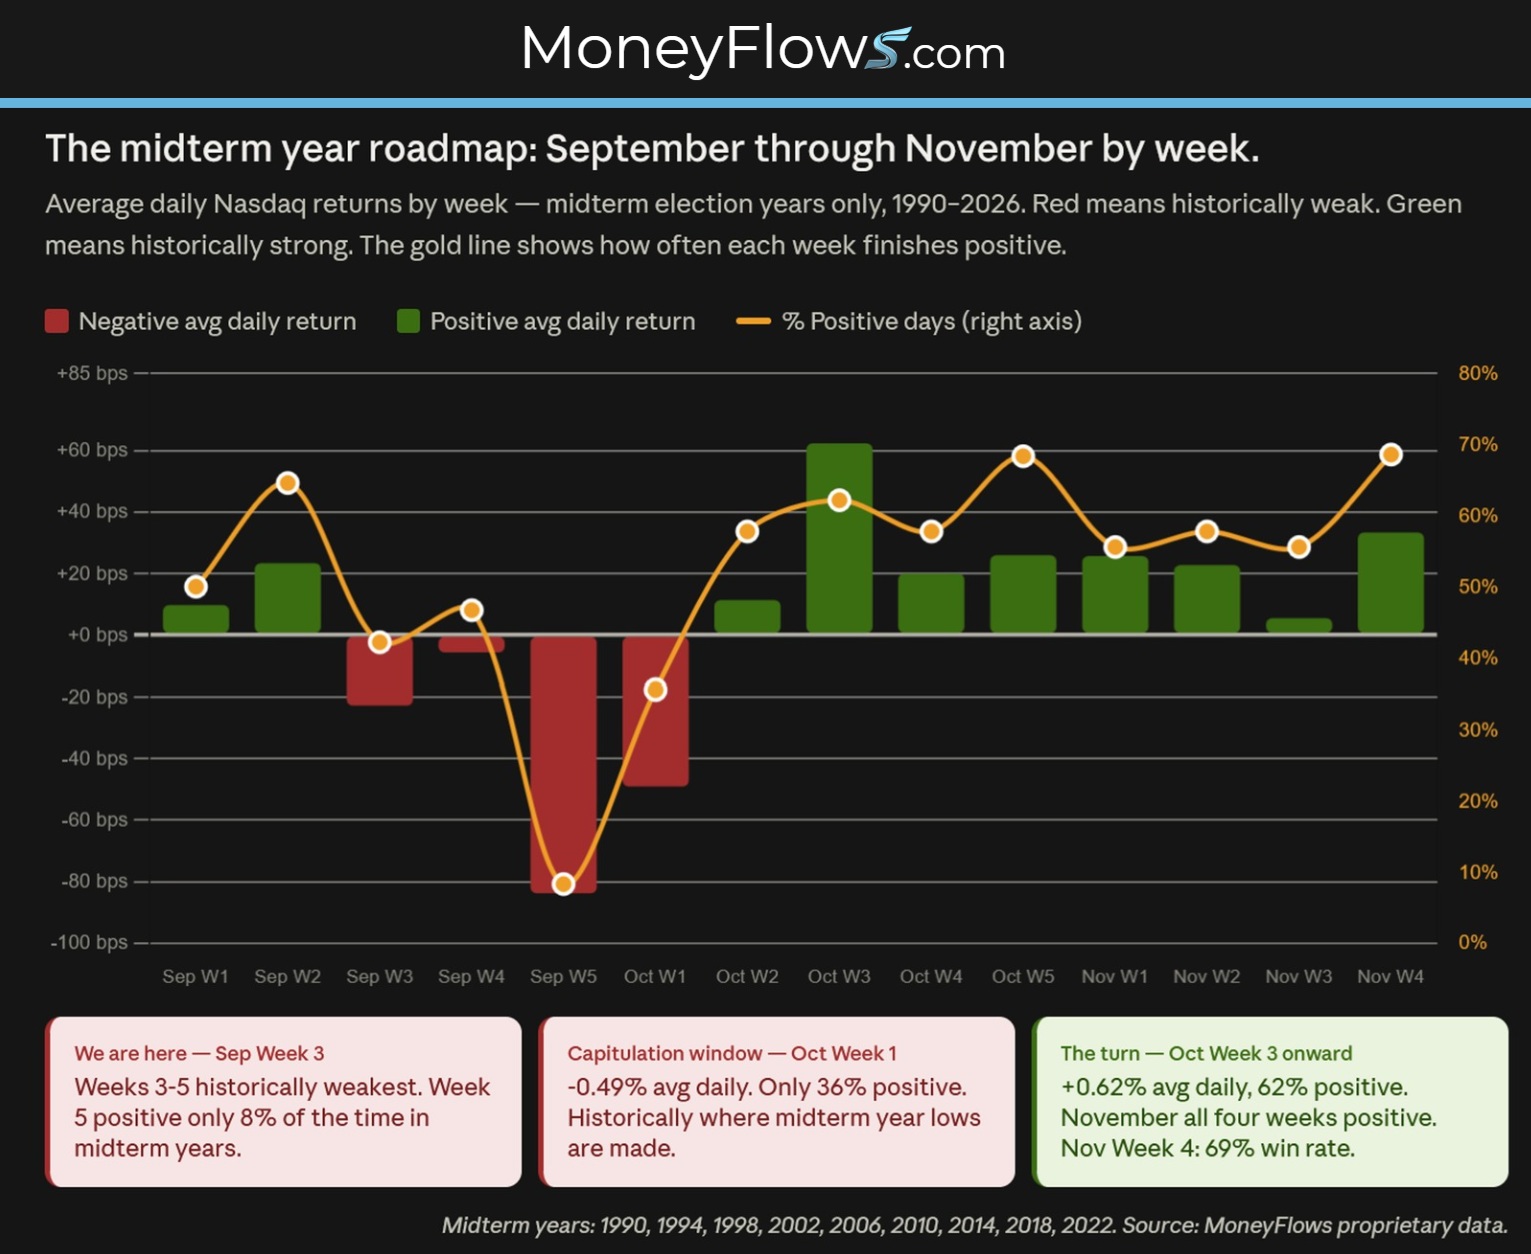
Let’s see some useful data. Using daily Nasdaq composite returns since 1990, we can identify weak months and the weeks within those months that carry the most historical weight.
September’s third and fourth weeks are historically the weakest of the month, averaging negative daily returns with less than 48% of days positive. We are entering that window now. In midterm election years, the pattern is even more pronounced, with the fifth week of September averaging losses in more than 90% of historical instances.
October’s first week is historically the worst of the entire month in midterm years, averaging a daily return of -0.49% with only 36% of days positive. That is typically the capitulation window.
But October’s third week is the strongest of the month, averaging 0.62% per day with 62% of sessions higher. The turn happens fast.
Midterm Novembers have been consistently positive all four weeks. Week four of November averages positive returns with a 69% win rate. That’s usually when the midterm rally locks in. December is modest by comparison. The heavy lifting happens in November.
We expected bumpy. It got bumpy.
The data says relief comes in October.
Sector Spotlight
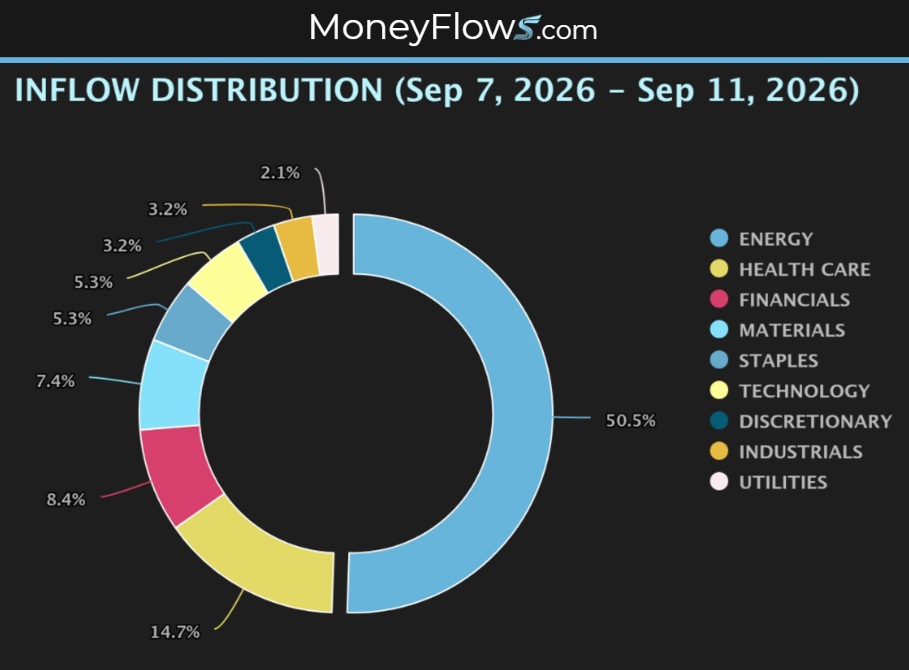
Energy led all sector inflows, as E&P producers saw direct bets on sustained oil prices. Health care, which had posted 11 consecutive weeks of inflows, saw net outflows this week as the broad risk reduction swept through everything.
Discretionary had the most net outflows (95), with consumer-facing names bearing the brunt of inflation and rate anxiety simultaneously. Real estate followed at 52 net outflows, and industrials at 32.
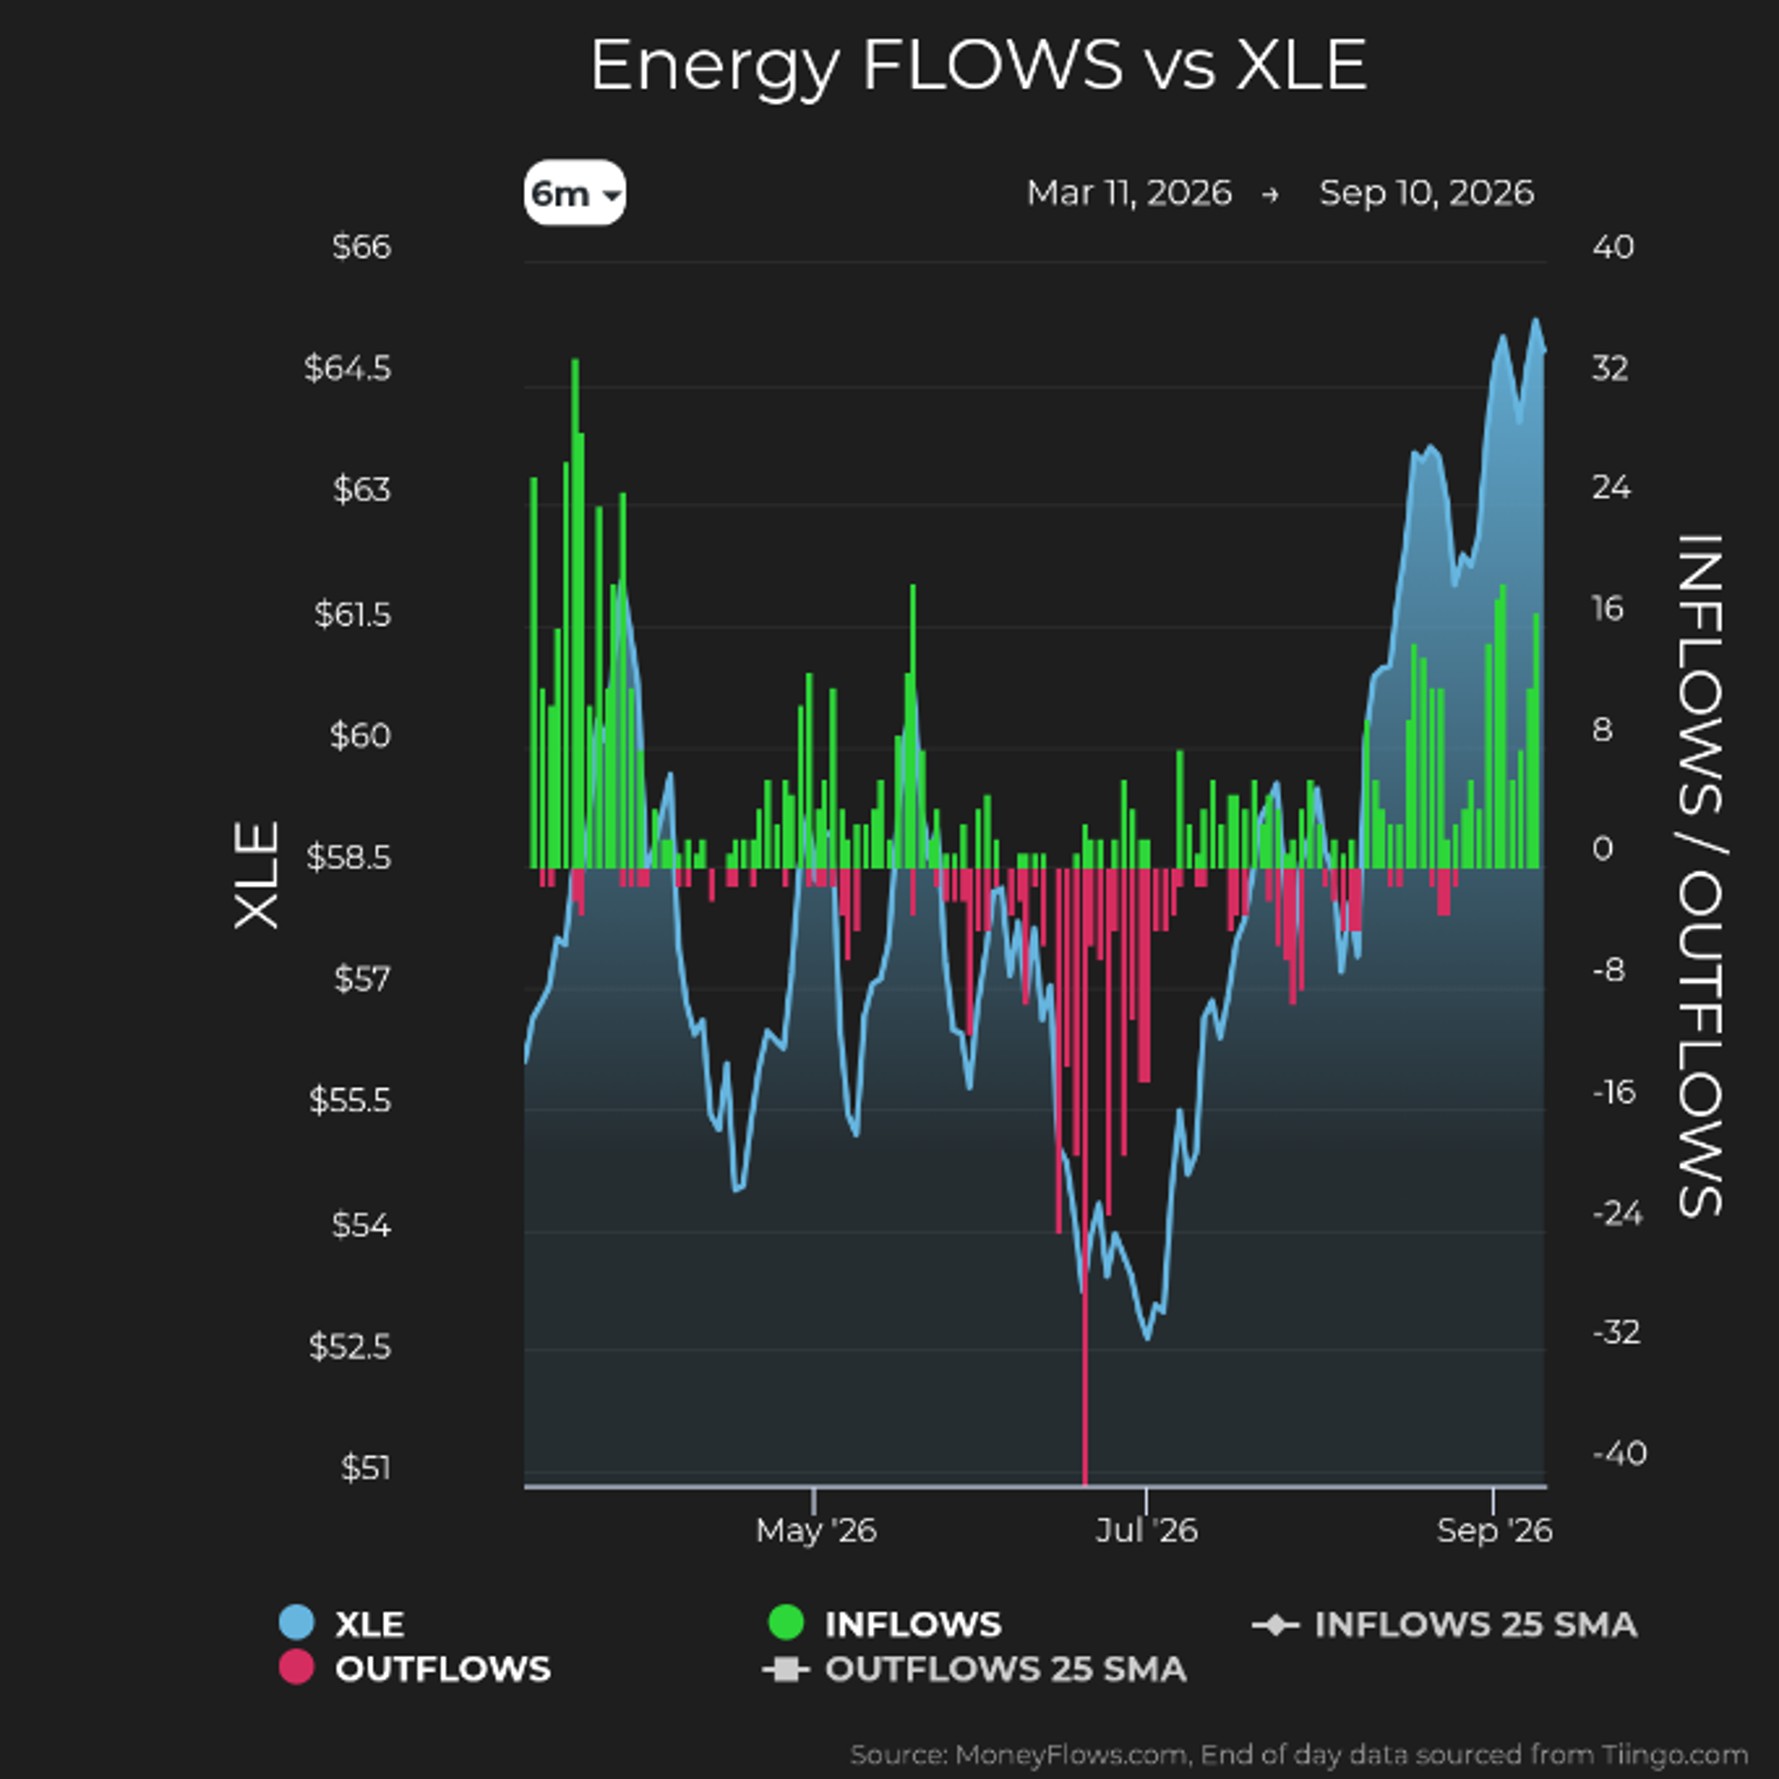
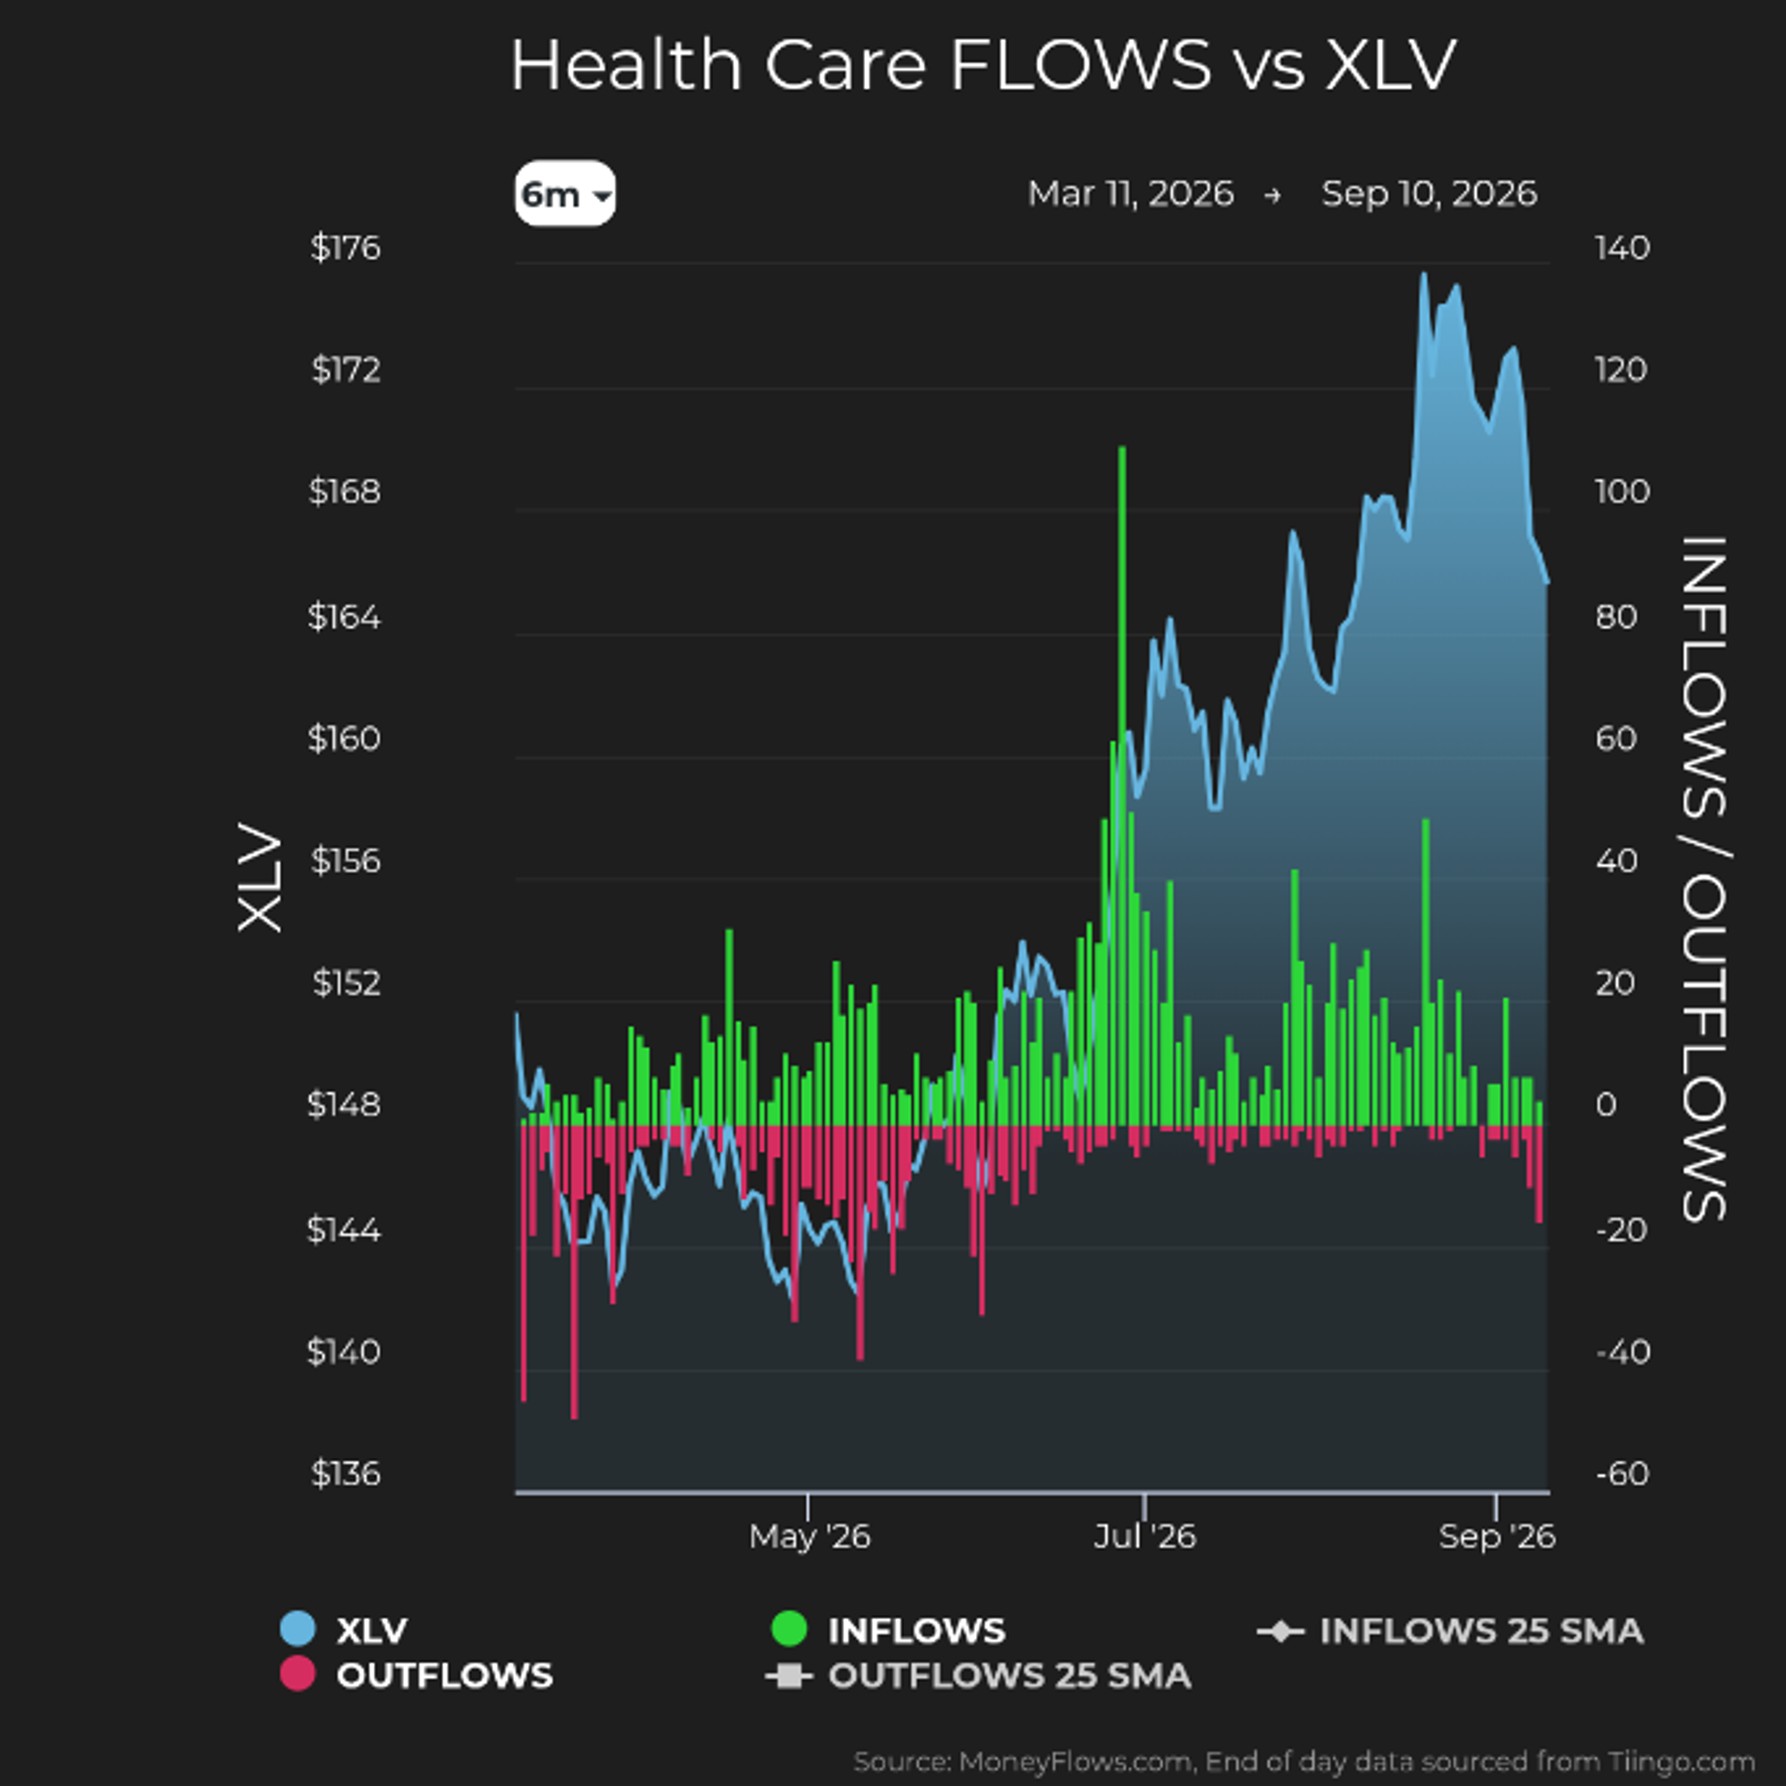
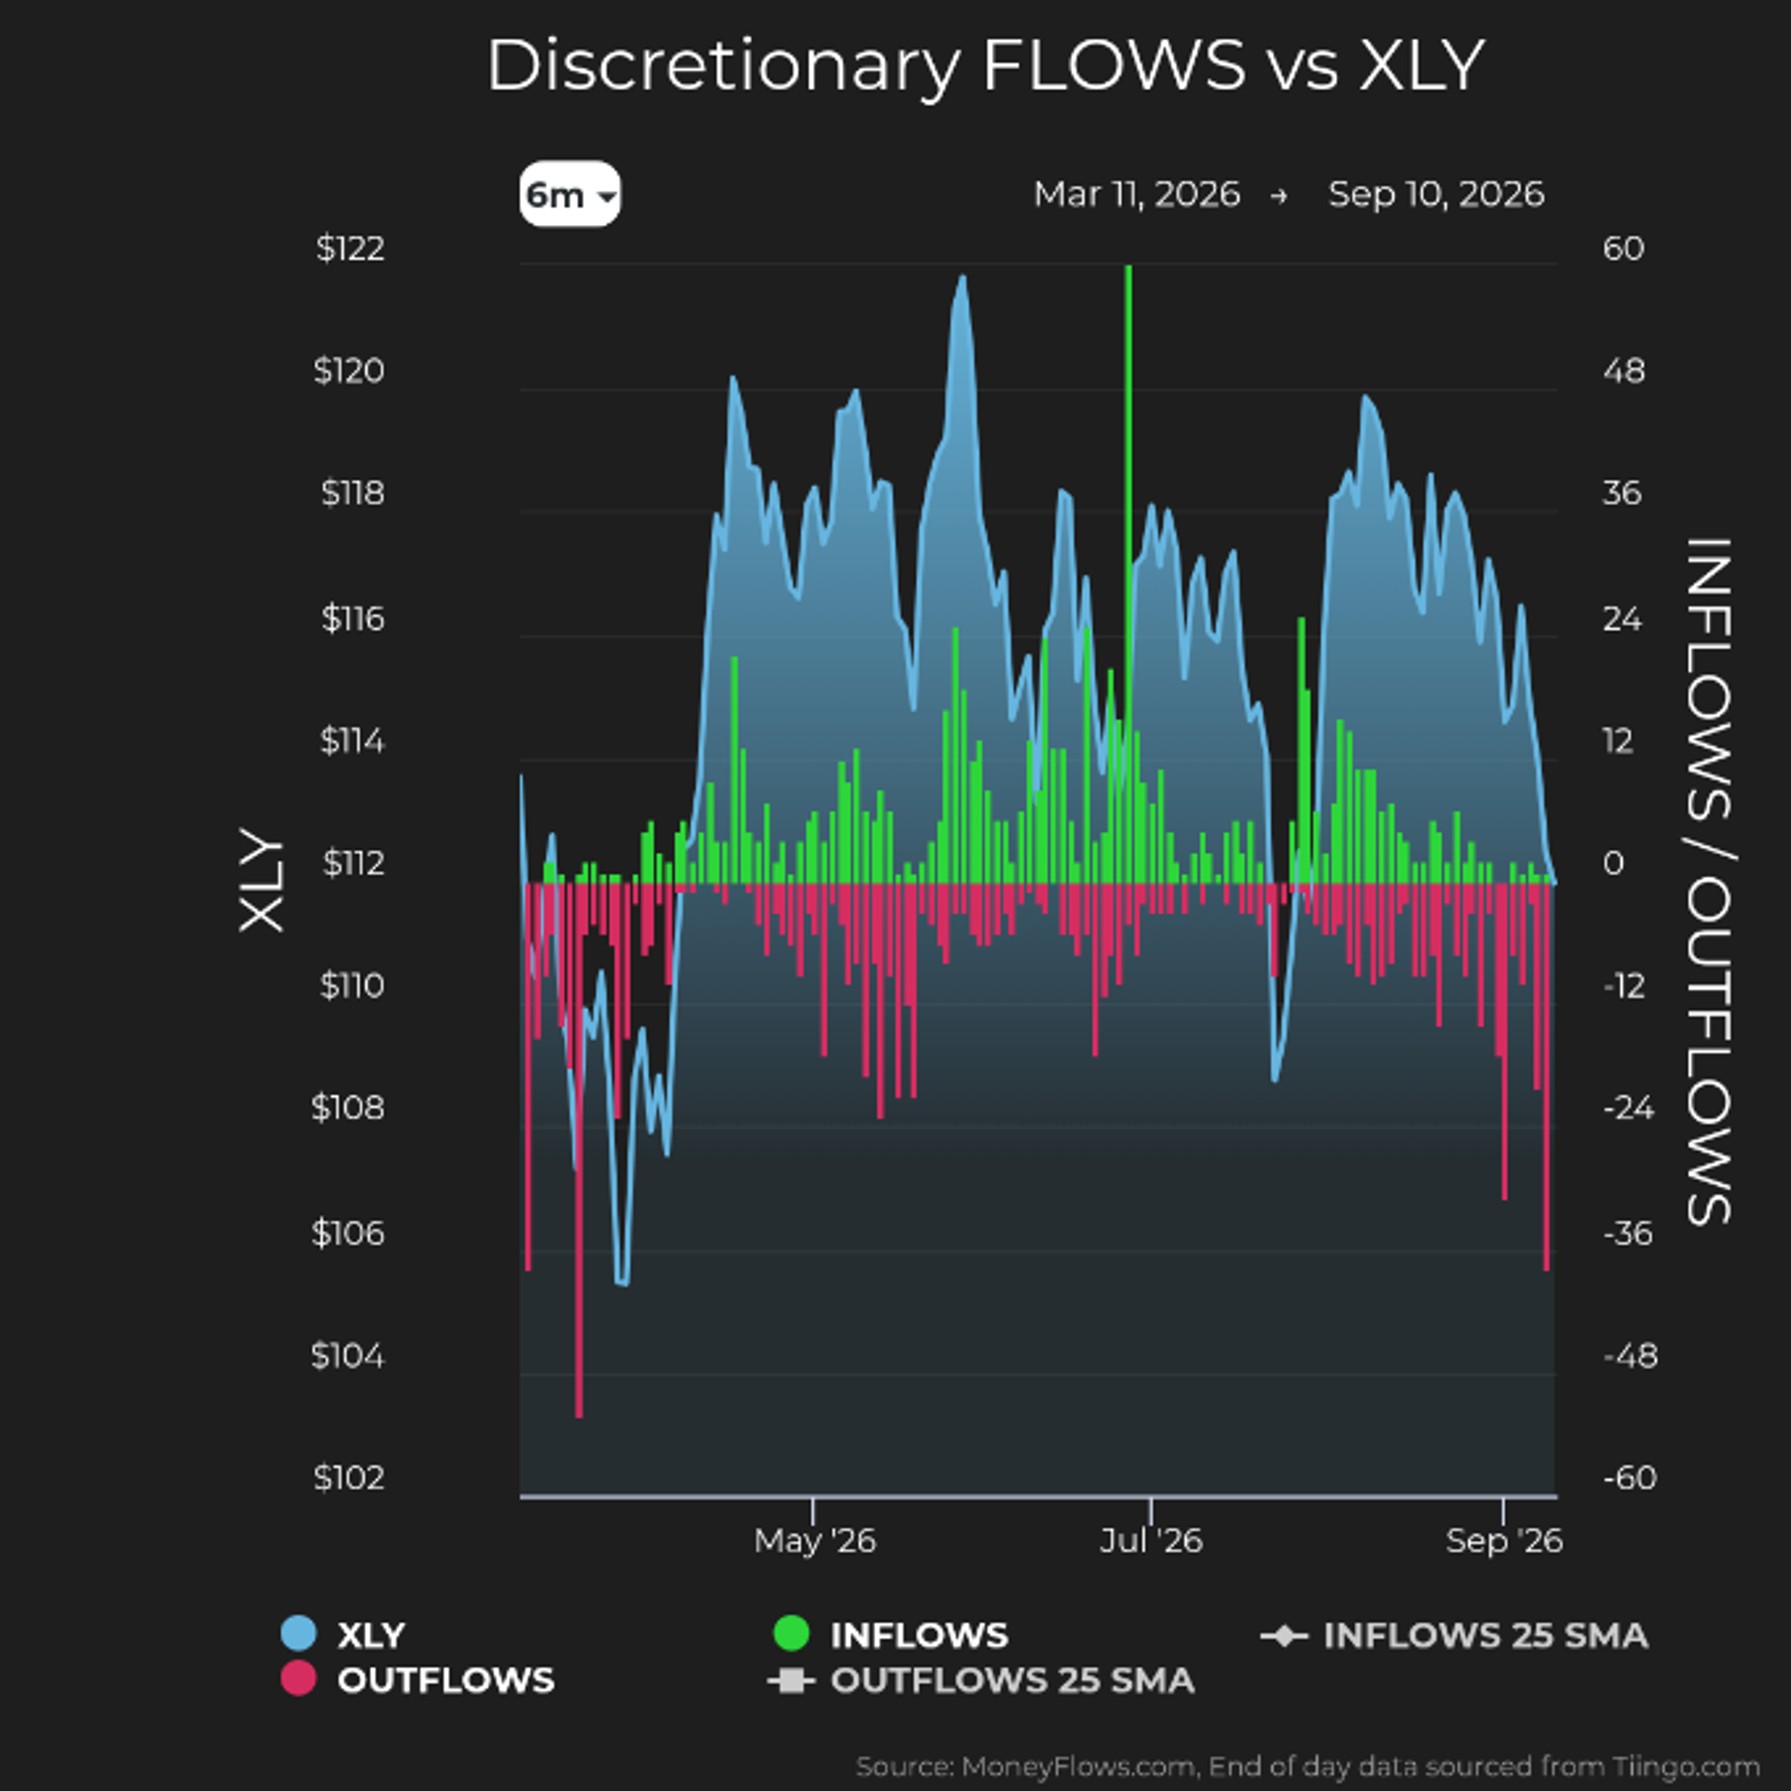
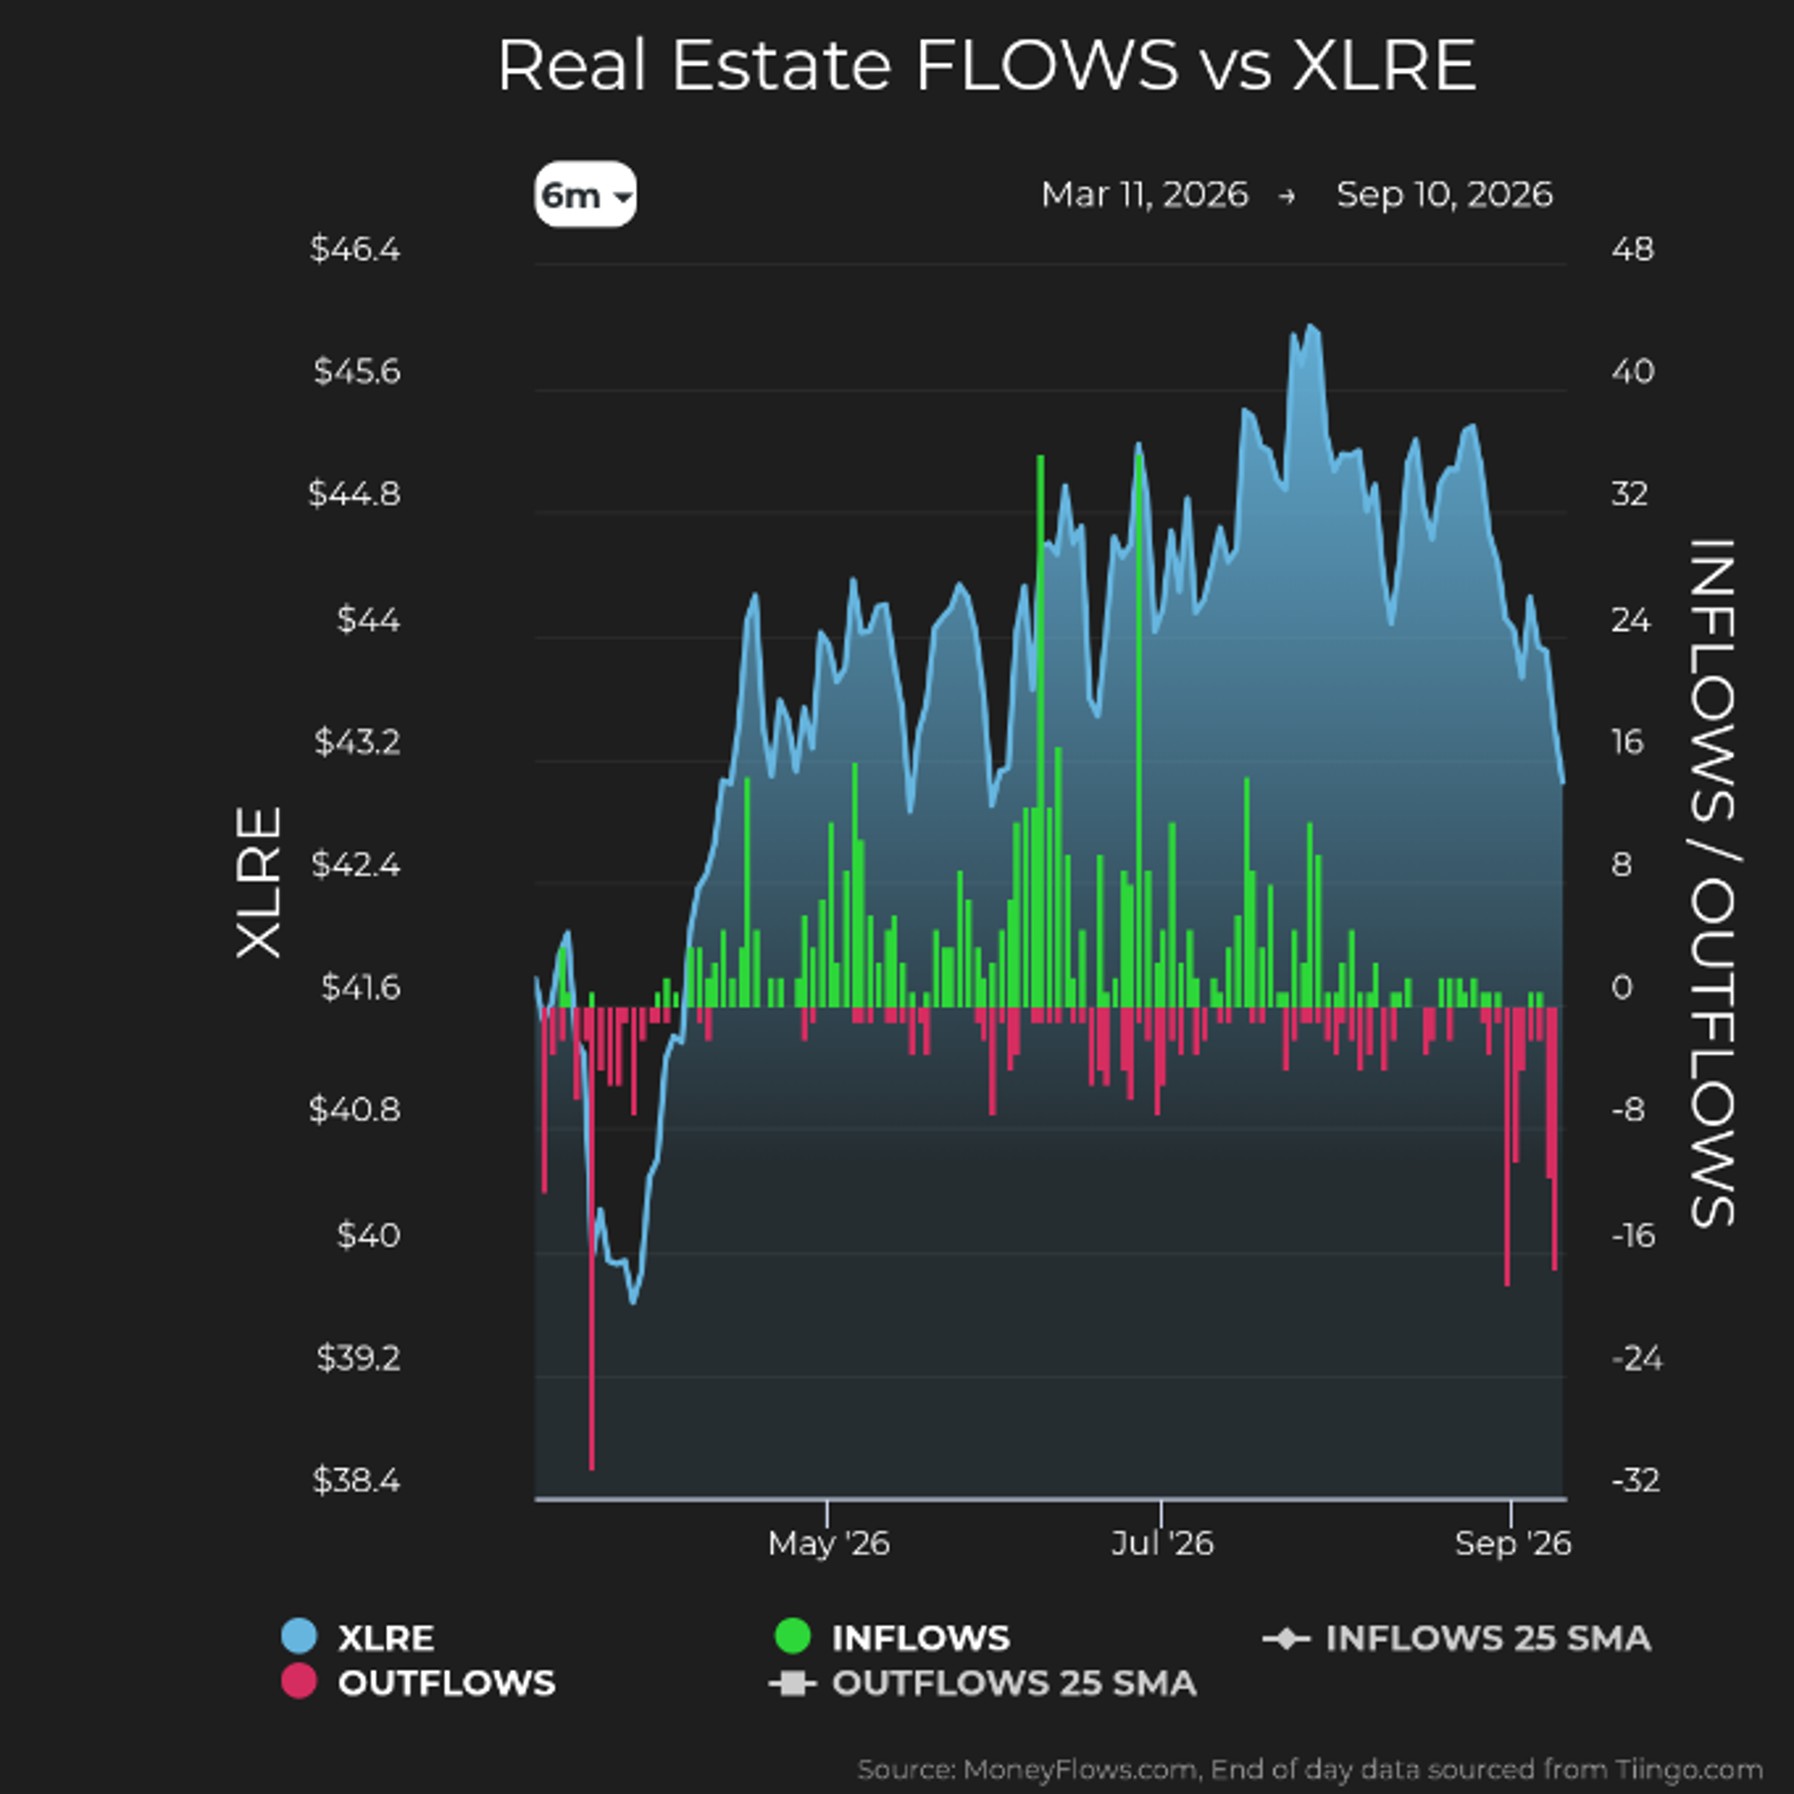
Energy captured 50.5% of all equity inflows this week, with one sector absorbing more than half of everything institutions were willing to buy. When half of all buying concentrates in a single sector, the market is not rotating anymore. It is chasing return. Oil is the lever that explodes margins for energy producers. Someone always profits.
Selling this week was not concentrated in one area. It was distributed across nearly every sector outside energy. That is the signature of macro-driven risk reduction, not sector rotation.
The Shape Memory Effect
Nitinol doesn’t gradually ease back into shape. It snaps.
The transition happens at a specific temperature. Below it, the metal holds the form imposed by pressure. Above it, the original shape reasserts itself.
The trigger for markets is a resolution in the Strait of Hormuz. When it comes, the unwind won’t be gradual. Oil will fall. Inflation fears will recede. Bond yields will compress. Growth stocks will reprice. The speed of the selloff will characterize the recovery.
The metal remembers what it was supposed to be.
As Seneca wrote, “Fire is the test of gold. Adversity, of strong men.”
Our PRO subscription allows you to spot daily flows and access our weekly Outlier 20 report.
This is the report that has found EVERY SINGLE ONE of our Outlier stocks.
Enjoy a click-through experience unlike anything out there.
Professional money managers and RIAs looking for additional portfolio solutions including ETF flows & ranks and your own Portfolio Tracking tools, please reach out about our Advisor Solution and Emerging Advisor Program.
September is the fire, but the shape is still underneath.
AND don’t miss my sit-down with Market Insider to blow the lid off how Wall Street’s “Big Money” actually operates—and how retail investors can ride their coattails.
Have a great week!
***Lastly, join me LIVE, October 5-7, 2026, at the MoneyShow TradersEXPO in Orlando.
You don’t want to miss this! Click the image below to reserve your spot.