

Bearish Sentiment Signal Says New Highs Are Coming
by Alec Young All, Macro Insights, StocksYou hear it every year: “Don’t buy stocks in September.”
It’s by far the most widely cited seasonal trend.
Fortunately for the bulls, we see a constructive path.
As you’ll see, one bearish sentiment signal says new highs are coming as soon as year-end.
While September is off to a rocky start, don’t get spooked.
We can’t dismiss the challenging macro. However, 2-evidence rich studies point to big opportunities ahead.
You just need to narrow your buy-list…and follow the flows.
Let’s begin with a valuable signal to heed for September.
Momentum Determines September Stock Performance
While September’s average return of -0.7% is the worst of any month, you have to dig deeper for the real opportunity.
Not all Septembers rhyme.
September’s red performance is skewed lower by a few nasty outliers:
- September 2002 saw an 11% drubbing
- September 2008 saw equities slied 8.9%
- September 2011 the SPX fell 7.2%
- September 2022 large caps slid 9.4%
However, the median decline is only half as bad at -0.3% with 47% of Septembers positive since 1950.
Here’s the best part: When market momentum is strong, September has been a good month.
The S&P 500 ended August at 7686, well north of its 200-day moving average down at 7136.
Since 1950, when the S&P 500 is above its 200-day moving average going into September, the average price gain for the month is a healthy 1.3%, with a 61% positivity rate.
This compares to an average September price decline of 4.2% and a positivity rate of only 15% when the index is below its 200-DMA going into the month:
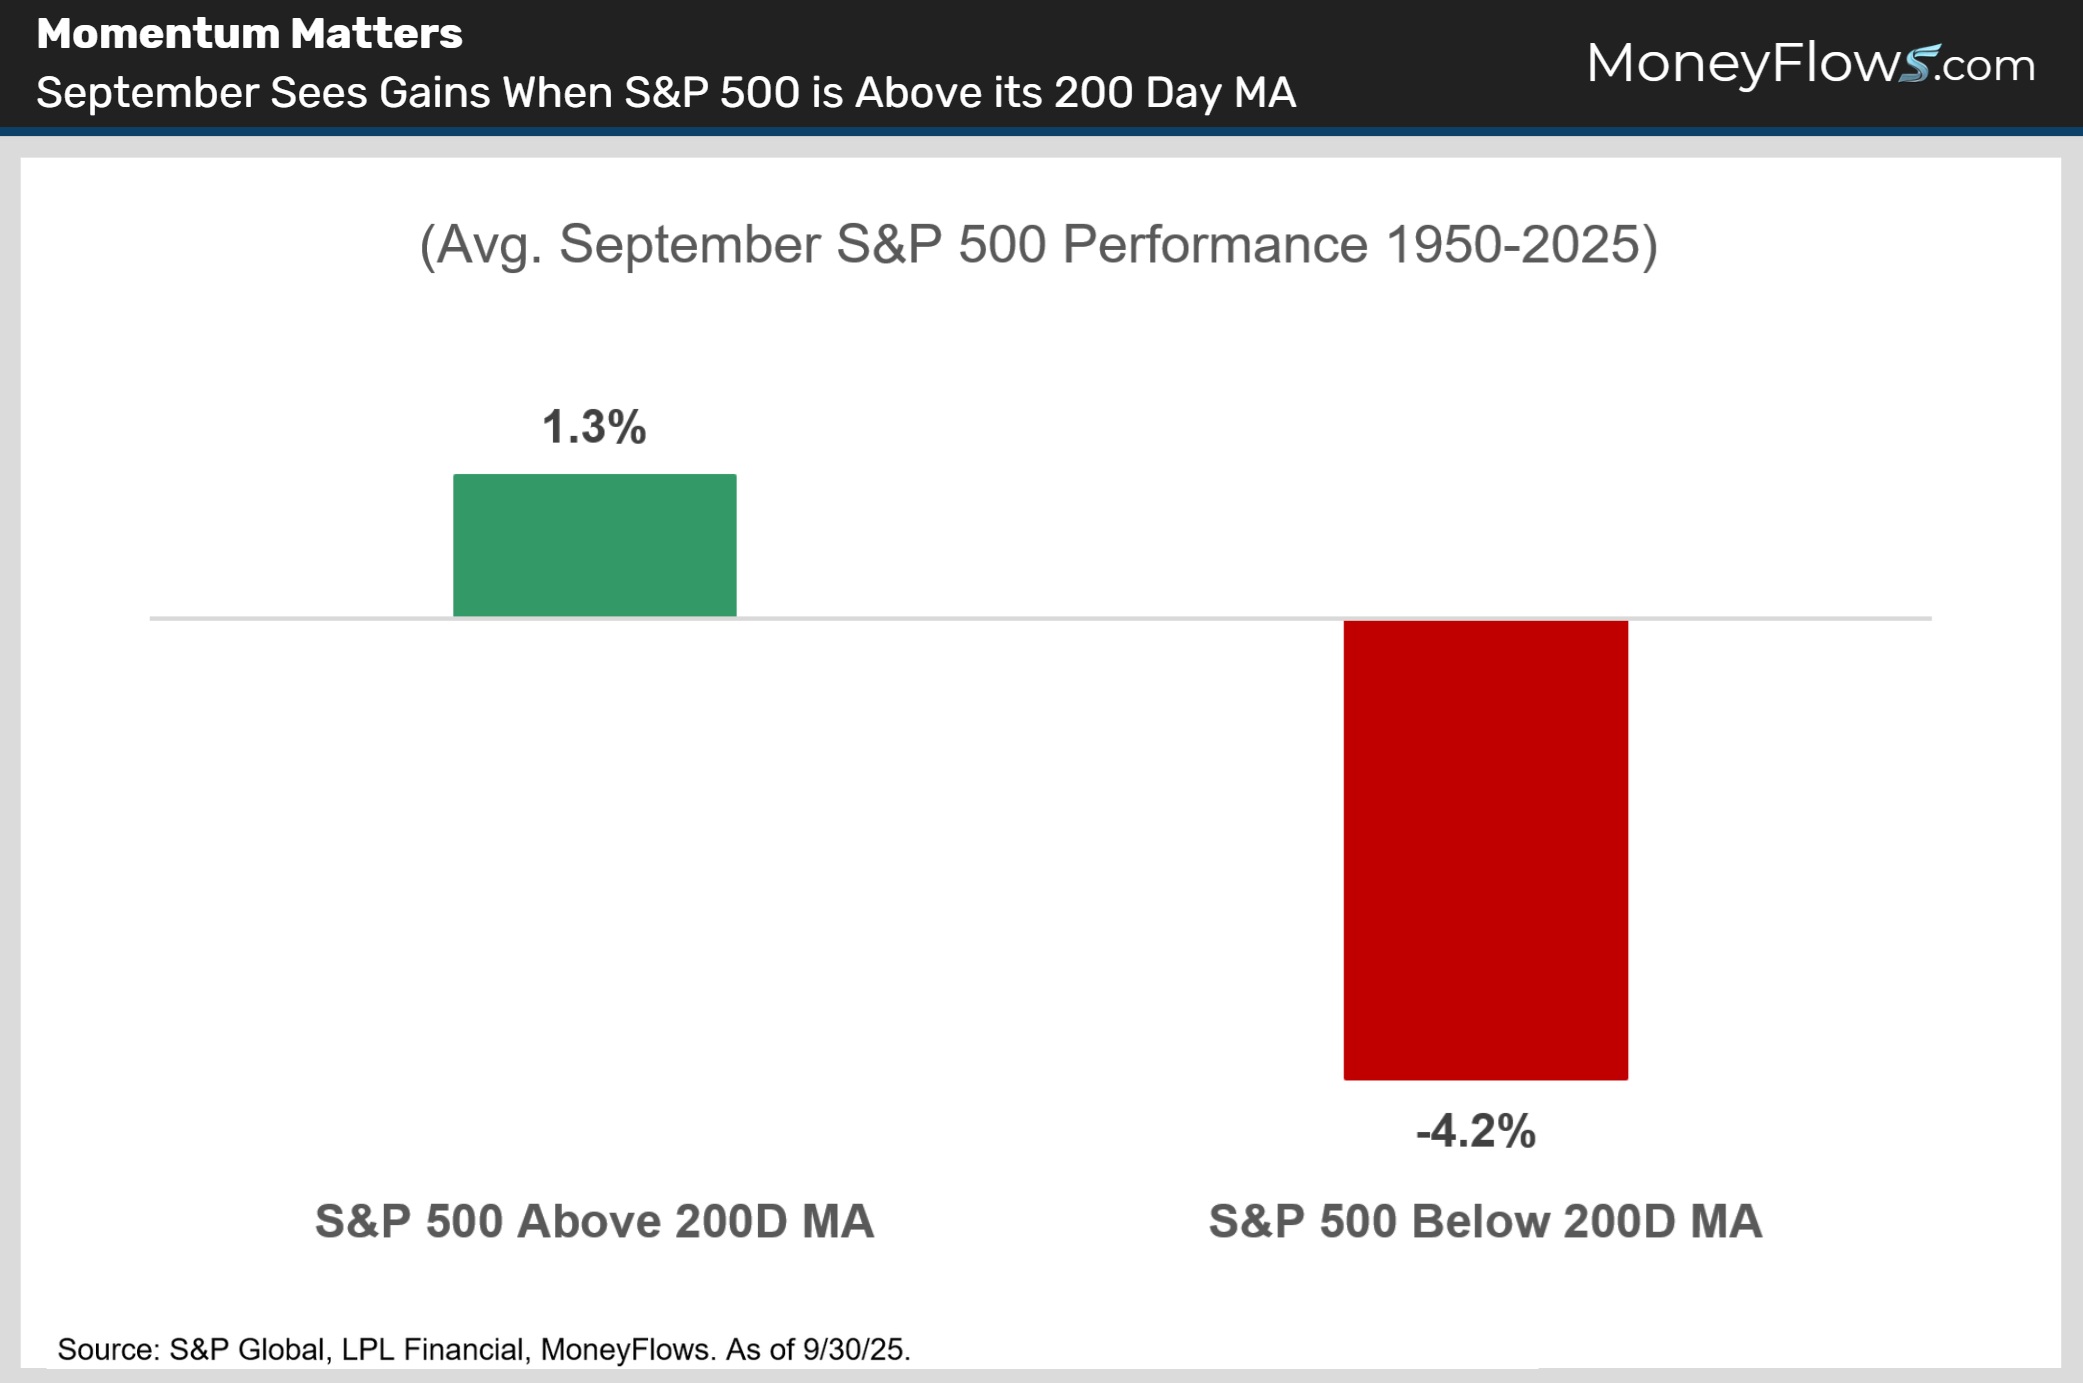
The trend is your friend in September. When market momentum is strong it’s been a good month.
This is part 1 of why you should remain constructive on stocks.
Up next reveals how new highs could be around the corner.
Bearish Sentiment Signal Says New Highs Are Coming
Investors are in a cautious mood.
Typical cautious seasonality is being exacerbated by handwringing about the war, inflation, oil prices, rising rates and the specter of Fed rate hikes.
The American Association of Individual Investors (AAII) surveys its 2 million members weekly to see how they’re feeling about stocks.
It can be a volatile series, so we track the 4-week average of bullish minus bearish investor sentiment readings.
The median reading is +7% since 1987, highlighting that there are usually more bulls than bears around.
That’s not the case today.
The latest reading has bears outnumbering bulls by 4%. That’s 11% below the long-term median:
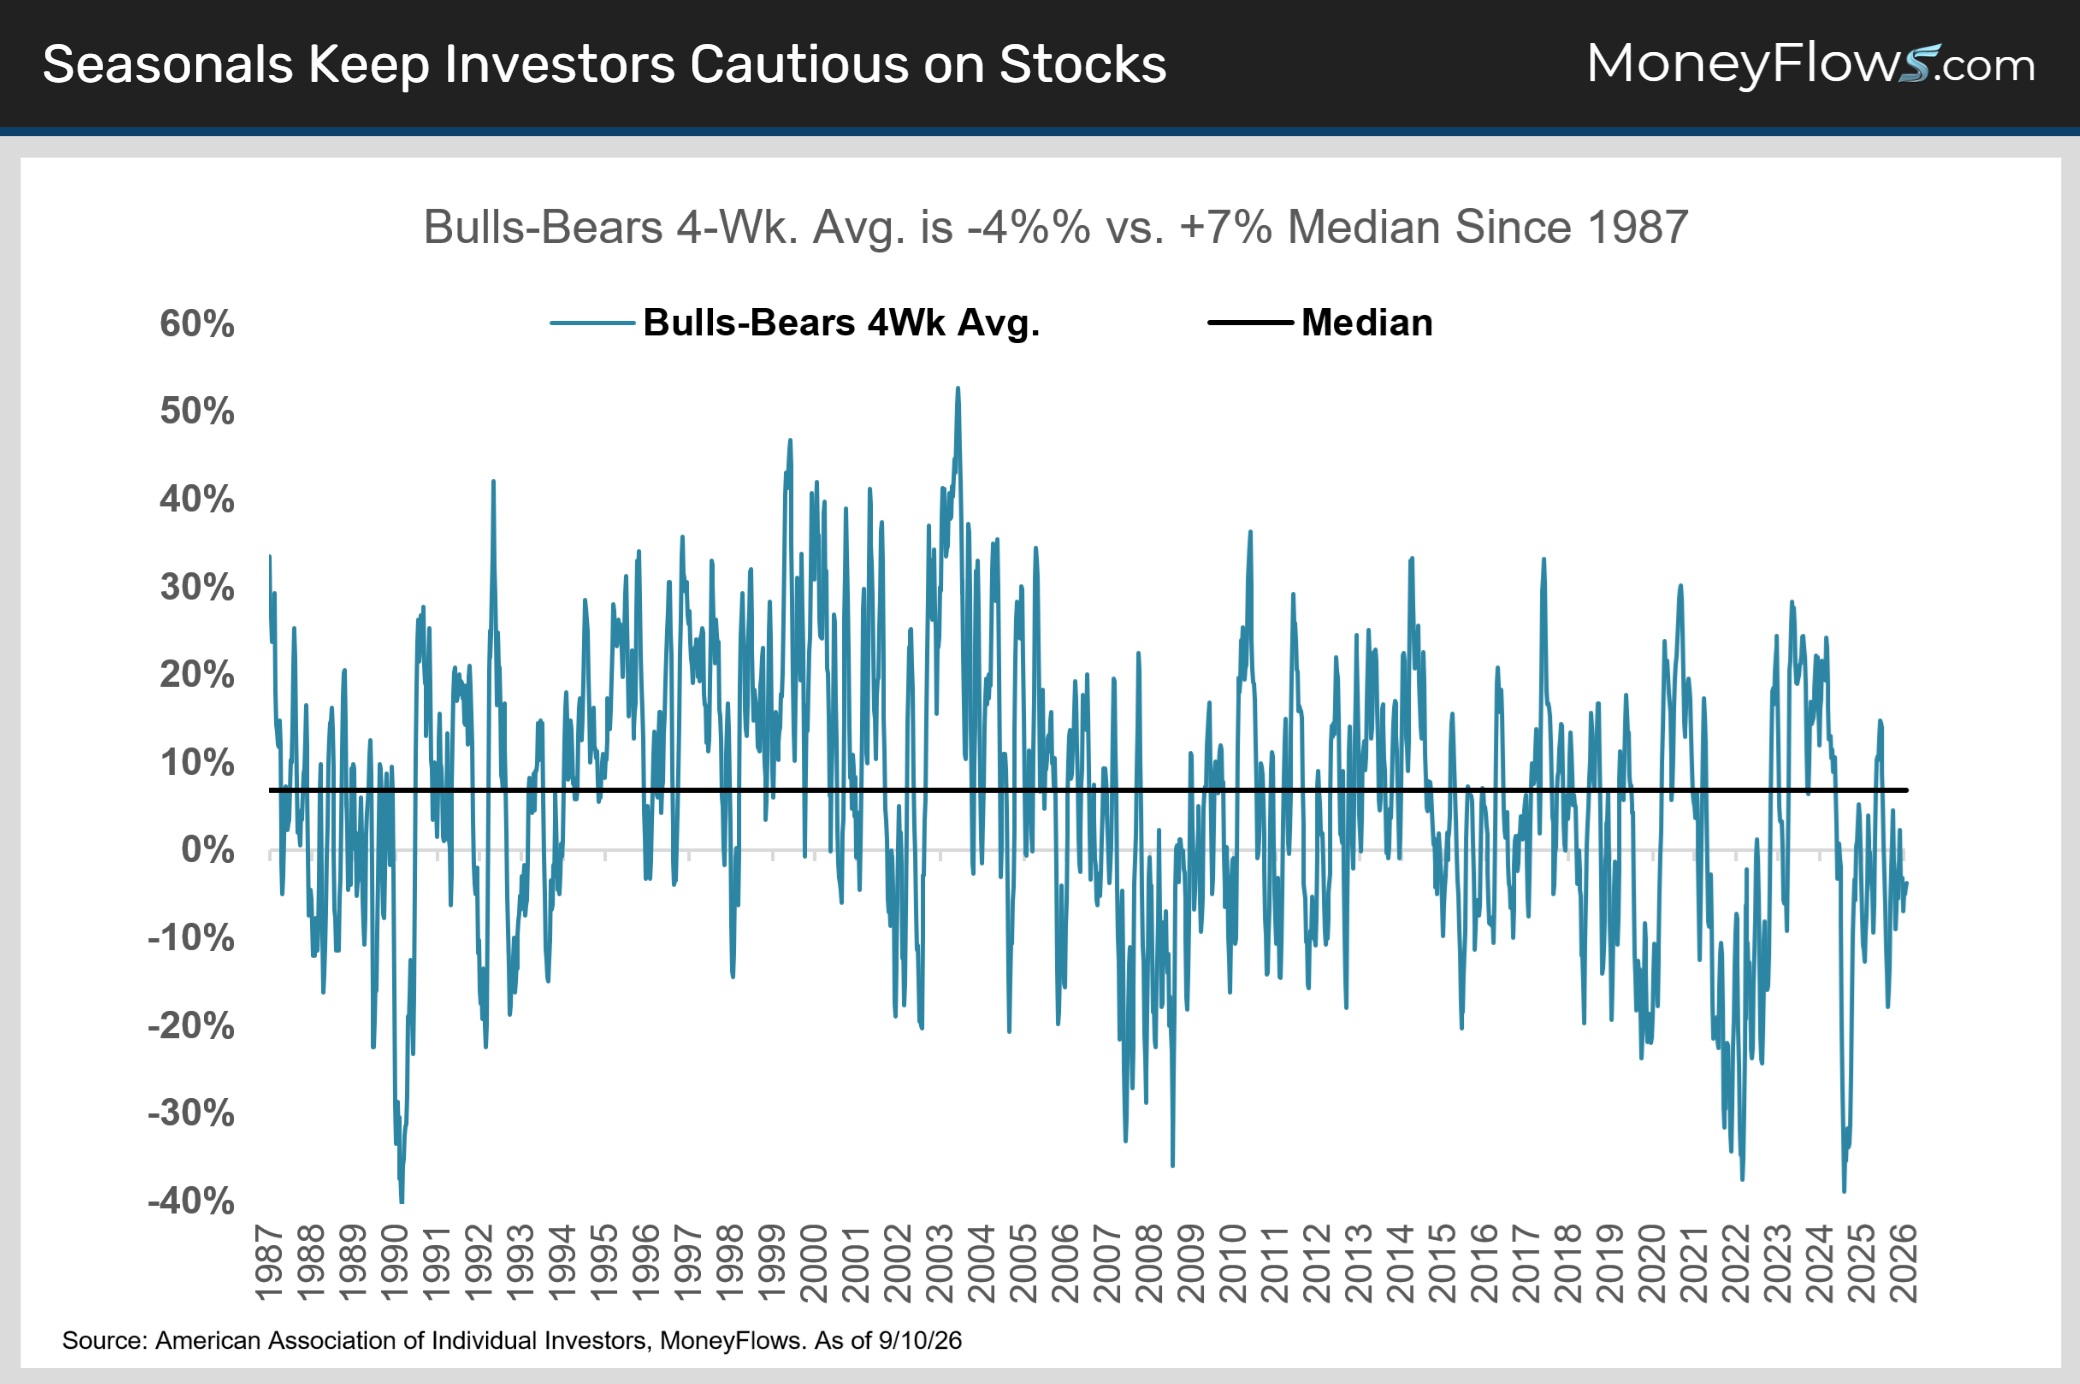
Next time someone yells signs of froth are here, show them this chart!
Now, let’s take it step further by highlighting what comes next…gains.
The more bearish sentiment gets, the better the historical odds for future upside.
Why?
Markets are much more likely to peak on optimism than pessimism.
None of this guarantees smooth sailing – and there are always exceptions - but history suggests that when sentiment hits bearish readings, the odds tilt toward opportunity (chart).
The current sentiment falls into the 2nd lowest quartile reading.
Looking back, the S&P 500 averages solid 5% six-month returns after similar sentiment troughs:
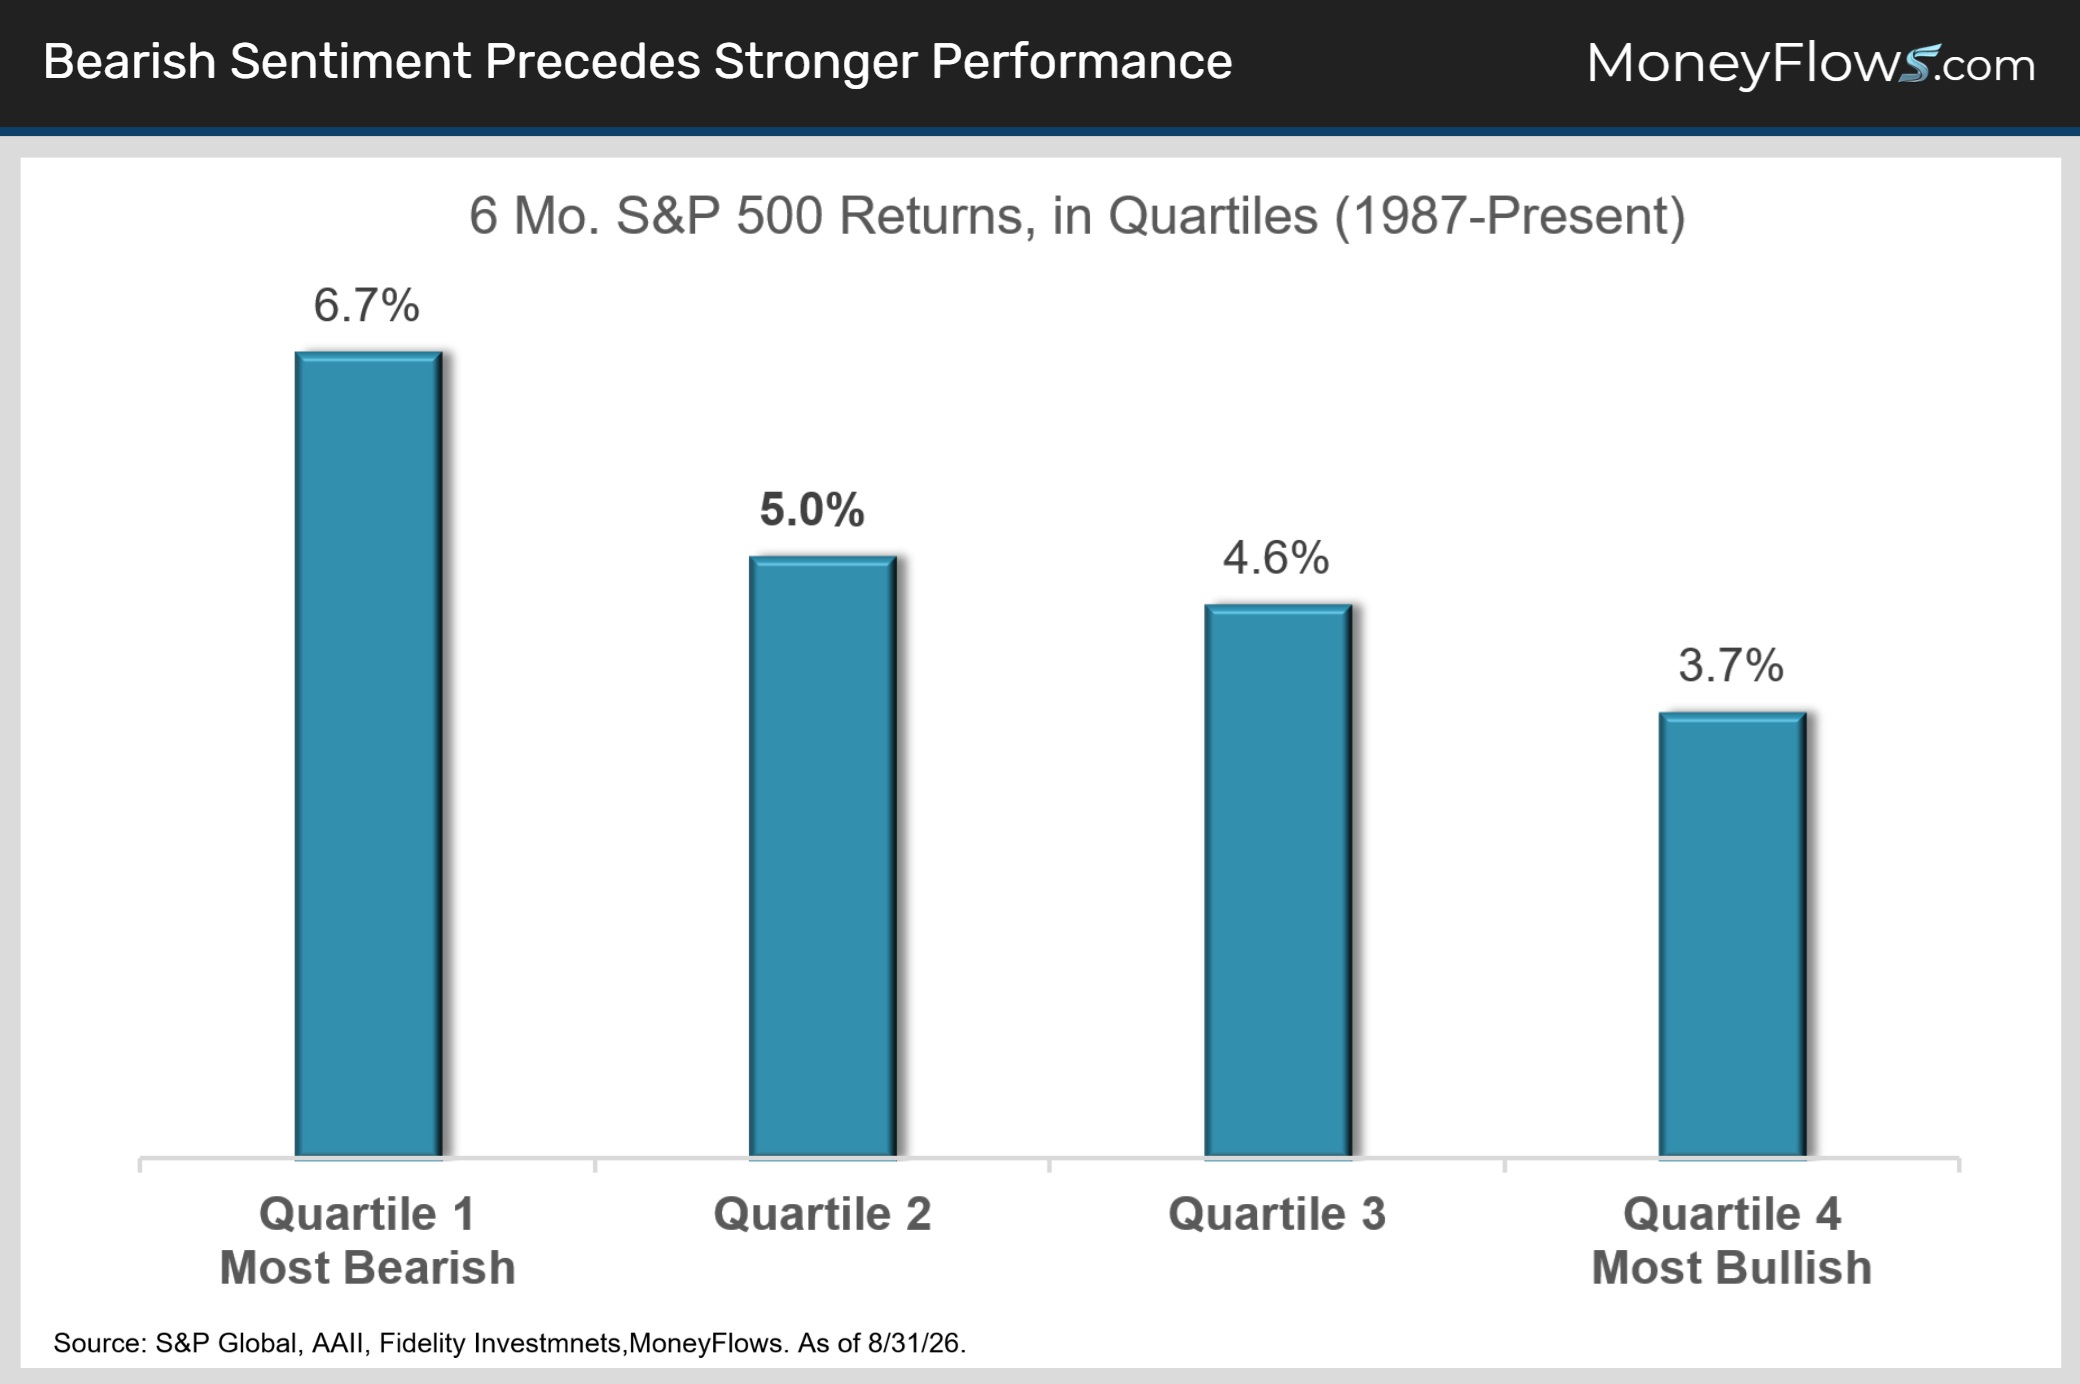
So, while headlines keep feeding the wall of worry, the data argues that climbing it remains the more probable path.
A 5% pop from here puts the S&P 500 just under 8000… a new all-time high.
Be careful getting too cautious here.
Narrow your buy list.
What This Means for Your Portfolio
Let’s tackle portfolio construction.
YTD equity market leadership has been widespread with the S&P 500 Equal Weight matching the S&P 500’s advance as energy and tech continue to outperform:
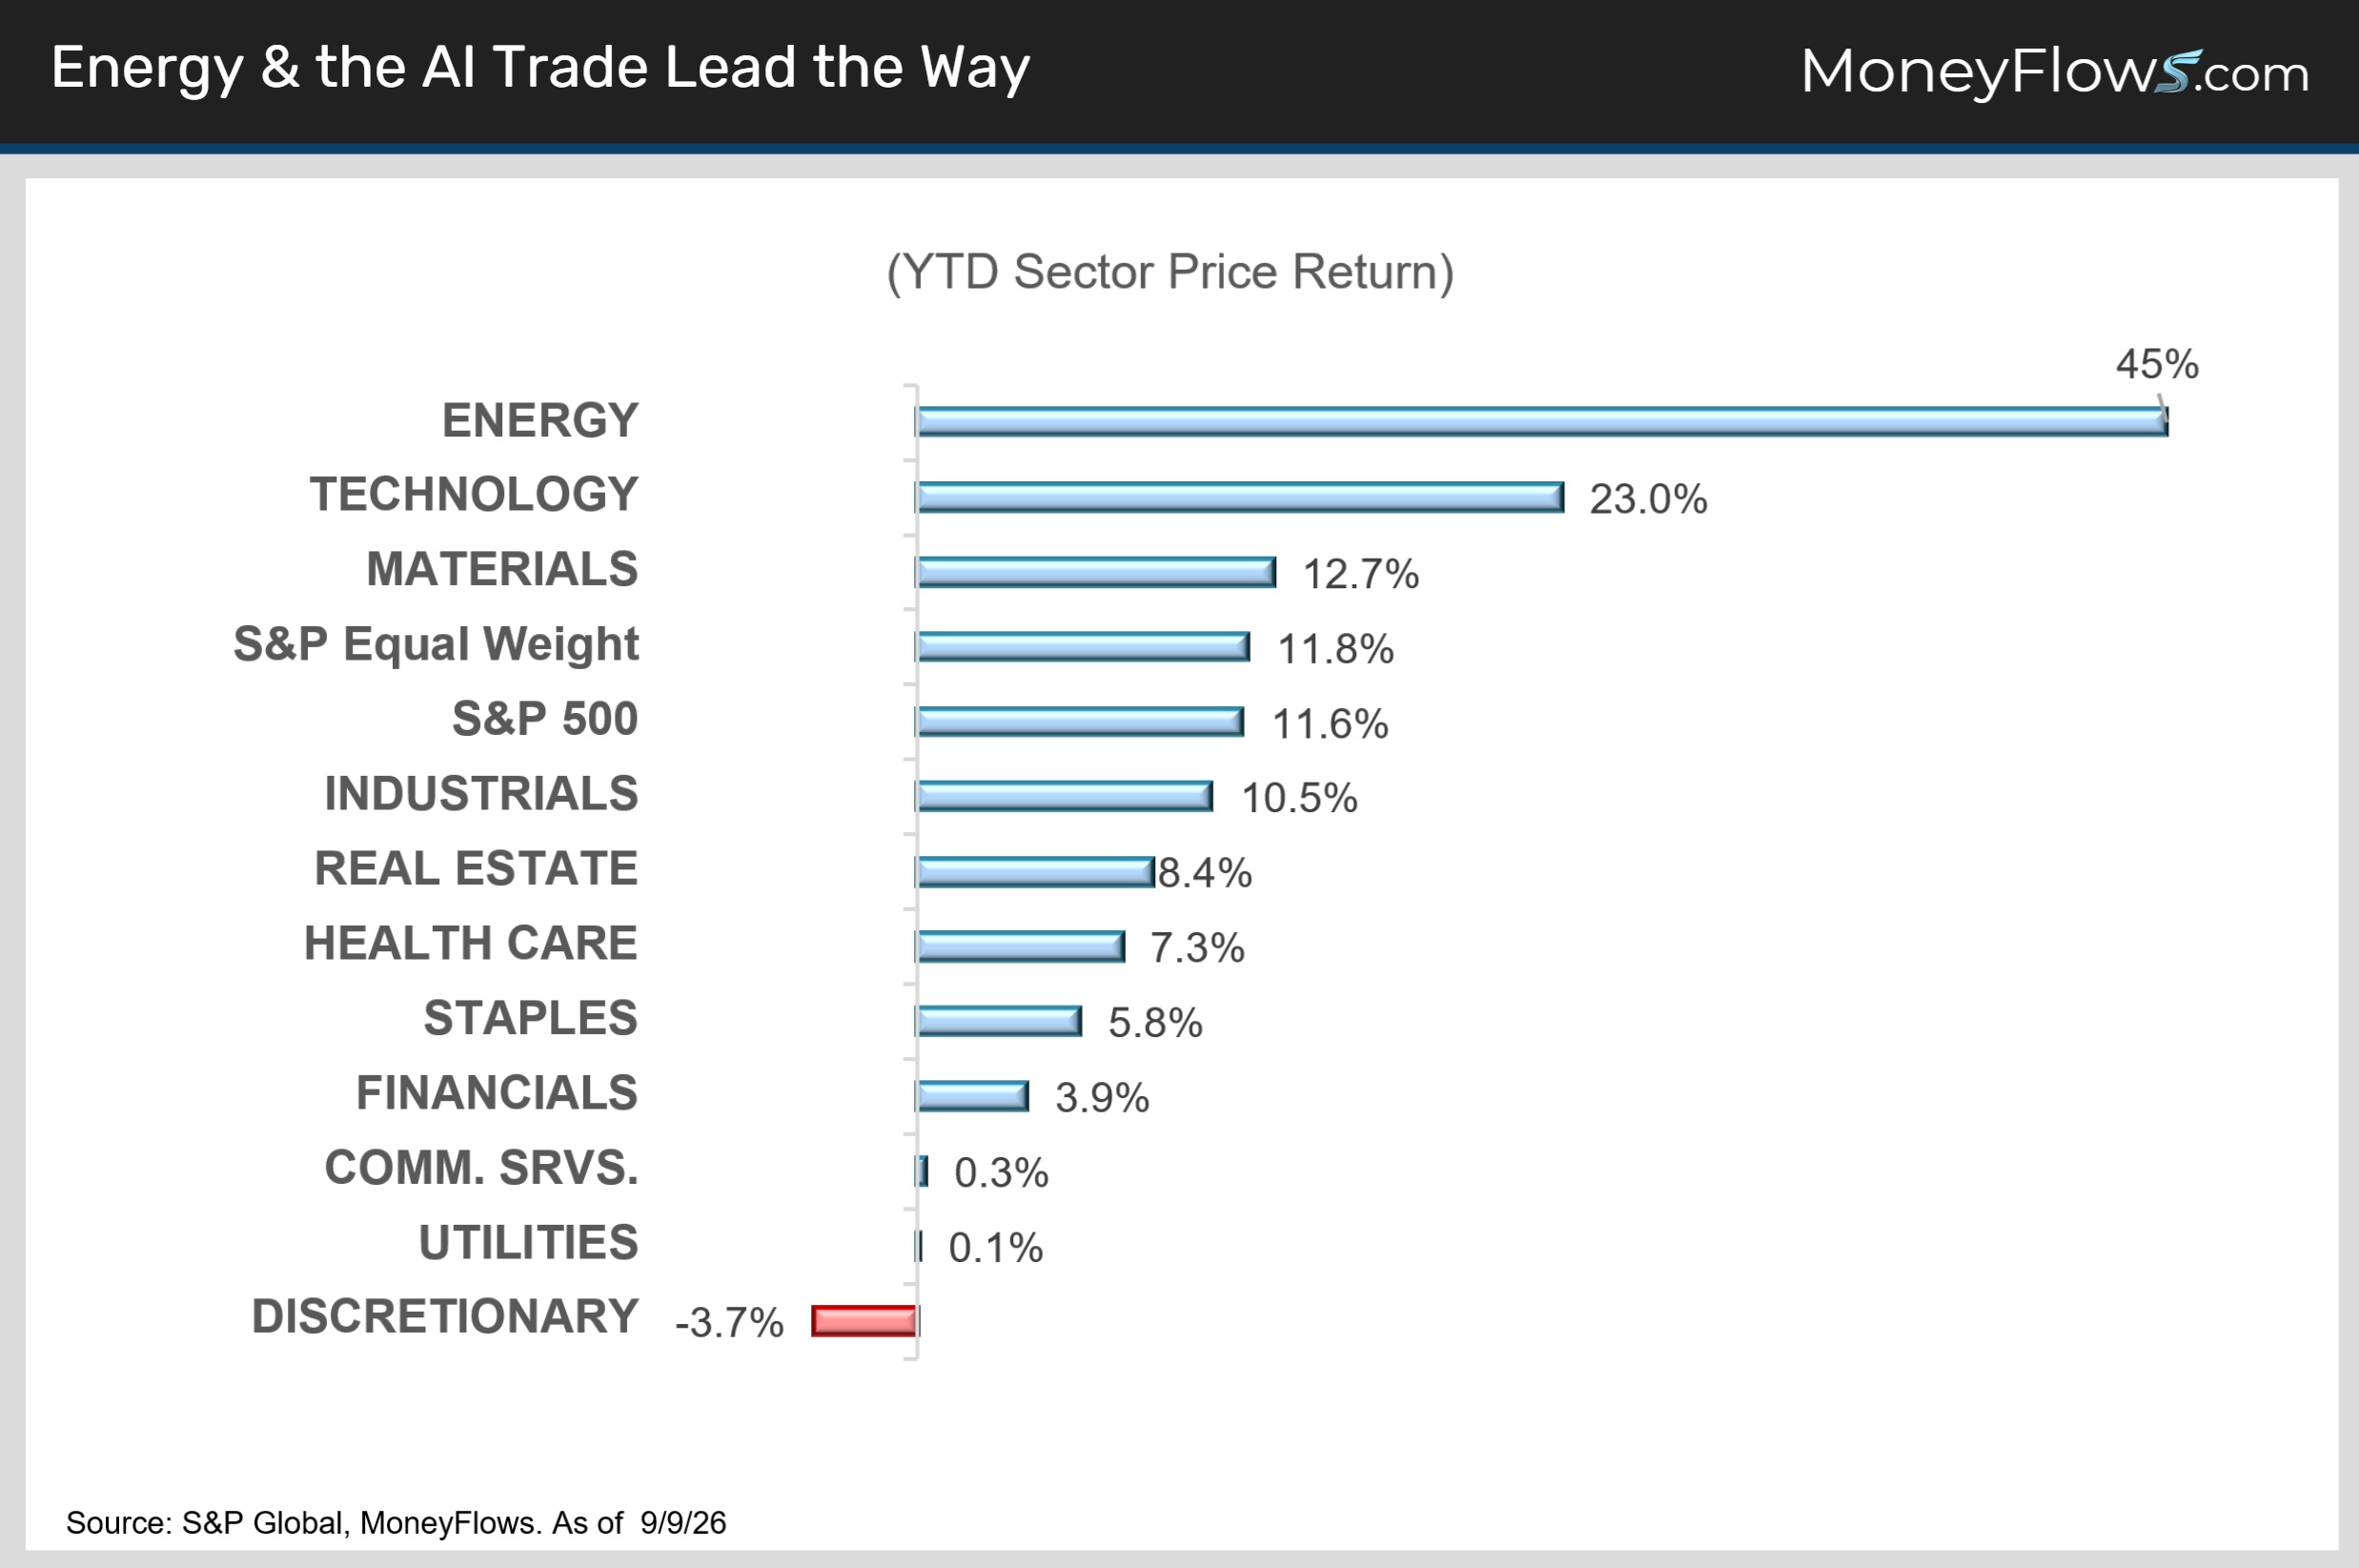
We’re seeing a similar trend in our sector inflow data with energy and tech firmly ahead in our rankings, while health care and financials are seeing healthy dip-buying:
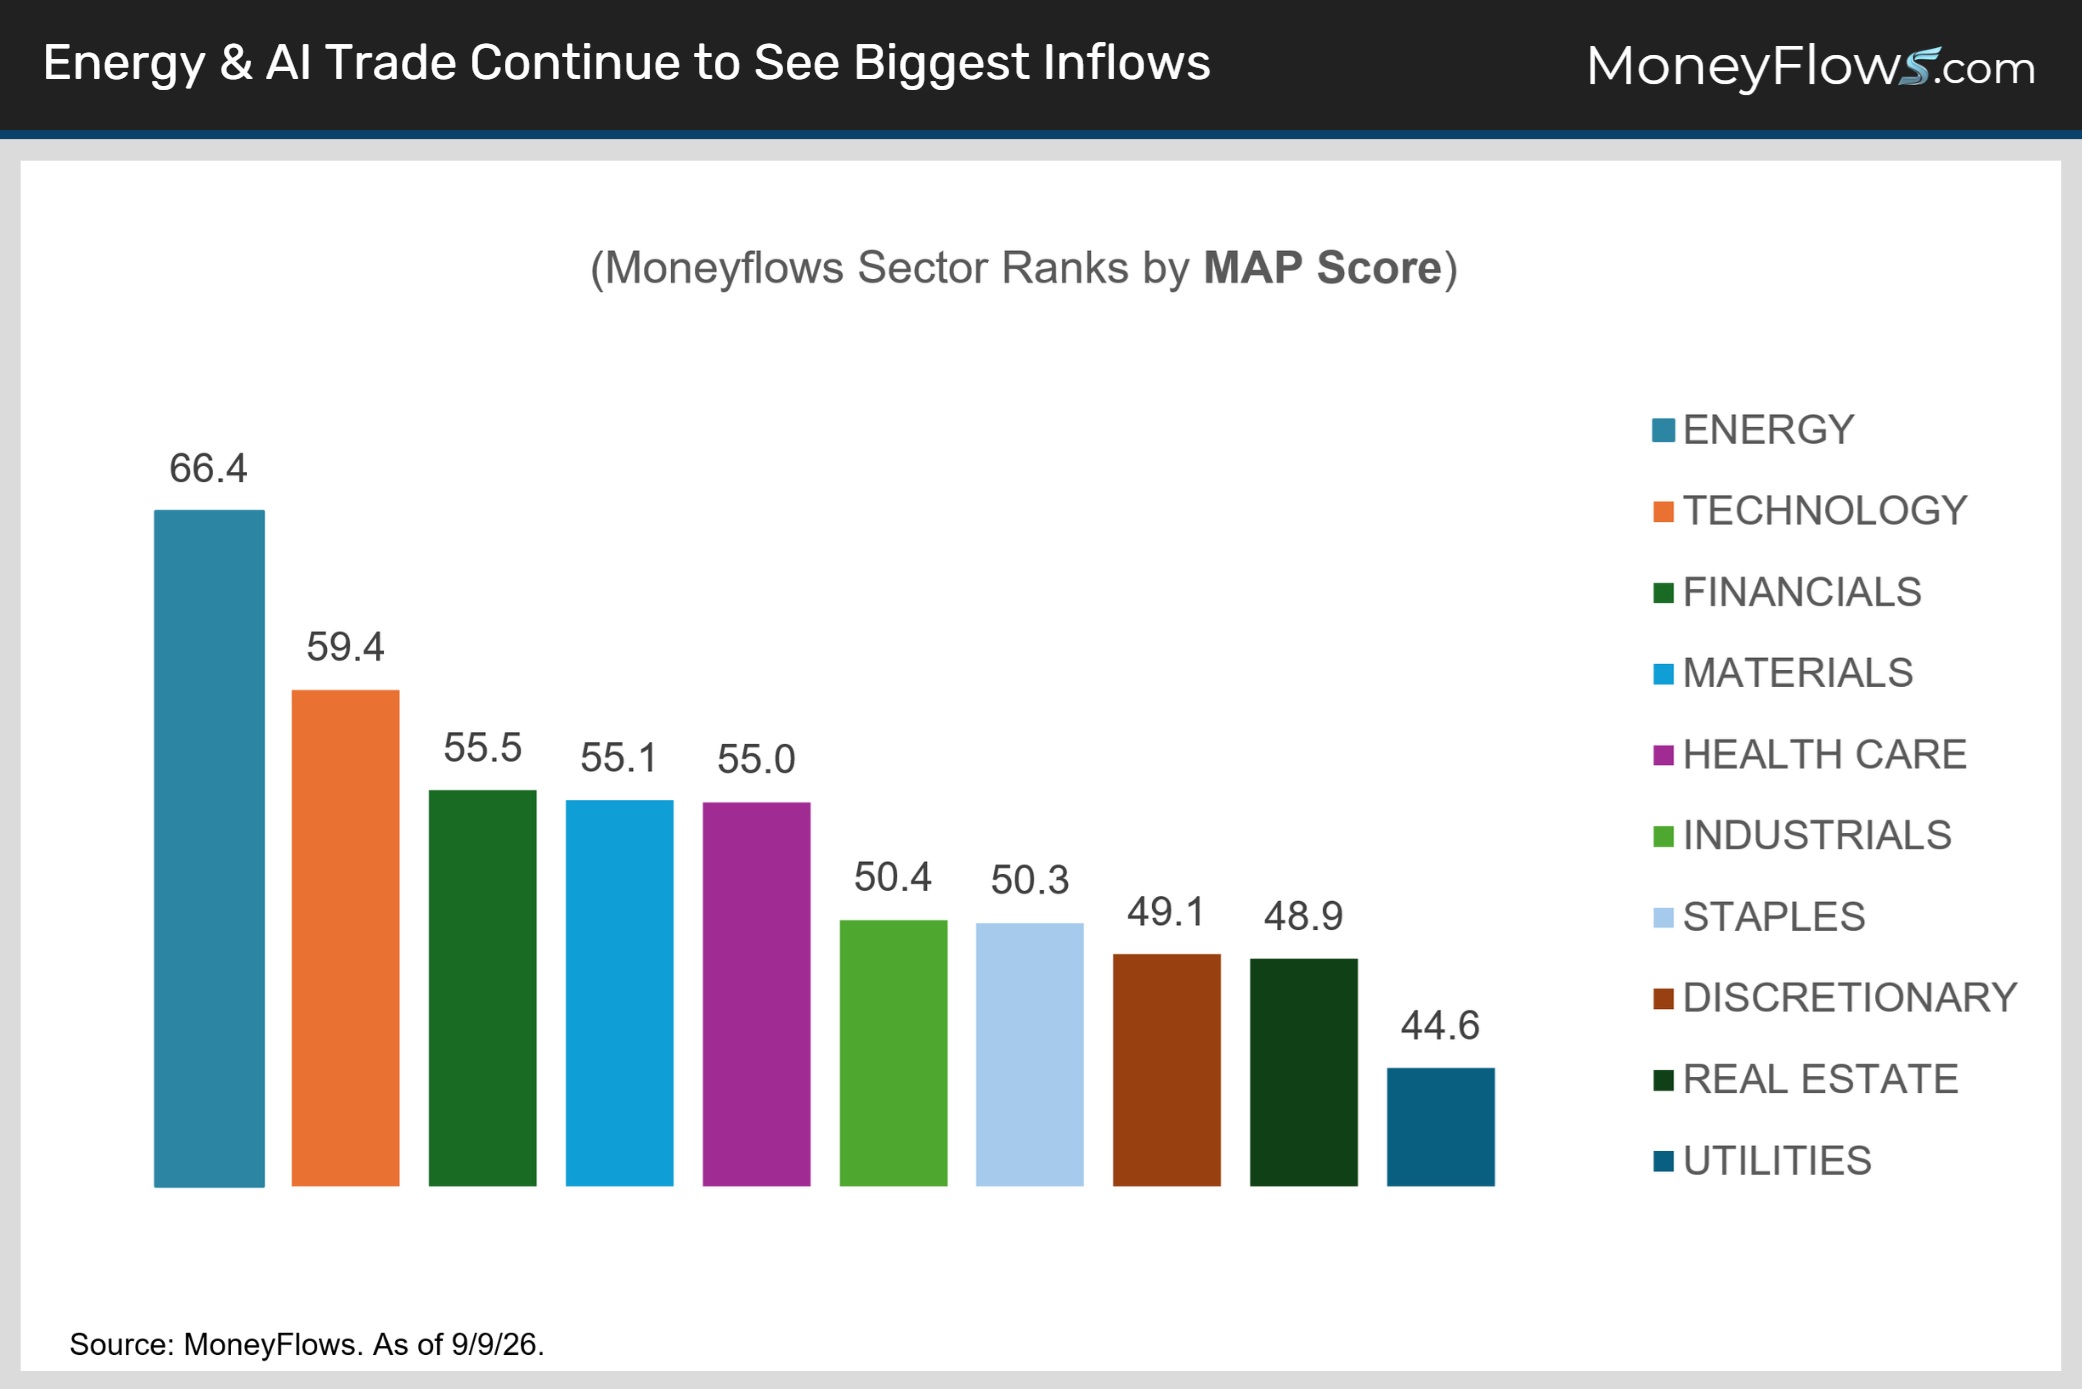
To win big, you need to drill down to individual names.
Not to worry, MoneyFlows was built to find winners.
We first showcased our MoneyFlows AI infrastructure basket of 25 outliers in semiconductors, hyper-scalers, power, optics, and networking on May 5 and the basket is up big since.
There’s still plenty of AI upside left. The same goes for leading energy, health care and financials names.
Under-the-surface of the market is a world of hidden opportunity.
To get access and make even more from this call to action, sign up for an annual PRO membership.
You’ll get our proprietary indicators and learn how our unique money flow approach finds outlier stocks early. Give it a shot!
If you’re a money manager or RIA and want portfolio solutions and deep ETF insights, reach out about our Advisor solution here.
Be early next time.
Go with the flows!
Energy, tech and health care are seeing the biggest inflows in nervous market.
Below, PRO subscribers can see they featured prominently in our latest Outlier 20 most powerful winning stocks with big money activity.