
Ultimate 2026 Midterm Election Playbook
by Alec Young All, Macro Insights, StocksElection season is in full force.
The mudslinging is well underway!
Here’s your ultimate 2026 midterm election year playbook.
The November 3 vote is right around the corner, so now’s the time to tighten up your gameplan.
We know it’s easy to get spooked by endless pre-election noise.
Political candidates tend to highlight society’s biggest problems, and their campaigns use social media to hammer home negative narratives.
Volatile pre-election price action is the norm. 2026 has had that in spades.
Defense, health insurers and AI infrastructure are prime examples of industries that have been hard hit by pre-election uncertainty.
But investors need to understand that over time, earnings growth is what really matters.
We’ll unpack a flurry of data points highlighting the Midterm Miracle and the potential for a shakeup in Congress.
Before you take a bite of the spicy media bear-bait, understand that you’re fighting against history by getting overly pessimistic right now.
Tune out the jitters and buy into any pre-vote volatility.
The evidence says a crowd-stunning rally is likely ahead.
Don’t Fade the Midterm Miracle
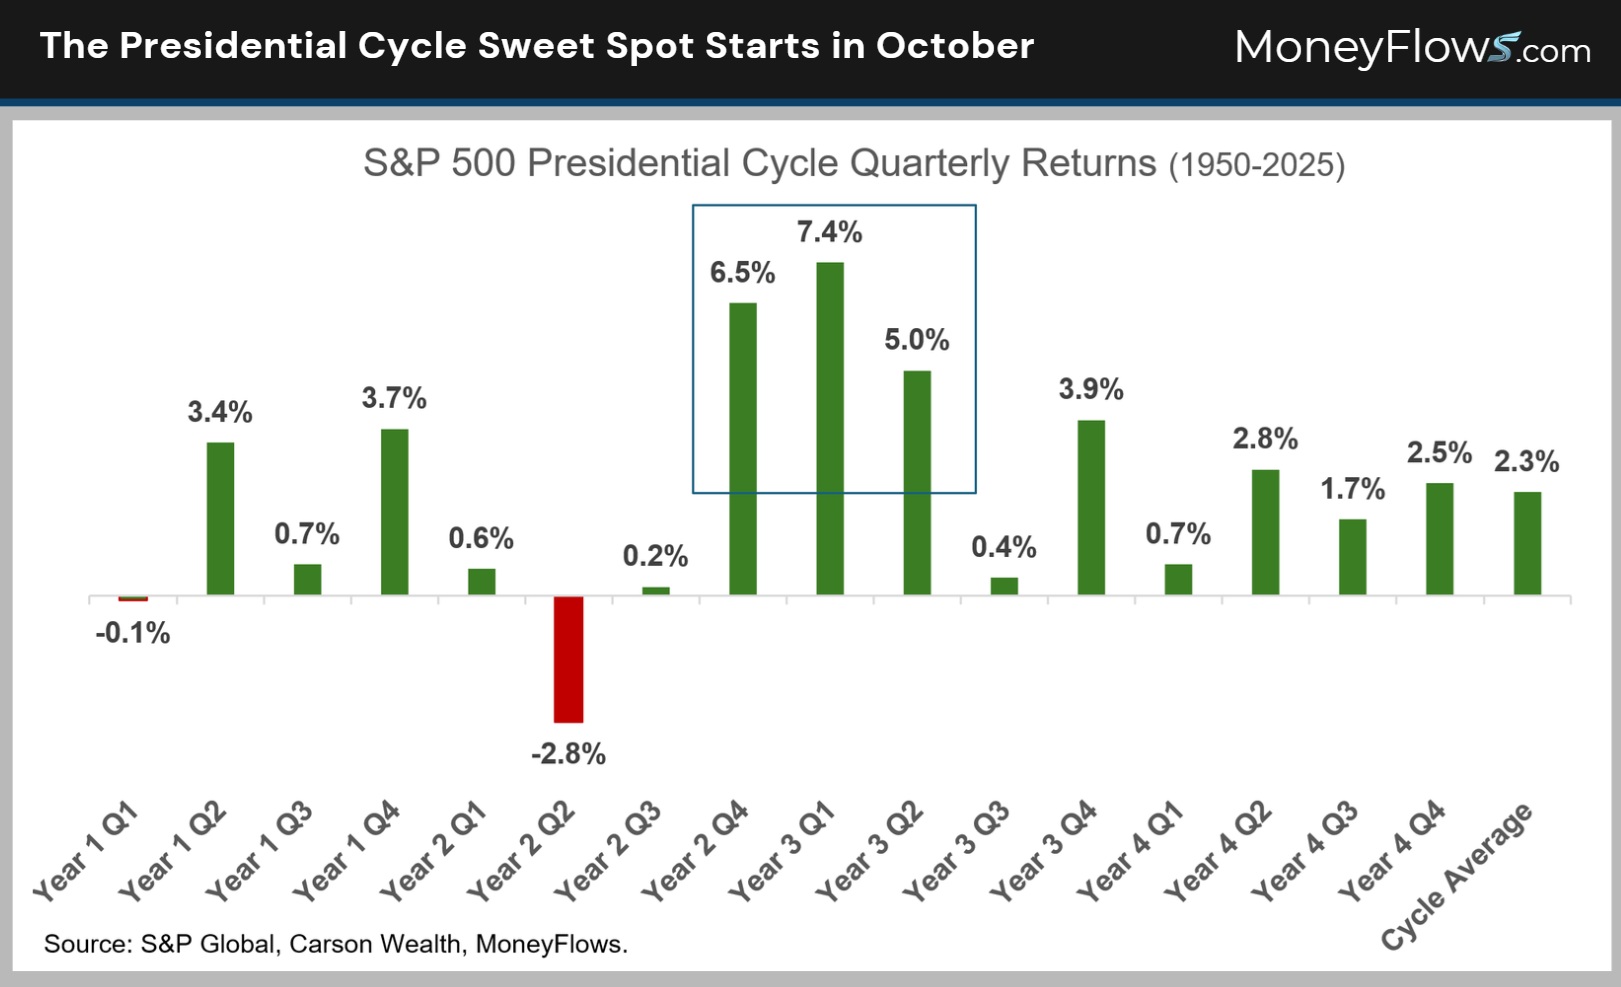
The midterm miracle refers to the fourth quarter of a midterm election year and the first two quarters of the following year – the 3rd year of a President’s term.
Historically, this is the strongest nine-month stretch for stocks in the four-year presidential cycle.
Note how these three quarters have averaged impressive 6.5%, 7.4% and 5% gains, respectively, since 1950.
This is much higher than the 2.3% average quarterly gain across the full four-year presidential cycle (chart).
Better yet, it’s got a 90% positivity rate.
They don’t call it a miracle for nothing!
Let’s drill down to the here and now with a look at monthly performance around midterms.
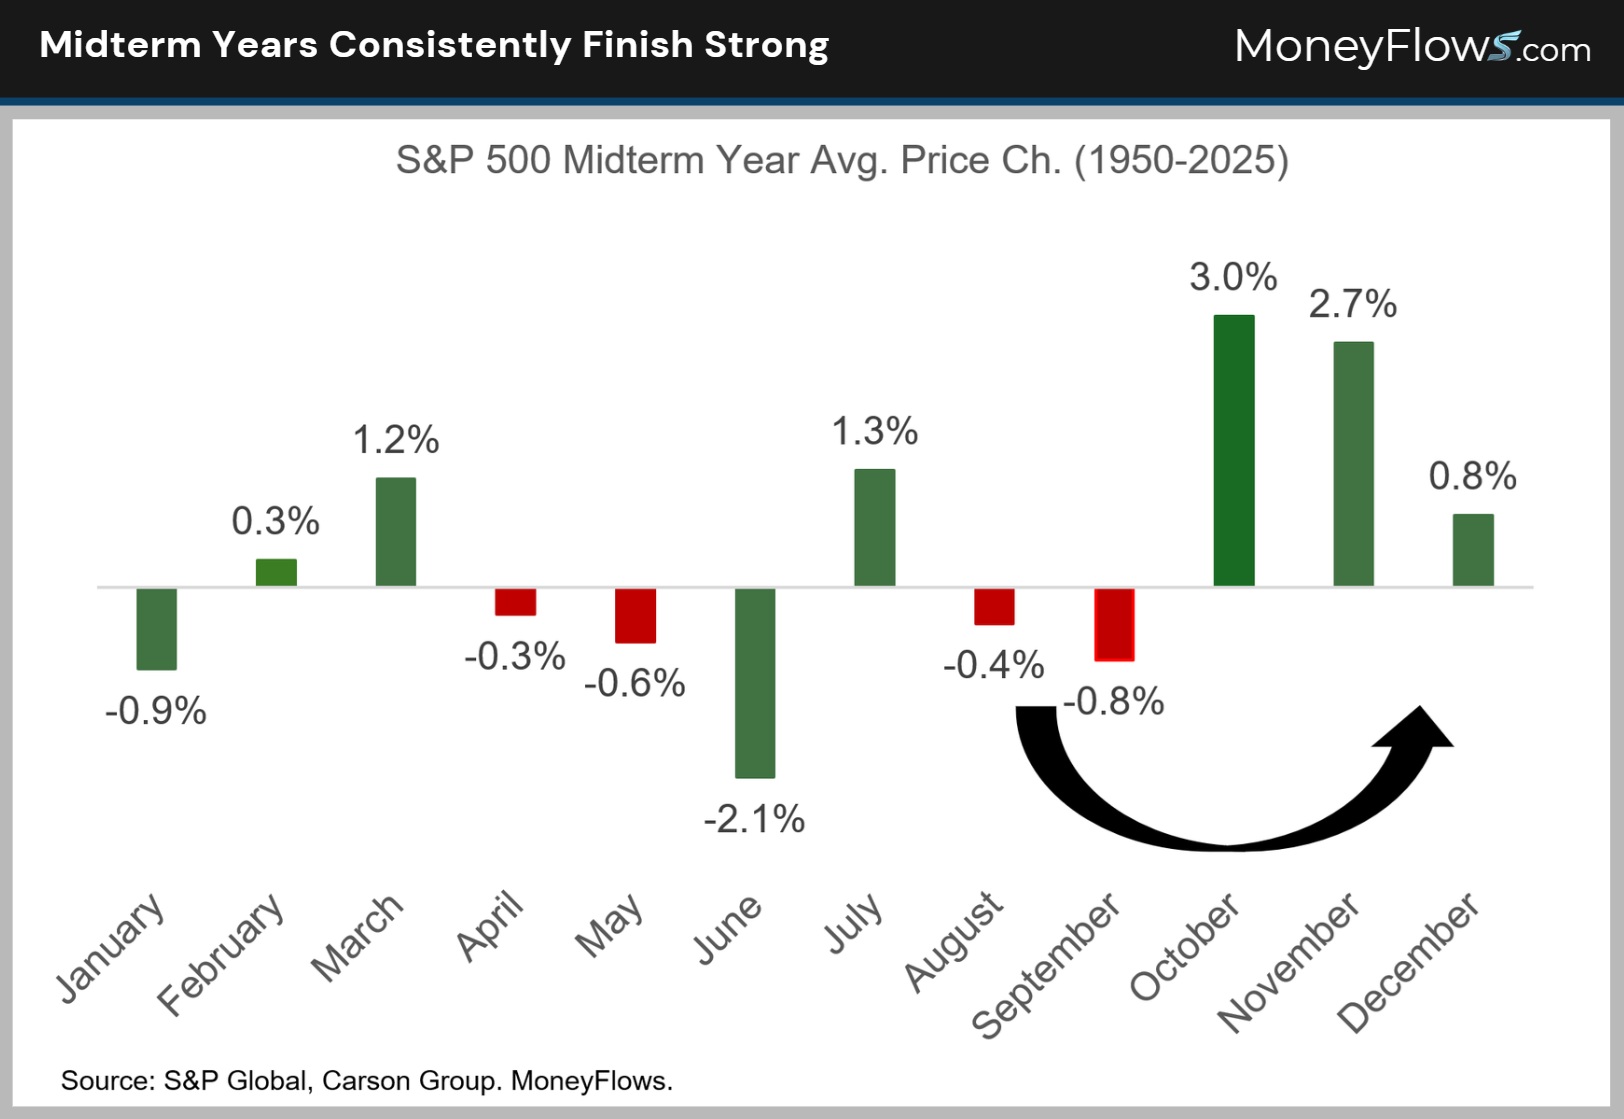
History shows many investors just can’t resist dumping stocks ahead of elections.
In all midterm election years since 1950, the S&P 500 has averaged losses of 0.4% and 0.8% in August and September, respectively (chart).
Here’s the good news. The S&P has rebounded sharply in Q4, averaging gains of 3%, 2.7% and 0.8%, respectively in October, November and December of midterm years since 1950.
October has finished higher 74% of the time with November and December seeing gains with 80% and 63% frequency, respectively.
Here’s the bottom line: it’s a safe bet that any pre-election selling gives way to big buying once electoral uncertainty passes.
In midterm years, Congress is up for grabs.
Let’s see which political mix works best for stocks.
Stocks Do Best with a Split Congress
The clearest trend when analyzing markets under various political scenarios is that equities do best when Congress is split with different parties controlling the House of Representatives and the Senate.
Why?
Because investors don’t like uncertainty. Shared political power forces incrementalism, making big policy and legislative surprises less likely.
Congress is up for grabs, but President Trump isn’t going anywhere.
Under a Republican president, stocks have historically averaged 13.7% each year with a split Congress vs. only 8.3% when the GOP controls the hill and a woeful 4.9% when Democrats have run Congress:
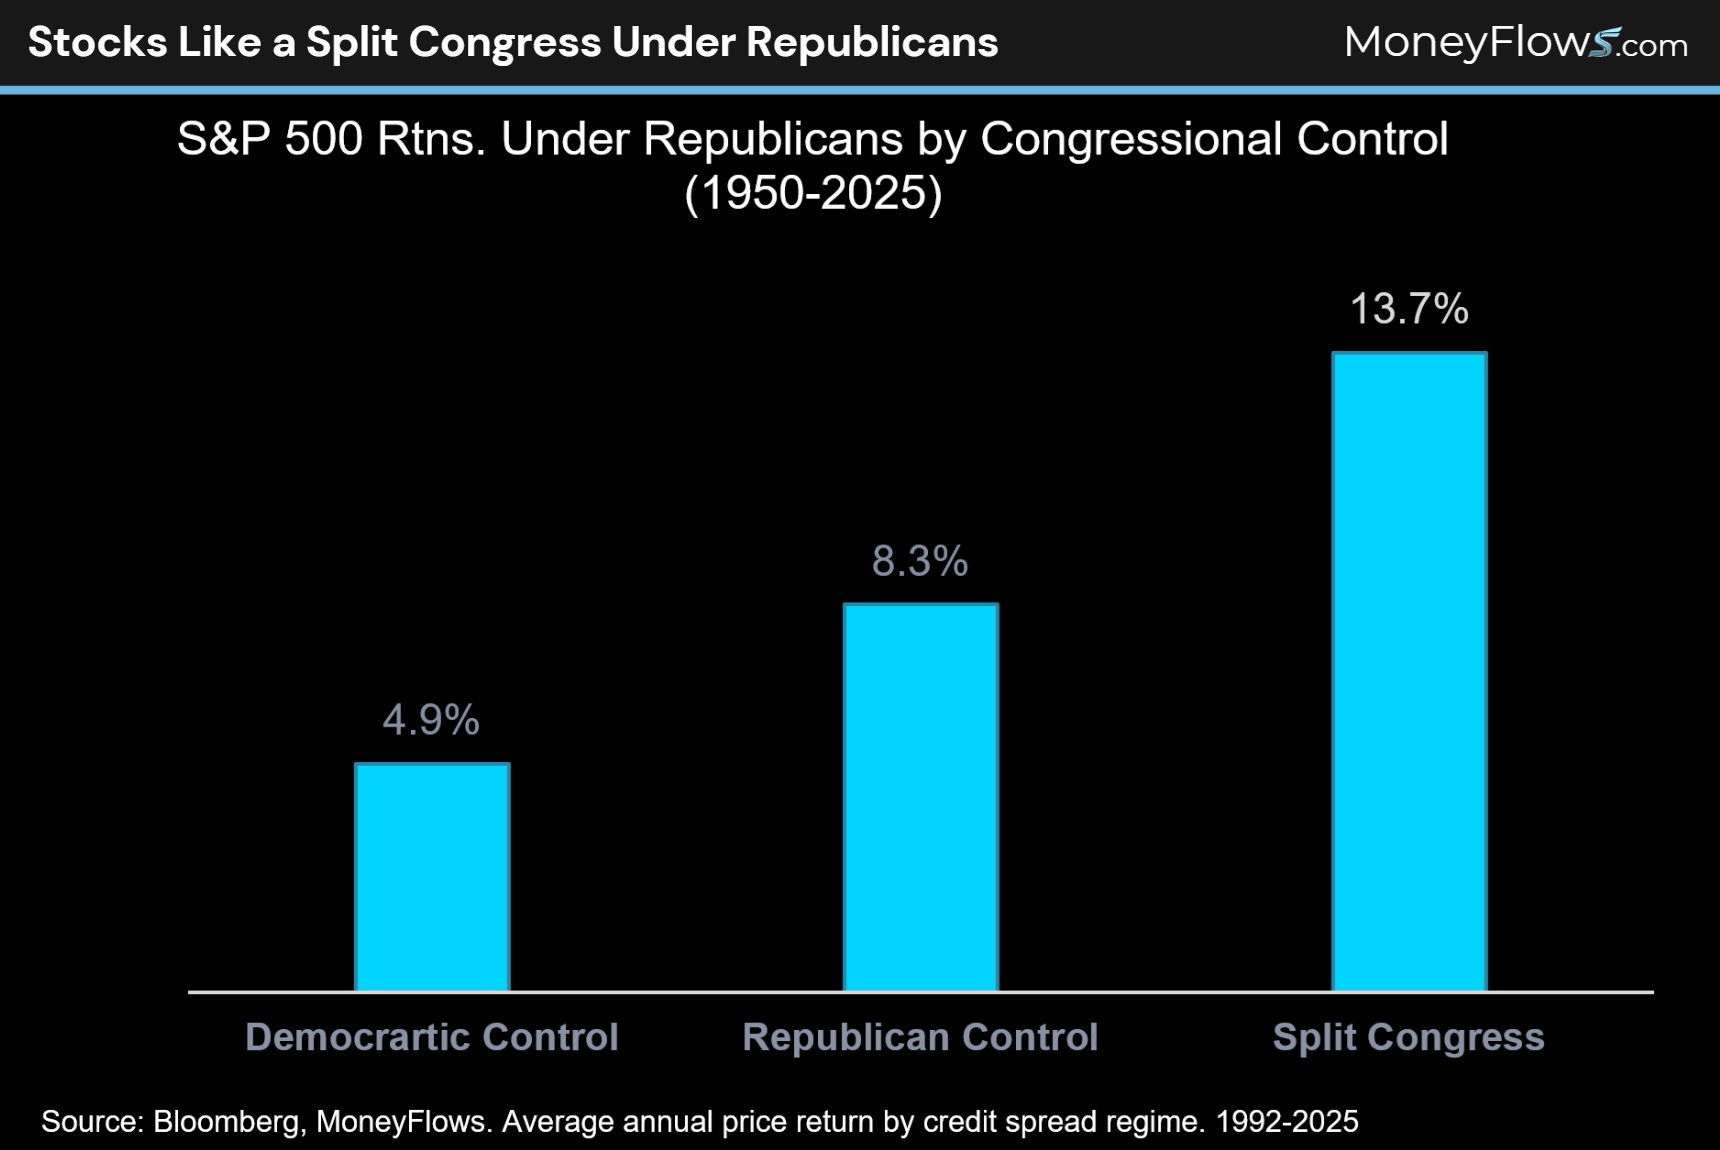
The data is clear: investors should hope for split control of Congress in 2027 and 2028.
Ultimate 2026 Midterm Election Playbook
Let’s keep the midterm playbook going with a look at portfolio construction.
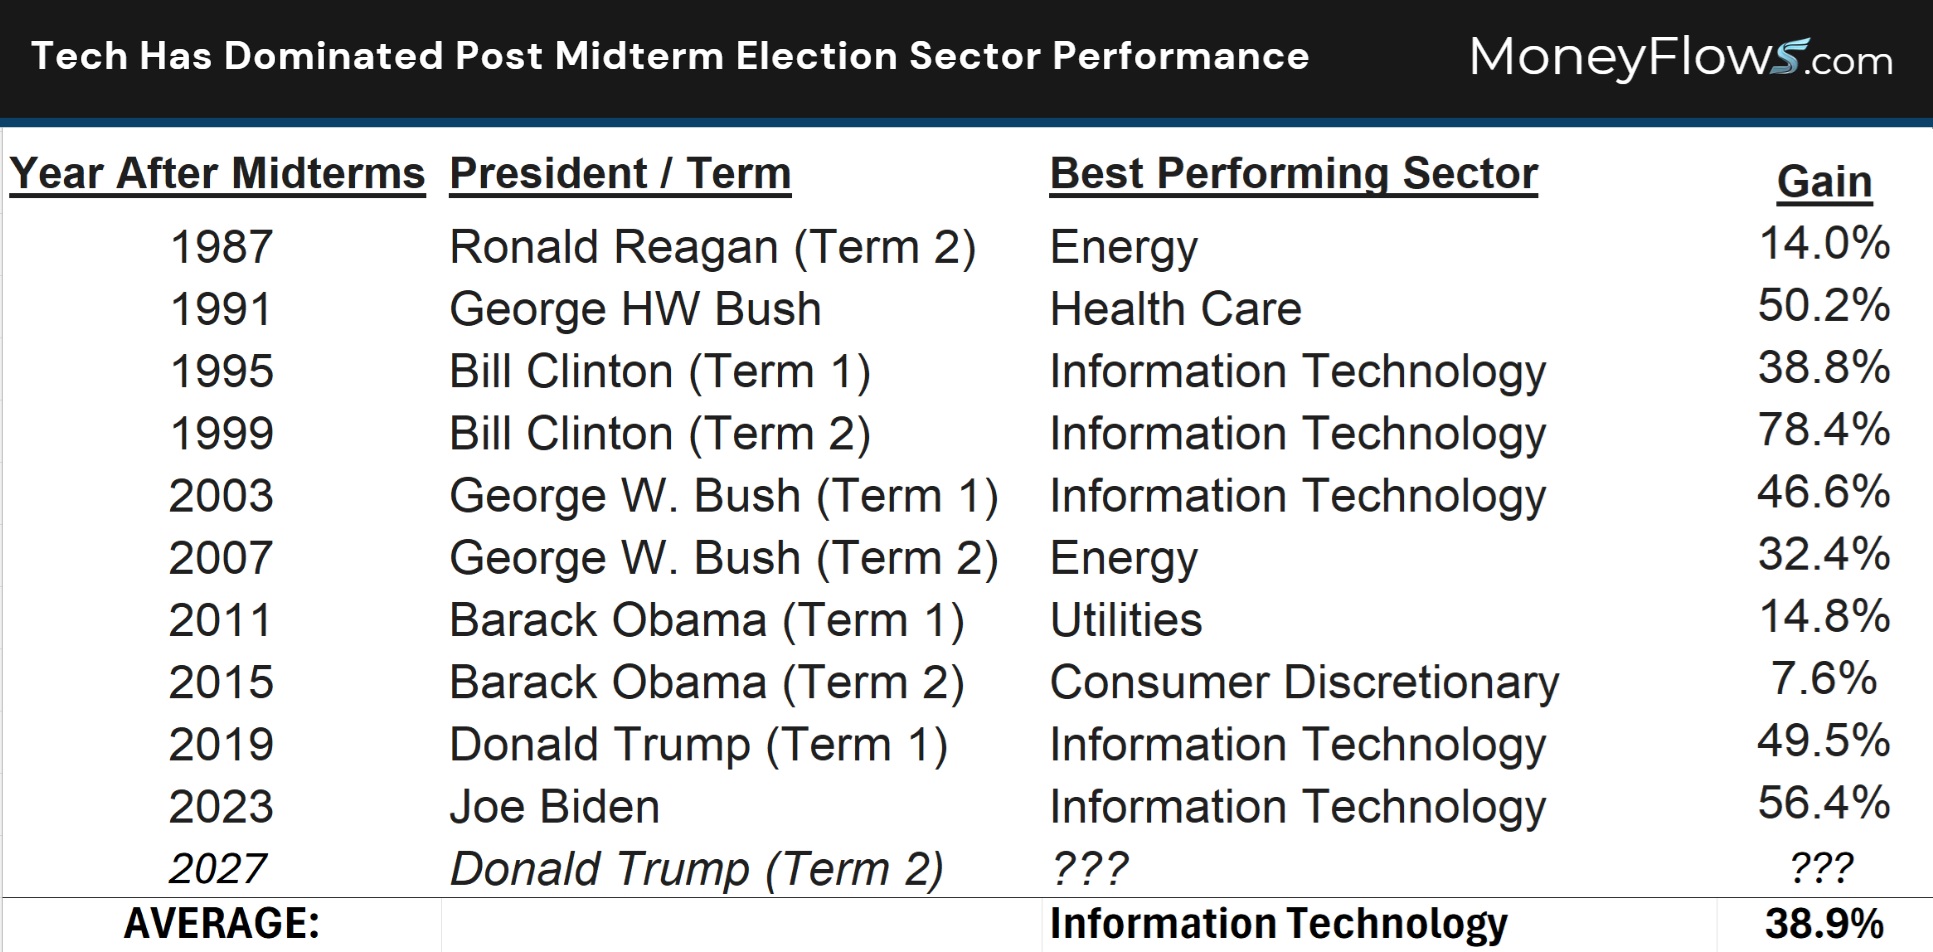
We analyzed sector performance after midterm elections going back to 1987.
Our study focused on the third year of the presidential term. This is historically the strongest year of the four-year presidential cycle with average returns of 13.6% dating back to 1926.
Since markets tend to do best during third years, it’s no surprise the top sector averaged 39% gains.
Technology was by far the best performing sector most of the time. It led the way in five of the 10 years we analyzed.
When markets were more volatile, energy, healthcare, and utilities topped the list:
Here’s the best part. Right now, you’re getting a chance to pick up best of breed tech outliers on sale.
Election uncertainty and AI slowdown fears are driving tech profit taking and a rotation into lagging sectors like staples, discretionary, utilities, real estate and health care.
Low-volatility stocks are significantly outperforming high beta in October:
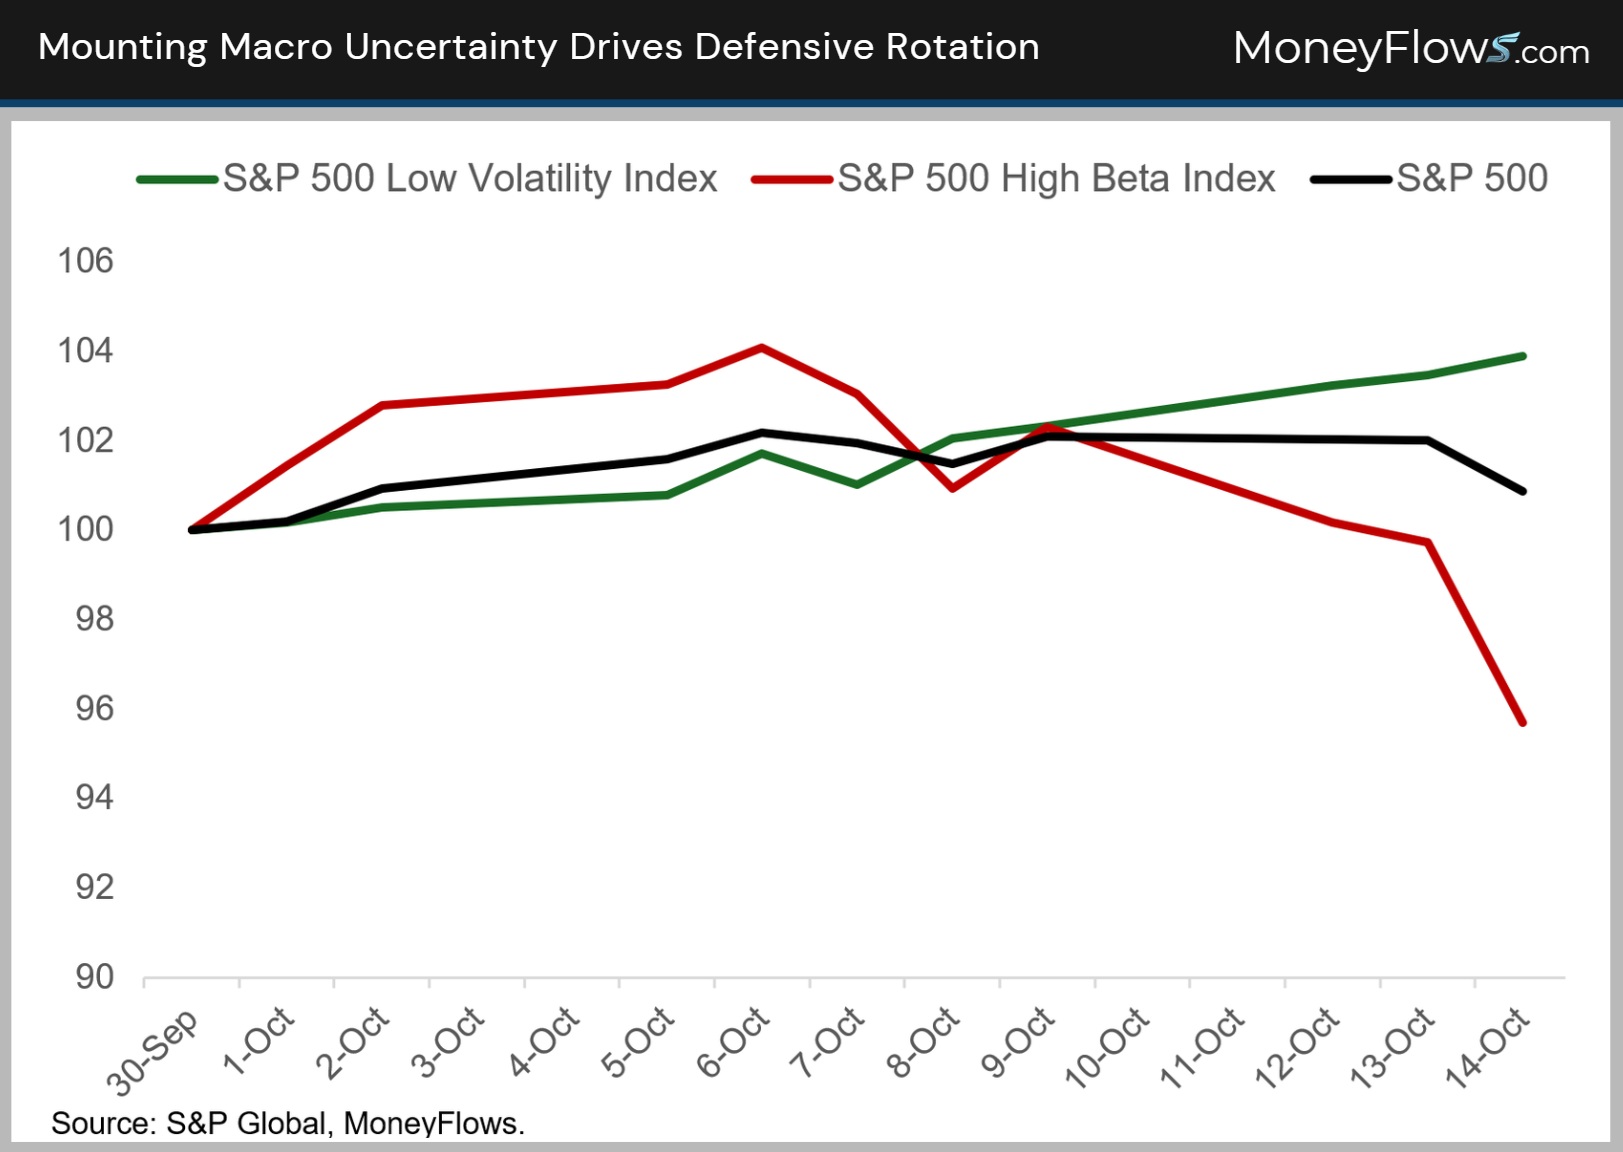
This defensive positioning can flip on a dime…especially given that our Big Money Index (BMI) recently clocked oversold.
Once our North Star starts heading higher, odds are that prior winners will jump hard and fast.
To win big, you need to drill down to individual names.
Not to worry, MoneyFlows was built to find winners.
Today’s stock list is primarily long growthy technology outliers.
Under-the-surface of the market is a world of hidden opportunity.
To get access and make even more from this call to action, sign up for a PRO (Annual) membership.
You’ll get our proprietary indicators and learn how our unique money flow approach finds outlier stocks early. Give it a shot!
If you’re a money manager or RIA and want portfolio solutions and deep ETF insights, reach out about our Advisor solution here.
Be early next time.
Go with the flows!
Below, PRO subscribers can see that tech outliers are seeing the biggest inflows even in a volatile market. That’s a bullish signal.
They dominate our latest Outlier 20 most powerful winning stocks with Big Money activity.