
Market Thaw: 3 Signals a Stock Rally Is Near
by Jason Bodner All, Big Money Insights Weekly, StocksFrozen, Not Dead
Each fall in Alaska, the wood frog lets itself freeze. Up to 60% of its body turns to ice and its heart stops. Pretty much dead, it can stay that way for seven months. But first it goes through 10 to 15 freeze-and-thaw cycles. Each one builds up glucose that works like antifreeze. Come spring, its heart starts again.
The market has been playing frozen frog all summer.
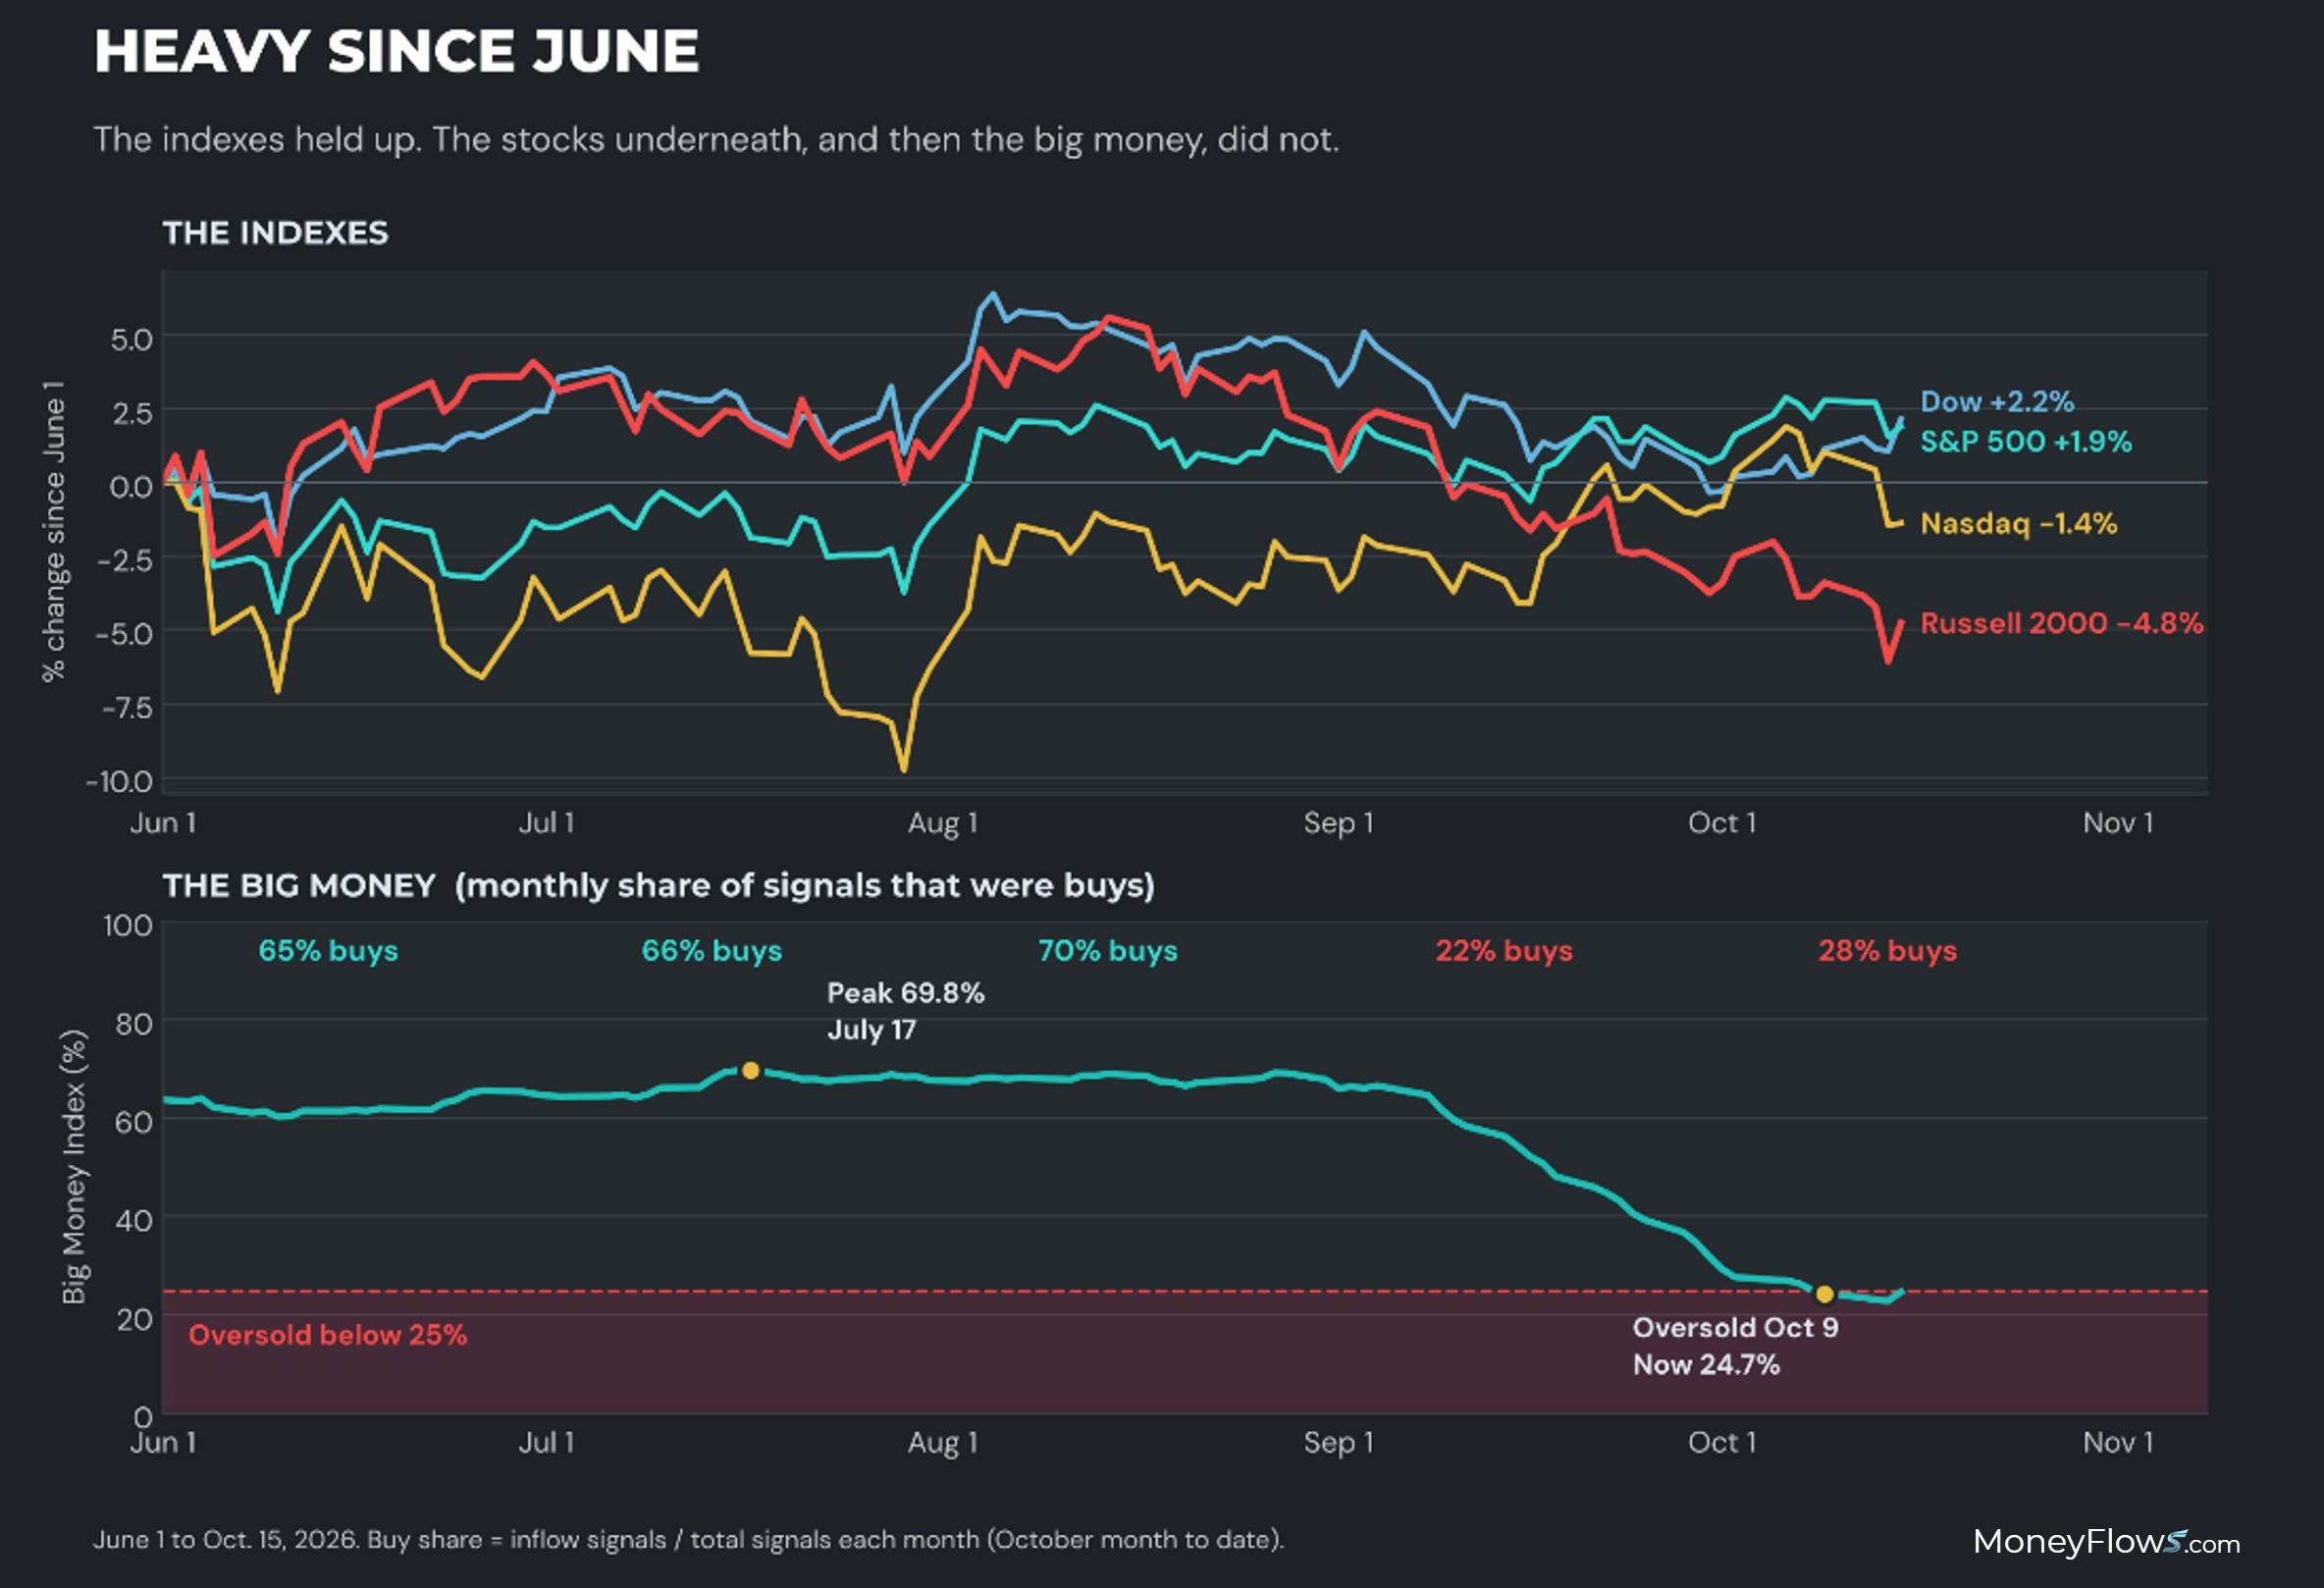
Since June 1, the S&P 500 is up 1.9%, sitting within 1% of its Oct. 6 record. The Dow Jones Industrial Average is up 2.2%.
However, underneath everything, it’s been frozen. The Russell 2000 is down 4.8% since June 1. Of the roughly 5,300 stocks we track, 56% of them haven’t made a new 52-week high since July 1. And 50.8% are in a bear market, down 20% or more from their highs.
Even this year’s leaders cracked. The big chip and AI hardware names peaked in late June and have since fallen 23% to 42%. Now 90% of chip equipment stocks are in a bear market, even though the group is still up a median 65% this year.
The flows add a twist. Big Money kept buying all summer. In June, July, and August, inflows made up 65% to 70% of our unusual activity signals. Then September hit. Inflows fell to just 22% of signals, the worst month of the year, worse even than March.
So, stocks have been heavy since June. In September, Big Money pulled the handbrake.
Two things are controlling that handbrake. The first is interest rates. Wednesday’s consumer price index report came in hot. Thursday showed producer prices rose 6.3% from a year ago. The 10-year Treasury yield hit about 5.19% before easing to 5.085%. Traders now see a rate hike from the Federal Reserve as close to a coin flip.
Higher rates squeeze borrowers. Margin debt hit a record $1.5 trillion in June, then fell $84.8 billion in July, the biggest monthly dollar drop on record, as hedge fund Situational Awareness faced margin calls. August bounced 2.6% to $1.45 trillion. Borrowed money sells early to avoid margin calls.
Among stocks over $2 billion in market capitalization, the most indebted fifth fell a median 2.9% last month while the least indebted rose 0.5%. Companies expected to post negative Earnings Before Interest, Taxes, Depreciation and Amortization (EBITDA) fell 12.3%. On Wednesday, high-yield, preferred, and convertible bond exchange-traded funds were dumped.
Thursday showed what deleveraging looks like. AI hardware and memory stocks slid while the Dow rose 1.1% and the Russell 2000 jumped 1.4%. This year’s worst stocks rose a median 2.8%. The year’s best stocks were flat. The most-shorted stocks gained 2.3%. Funds were selling their winners to cut risk, and short sellers were covering their losers.
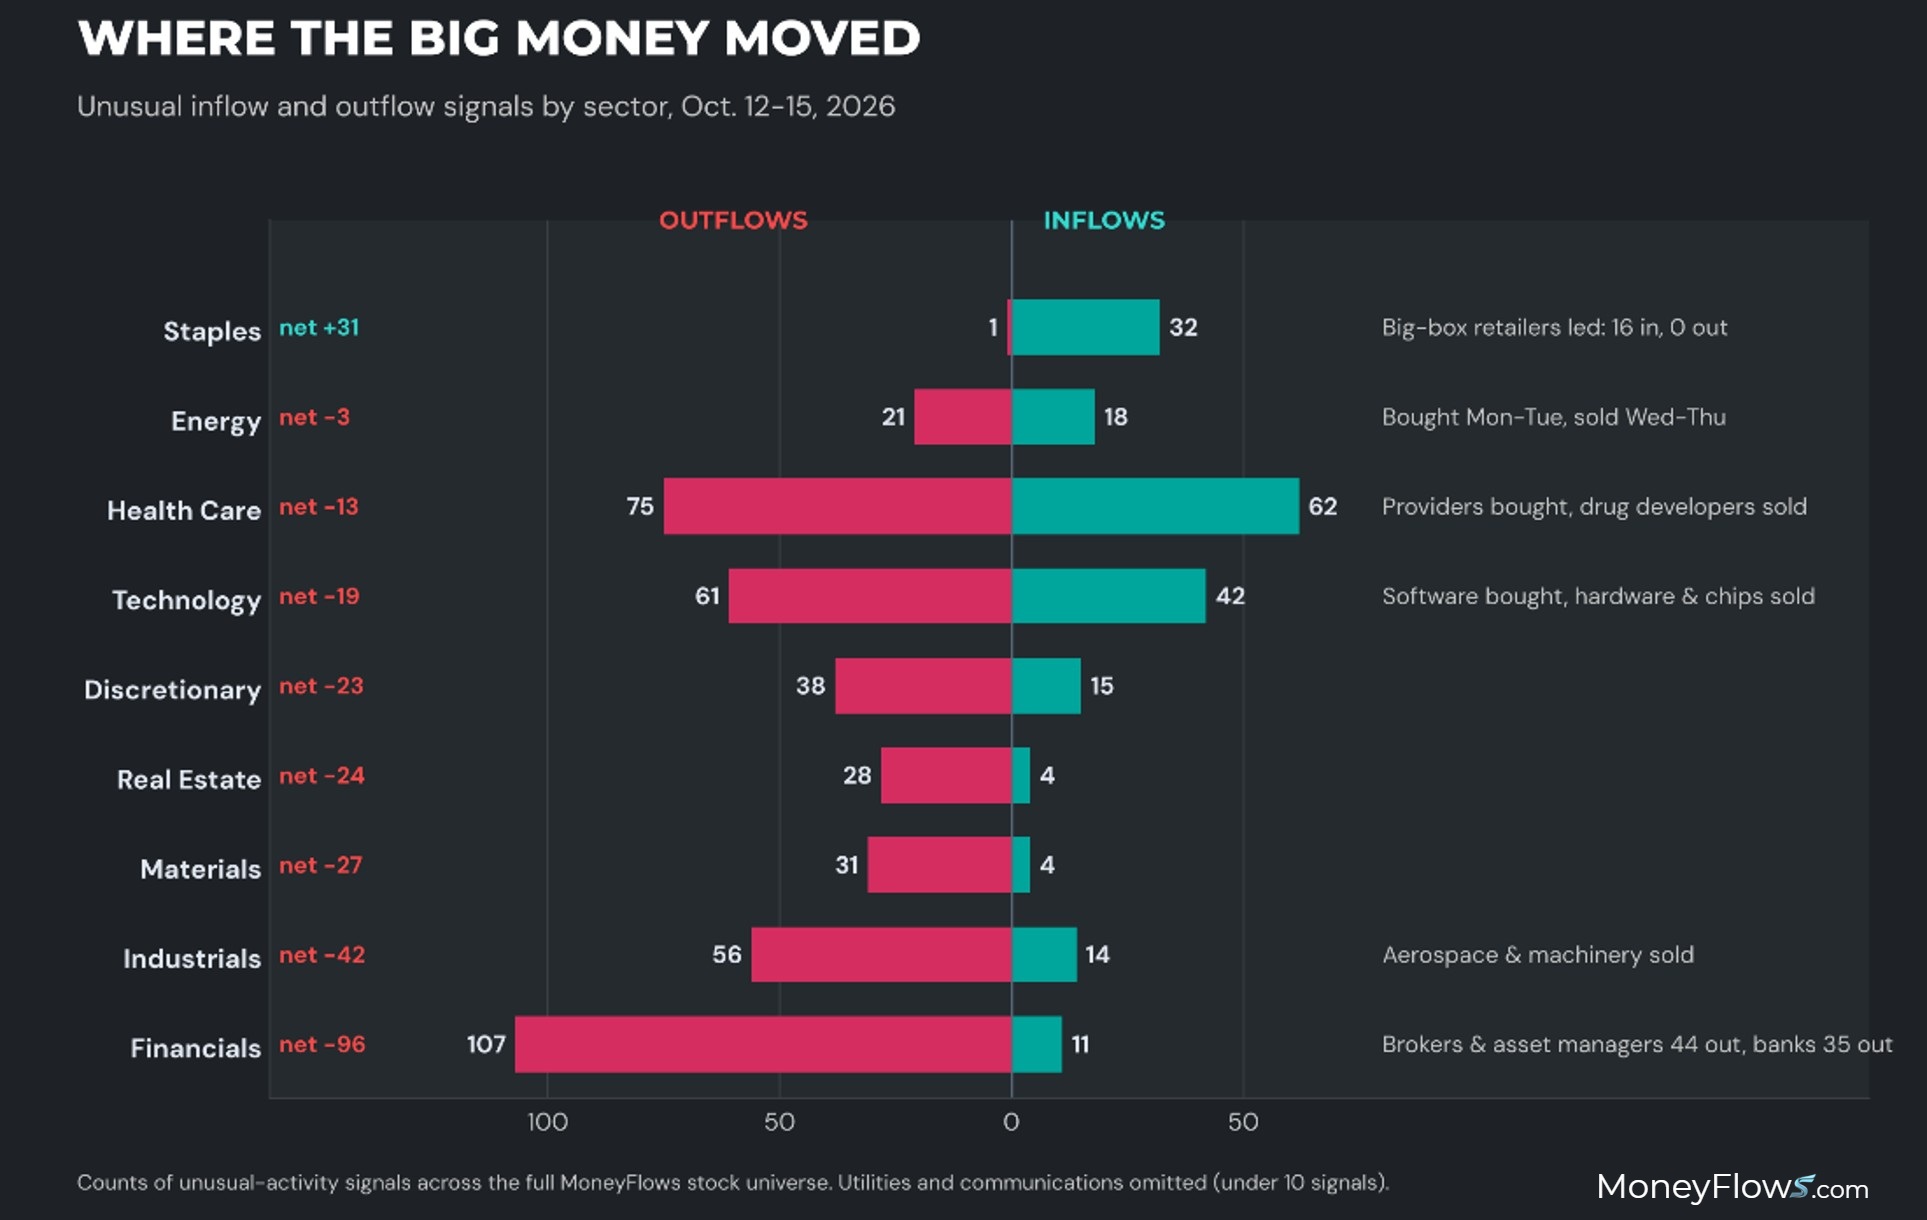
The sectors fill in the rest. From Oct. 12-15, consumer staples was the biggest net buy, with 32 inflows and one outflow, led by big-box retailers. Health care split down the middle. Providers and services drew 19 inflows and no outflows, while drug developers took 47 outflows. Financials took the worst of it, 107 outflows against 11 inflows, as brokers, asset managers, and banks sold off on mixed bank earnings.
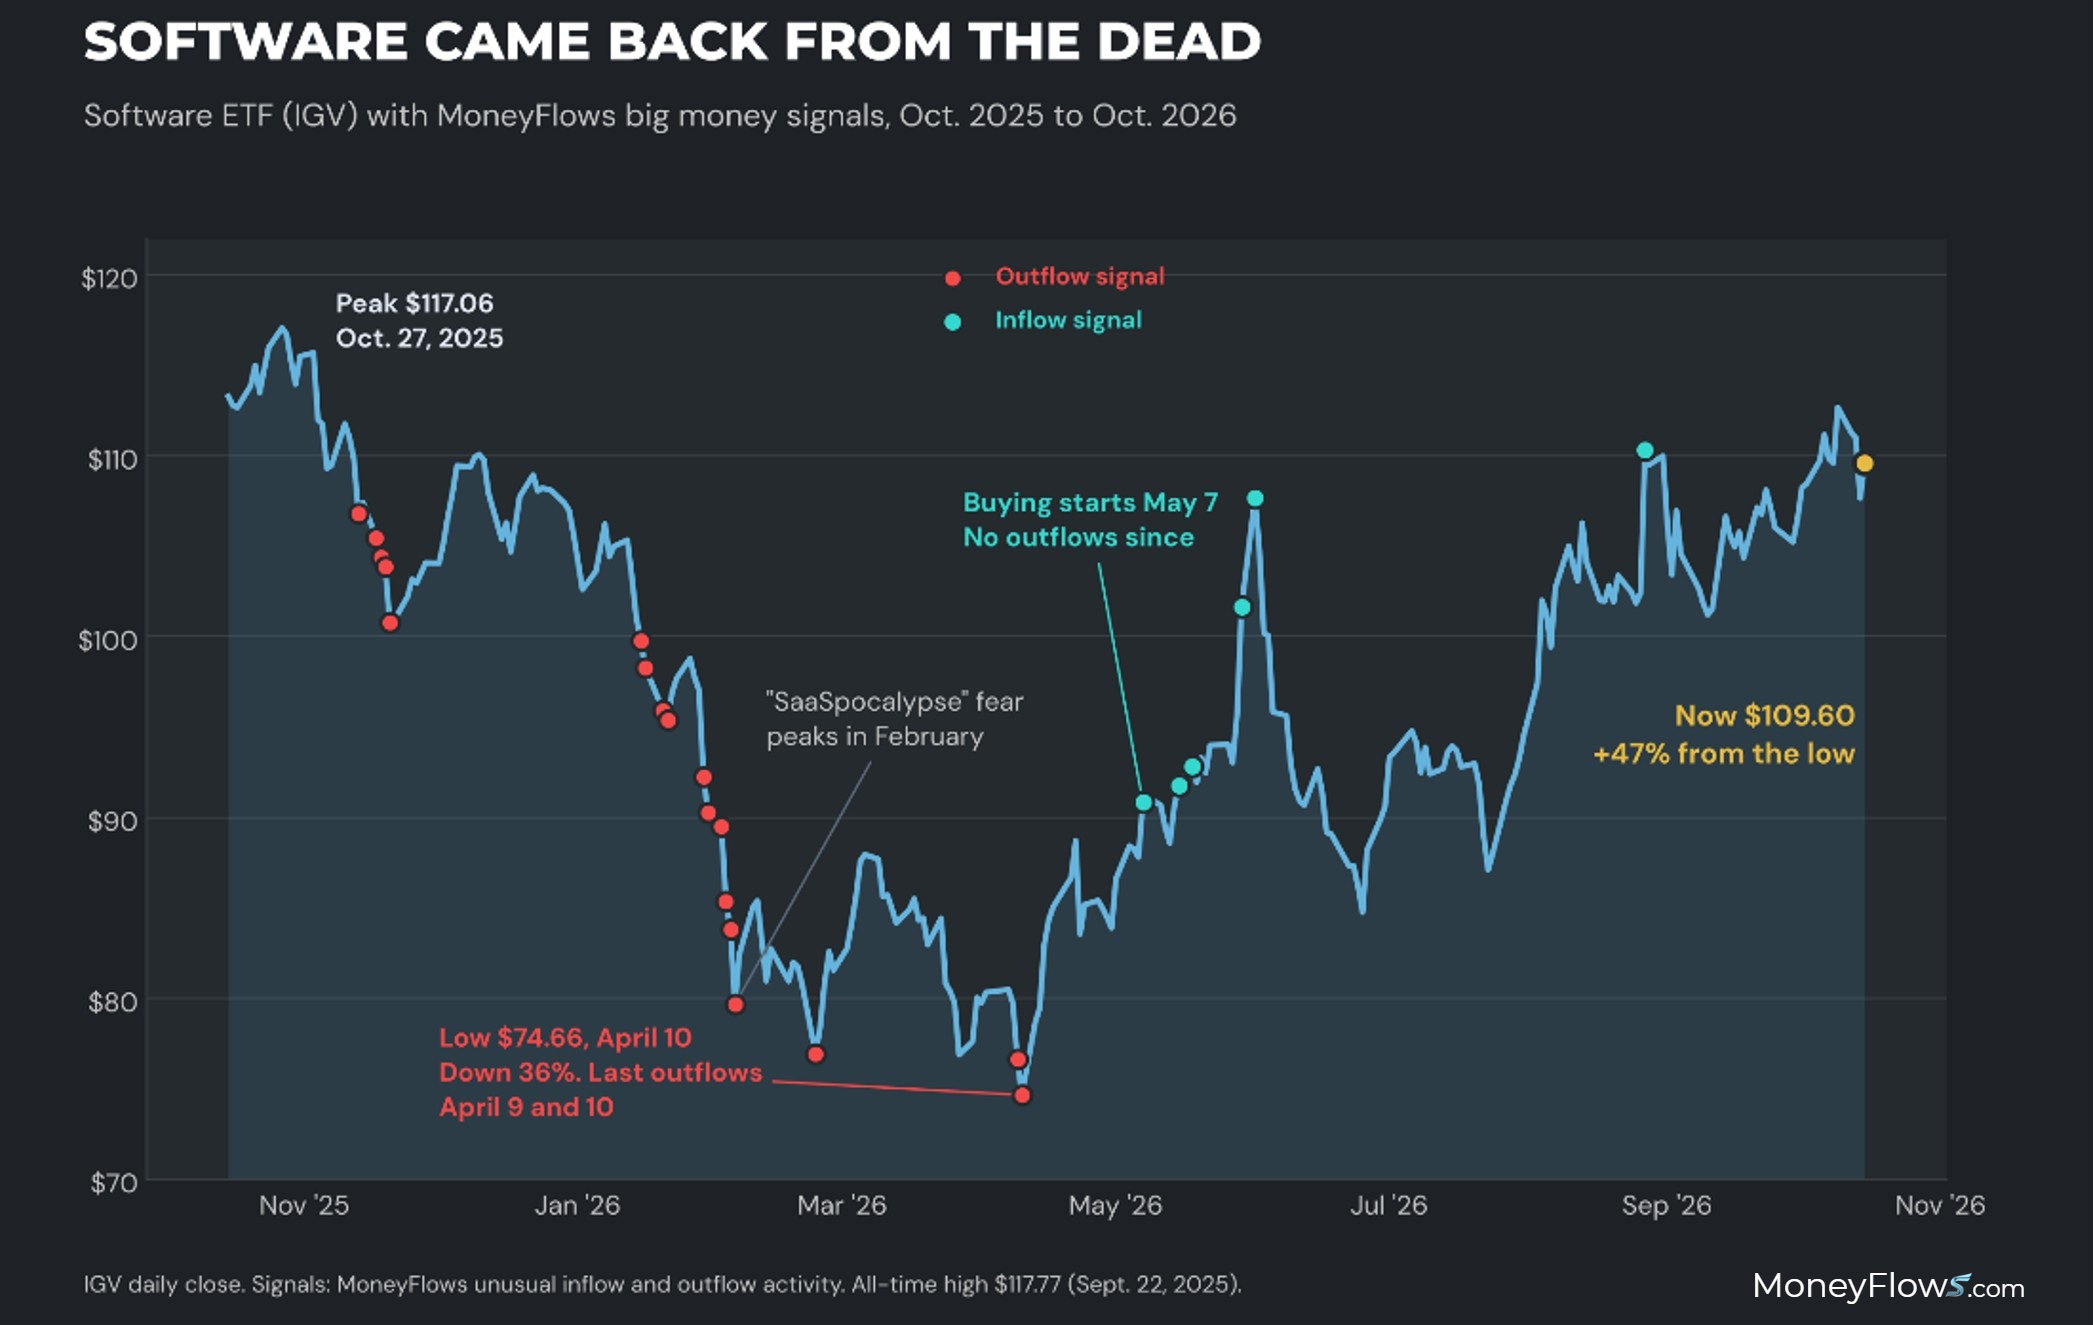
Technology had the most interesting move. Last winter, the fear was that AI would replace software. People called it the “SaaSpocalypse.” The software ETF IGV fell 36%, with Big Money selling all the way down. The last outflow signals came on April 9 and 10, the final two days of the drop.
Then the buying started.
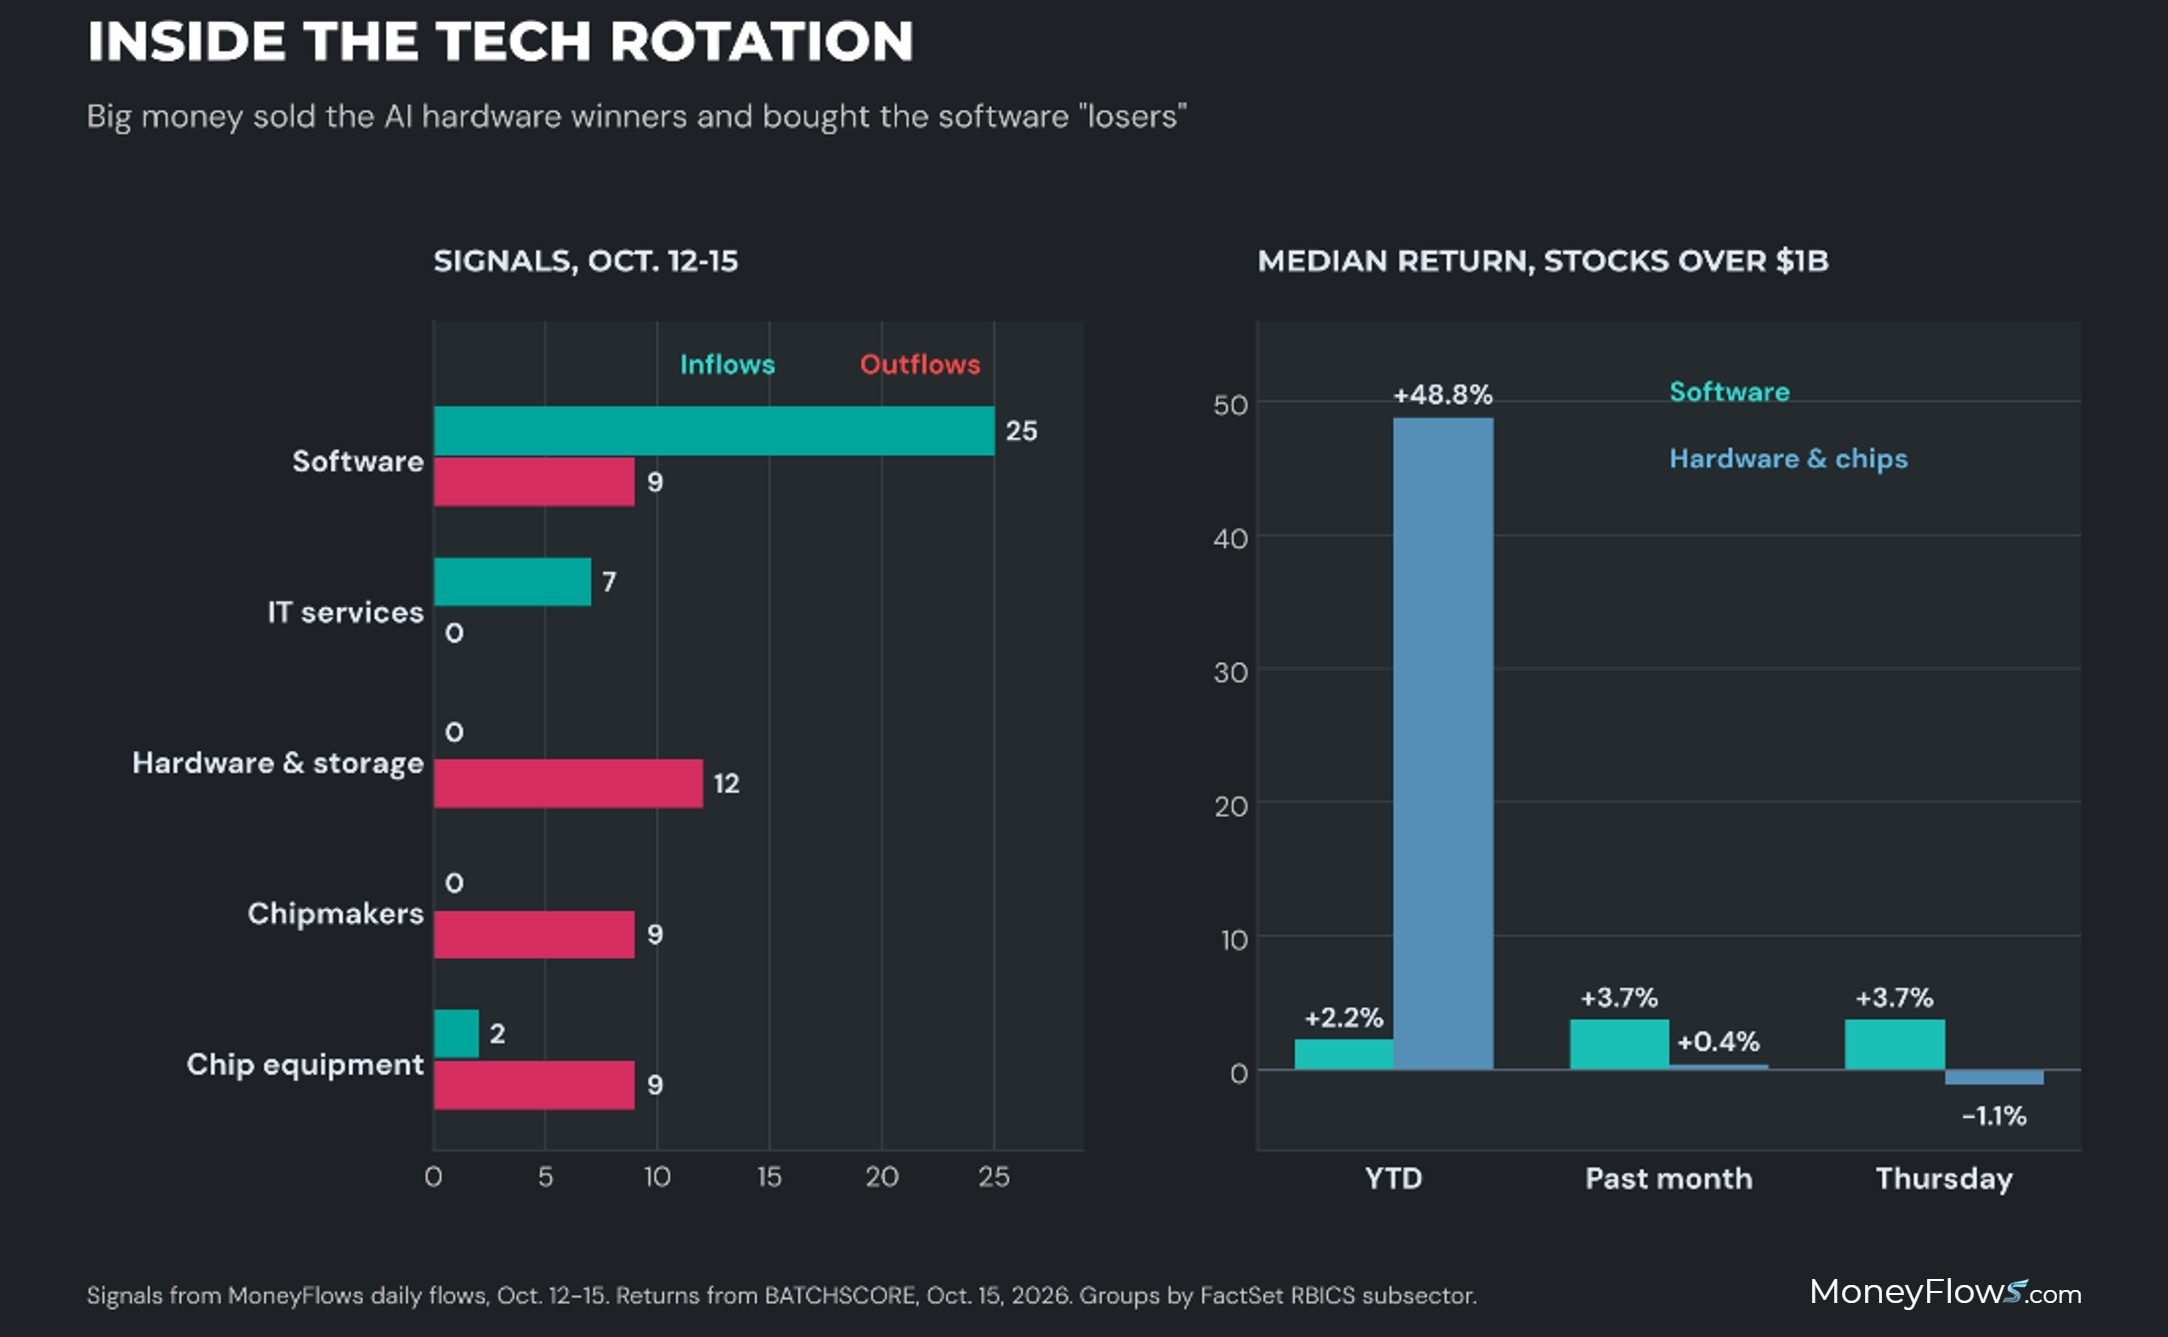
Today IGV is up 47% from that low and sits within 7% of its all-time high. This week, Big Money kept buying. Software drew 25 inflows and 9 outflows, while hardware and chip stocks took 33 outflows against 3 inflows.
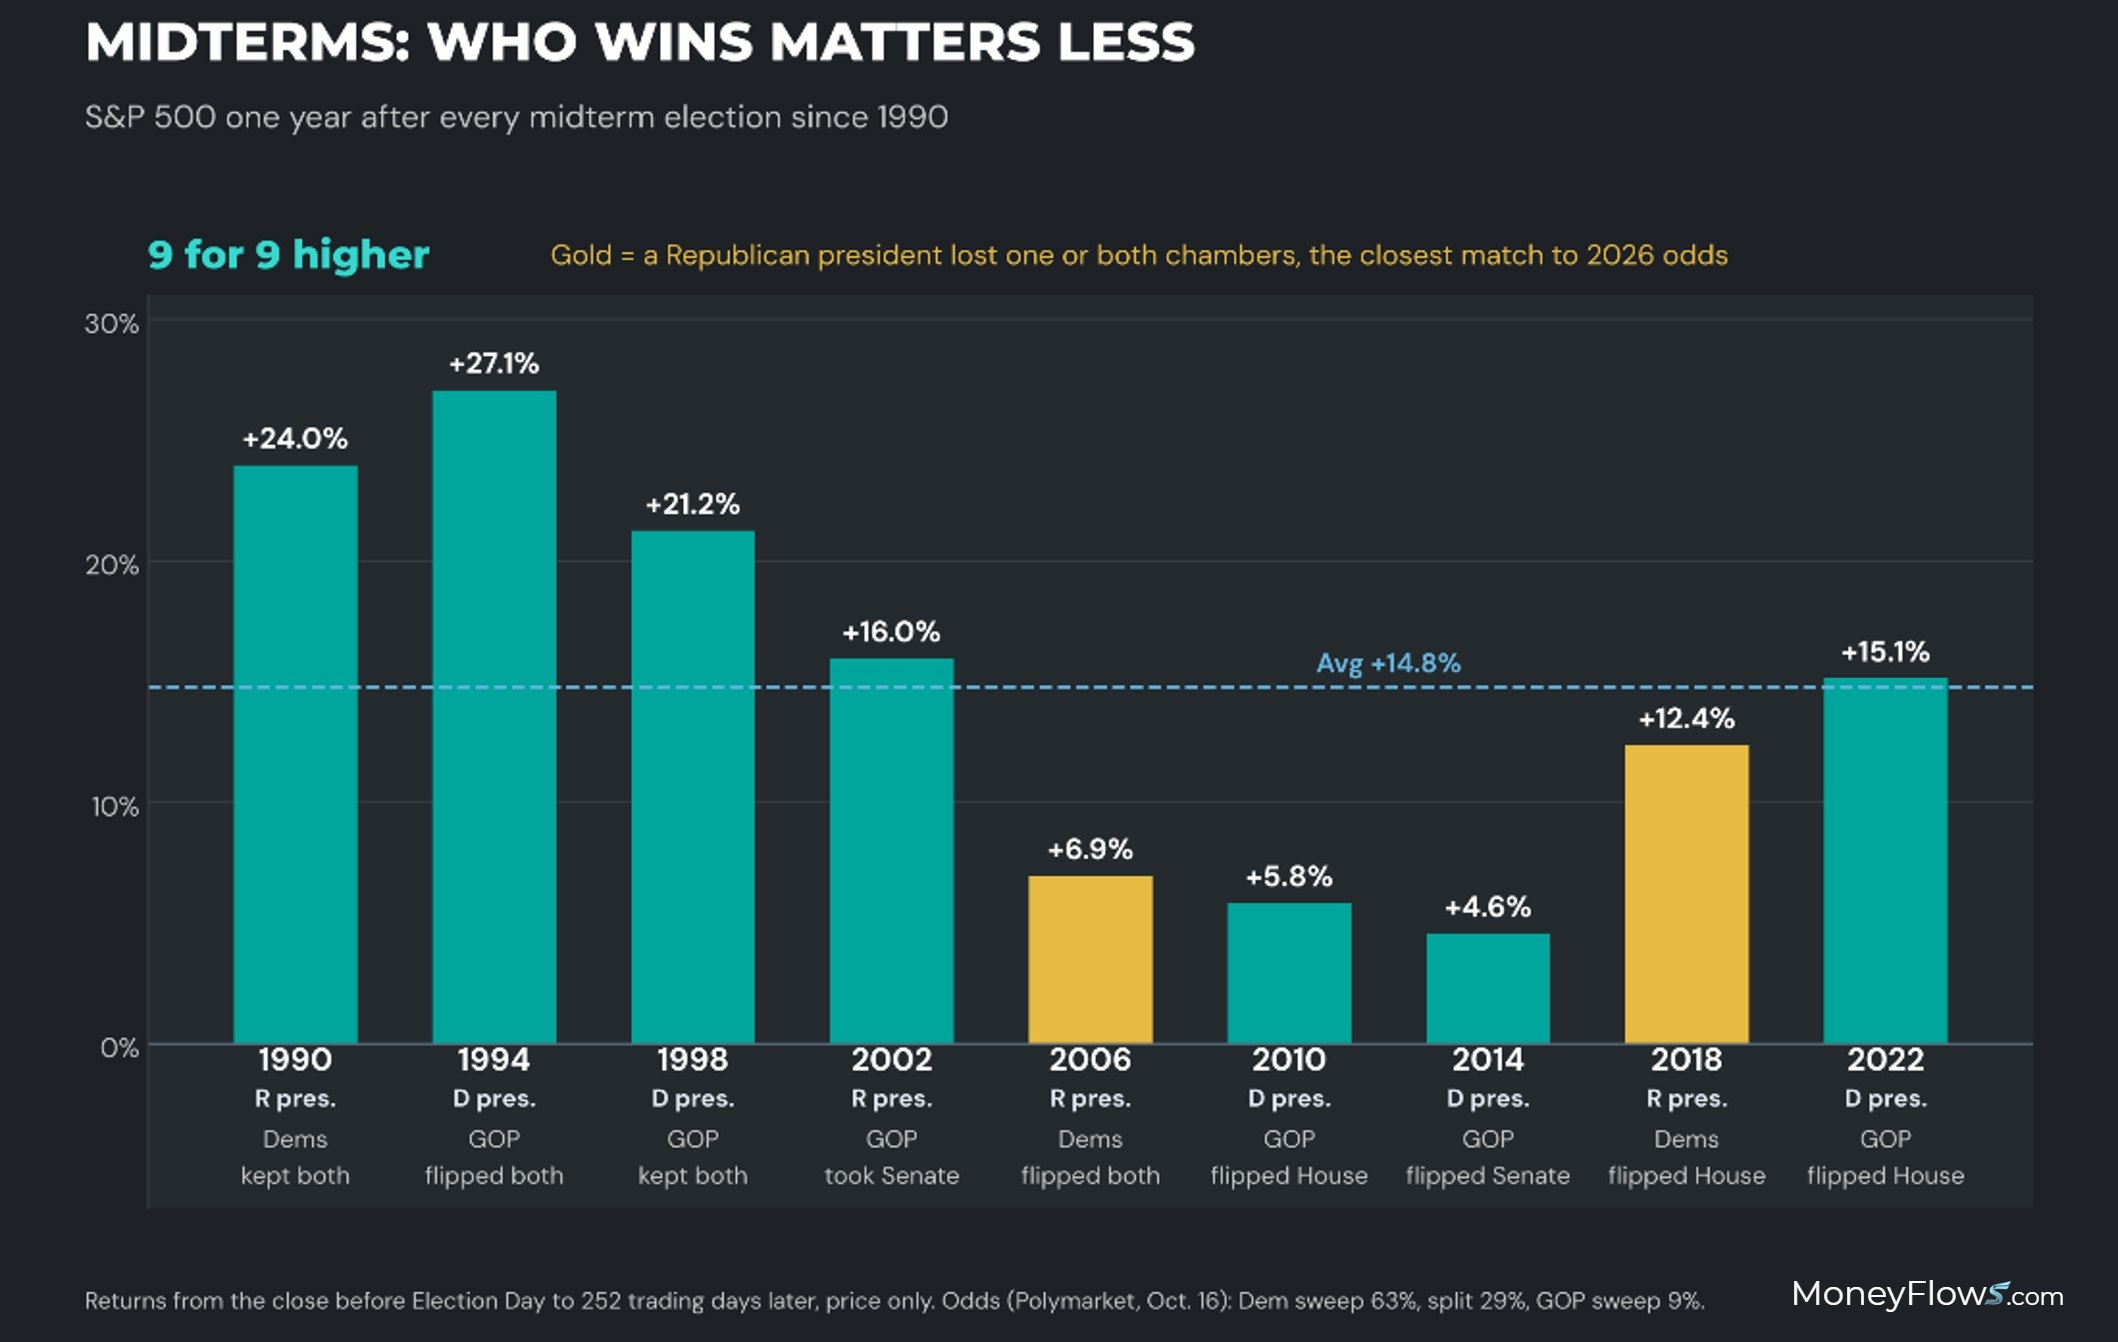
The second thing holding the handbrake is the midterm election on Nov. 3. Prediction markets give Democrats a 63% chance of sweeping both chambers. A Republican Senate with a Democratic House sits at 29%. A Republican sweep is just 9%.
History says getting the election behind us matters more than who wins. I looked at every midterm since 1990. The S&P 500 was higher six months, nine months, and one year later every time. The average one-year gain was 14.8%. That includes 2006, when Democrats took both chambers from a Republican president (+6.9%), and 2018, when they took the House (+12.4%).
Iran is tied to the same date. President Trump said he expects a deal with Iran after the midterms. With Brent crude near $106, Nov. 3 could lift two weights at once.
Market Thaw: 3 Signals a Stock Rally Is Near
Now for the thaw. Three concurrent signals:
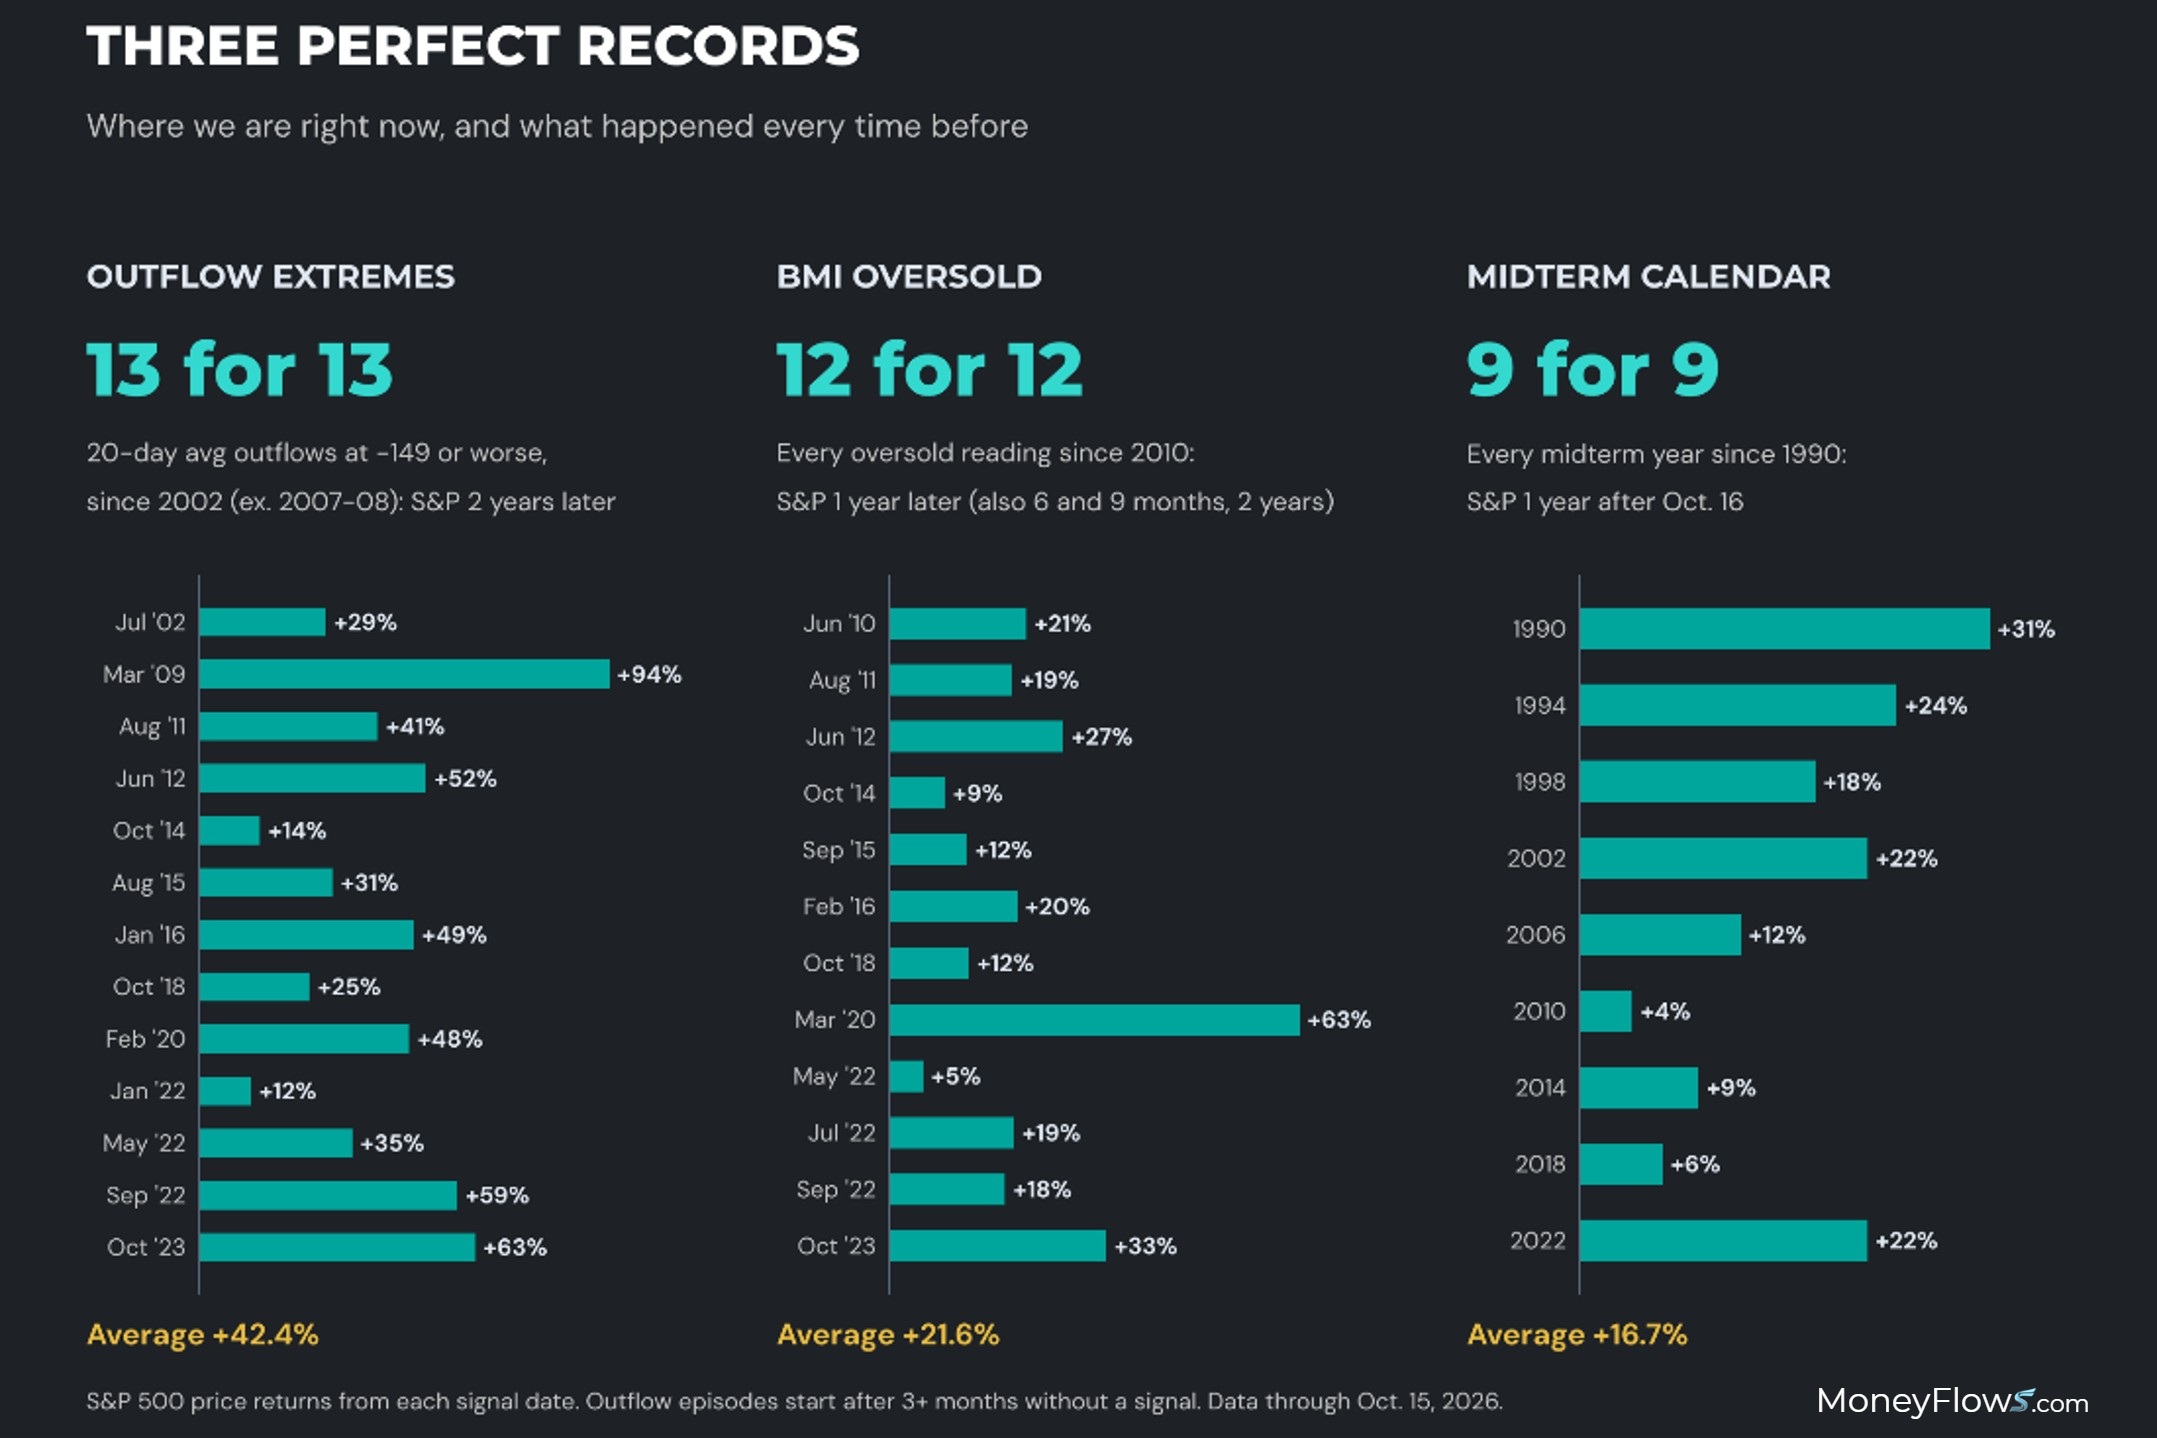
- 1. On Oct. 9, the Big Money Index (BMI) fell below 25% and went oversold. This is one of our strongest signals. Since 2010, the S&P 500 was higher six months, nine months, one year, and two years after all 12 oversold readings. The average one-year gain was 21.6%.
- 2. Outflows have been extreme too. The 20-day average of daily outflows hit 149. Since 2002, leaving out the 2007-2008 financial crisis, the S&P 500 was higher two years later all 13 times, with an average gain of 42.4%.
- 3. The calendar agrees. In seven of the last nine midterm years, the fall low came between Oct. 2 and Oct. 15. One year after Oct. 16, the S&P 500 was higher in all nine midterm years, with an average gain of 16.7%.
Thursday may have been the first heartbeat. Big Money logged 99 inflows, the most since Aug. 21. Inflows were 61% of signals, the first time above 50% since Sept. 4. The BMI ticked higher for the first time in weeks.
Like the frozen frog, the market had to go through its ugly cycles first. The summer fade, the September flush and this week’s deleveraging look like damage, but they’re building antifreeze. We’re washing out, and a rally is close.
Seneca wrote, “Winter brings on cold weather; and we must shiver. Summer returns, with its heat; and we must sweat.”
We sweated through summer. Now we shiver. The thaw is coming.
MoneyFlows finds the winners early…bringing them to you.
If you’re a serious investor or money manager, get started NOW.
Our PRO subscription allows you to spot daily flows and access our weekly Outlier 20 report.
This is the report that has found EVERY SINGLE ONE of our Outlier stocks.
Enjoy a click-through experience unlike anything out there.
Professional money managers and RIAs looking for additional portfolio solutions including ETF flows & ranks and your own Portfolio Tracking tools, please reach out about our Advisor Solution and Emerging Advisor Program.
Have a great week!
***Lastly, join me LIVE, Nov. 30 – Dec. 2, at the MoneyShow Masters Symposium Sarasota, FL. I’ll be presenting: Why the Midterm Election Historically Brings Epic Rallies – And What to Buy Now.
You don’t want to miss this! Click the image below to reserve your spot.