

The Great Market Rotation and Tech Recovery
by Jason Bodner All, Big Money Insights Weekly, StocksThe Great Swap
In February 1995, Newsweek ran a column by astronomer Clifford Stoll called, “Why the Web Won’t Be Nirvana.” He mocked the idea of shopping online. Over 30 years later, the company that started selling books online just reported $202 billion in quarterly sales. Its stock fell anyway. Doubting the future is popular, though it’s not often profitable.
AI stocks took another gut punch this week. Alphabet (GOOGL) dropped 12.6% on Thursday. ServiceNow (NOW) collapsed 27%. Amazon and Intel reported after the bell, and Nasdaq 100 futures were down about 2.5% before Friday’s open. Naturally, the headlines are saying, “The AI trade is dying!”
I’ve heard this one before. Over the summer, forced liquidations at Situational Awareness dragged AI stocks lower until NVIDIA (NVDA) reported and crushed the negativity in a single evening. This October, rumors have VARA, a $26 billion fund holding many of the same stocks, deleveraging too. The narrative was there, but the death wasn’t.
Here’s what’s really happening: “Investors” are tired of paying for spending. Alphabet and Amazon are pouring so much into data centers that free cash flow went negative. Intel plummeted 30% Friday on a shrinking PC business and weak guidance. But looking at the AI parts of those reports:
- Google Cloud grew 103%.
- Amazon’s AWS grew 39%, its fastest pace in nearly five years.
- Intel’s data center and AI revenue jumped nearly 80%, and the CEO said they couldn’t make chips fast enough to meet demand.
This isn’t a dead theme. This is bearish consolidating for the next bull leg higher.
The Great Market Rotation and Tech Recovery
And I believe that leg is coming. The money isn’t leaving tech…it’s swapping.
This week, software stocks showed 27 unusual inflows against just seven outflows. Internet and data services (home of Google and the AI cloud operators), saw one inflow against 16 outflows. Over the past month, the median software stock is up 13.6% while the median chip equipment stock is down 17.4%.
Remember the “SaaSpocalypse”? Software was supposedly finished. Now 15 of the 20 top-ranked stocks in our tech universe are software companies.
Here’s what almost no one is talking about. While chip stocks get crushed, analysts are raising their projections. Among chipmakers worth $1 billion or more, 66% have seen quarterly earnings estimates rise over the past month. Only 16% have seen them fall. Yet 82% of those same stocks are in a bear market.
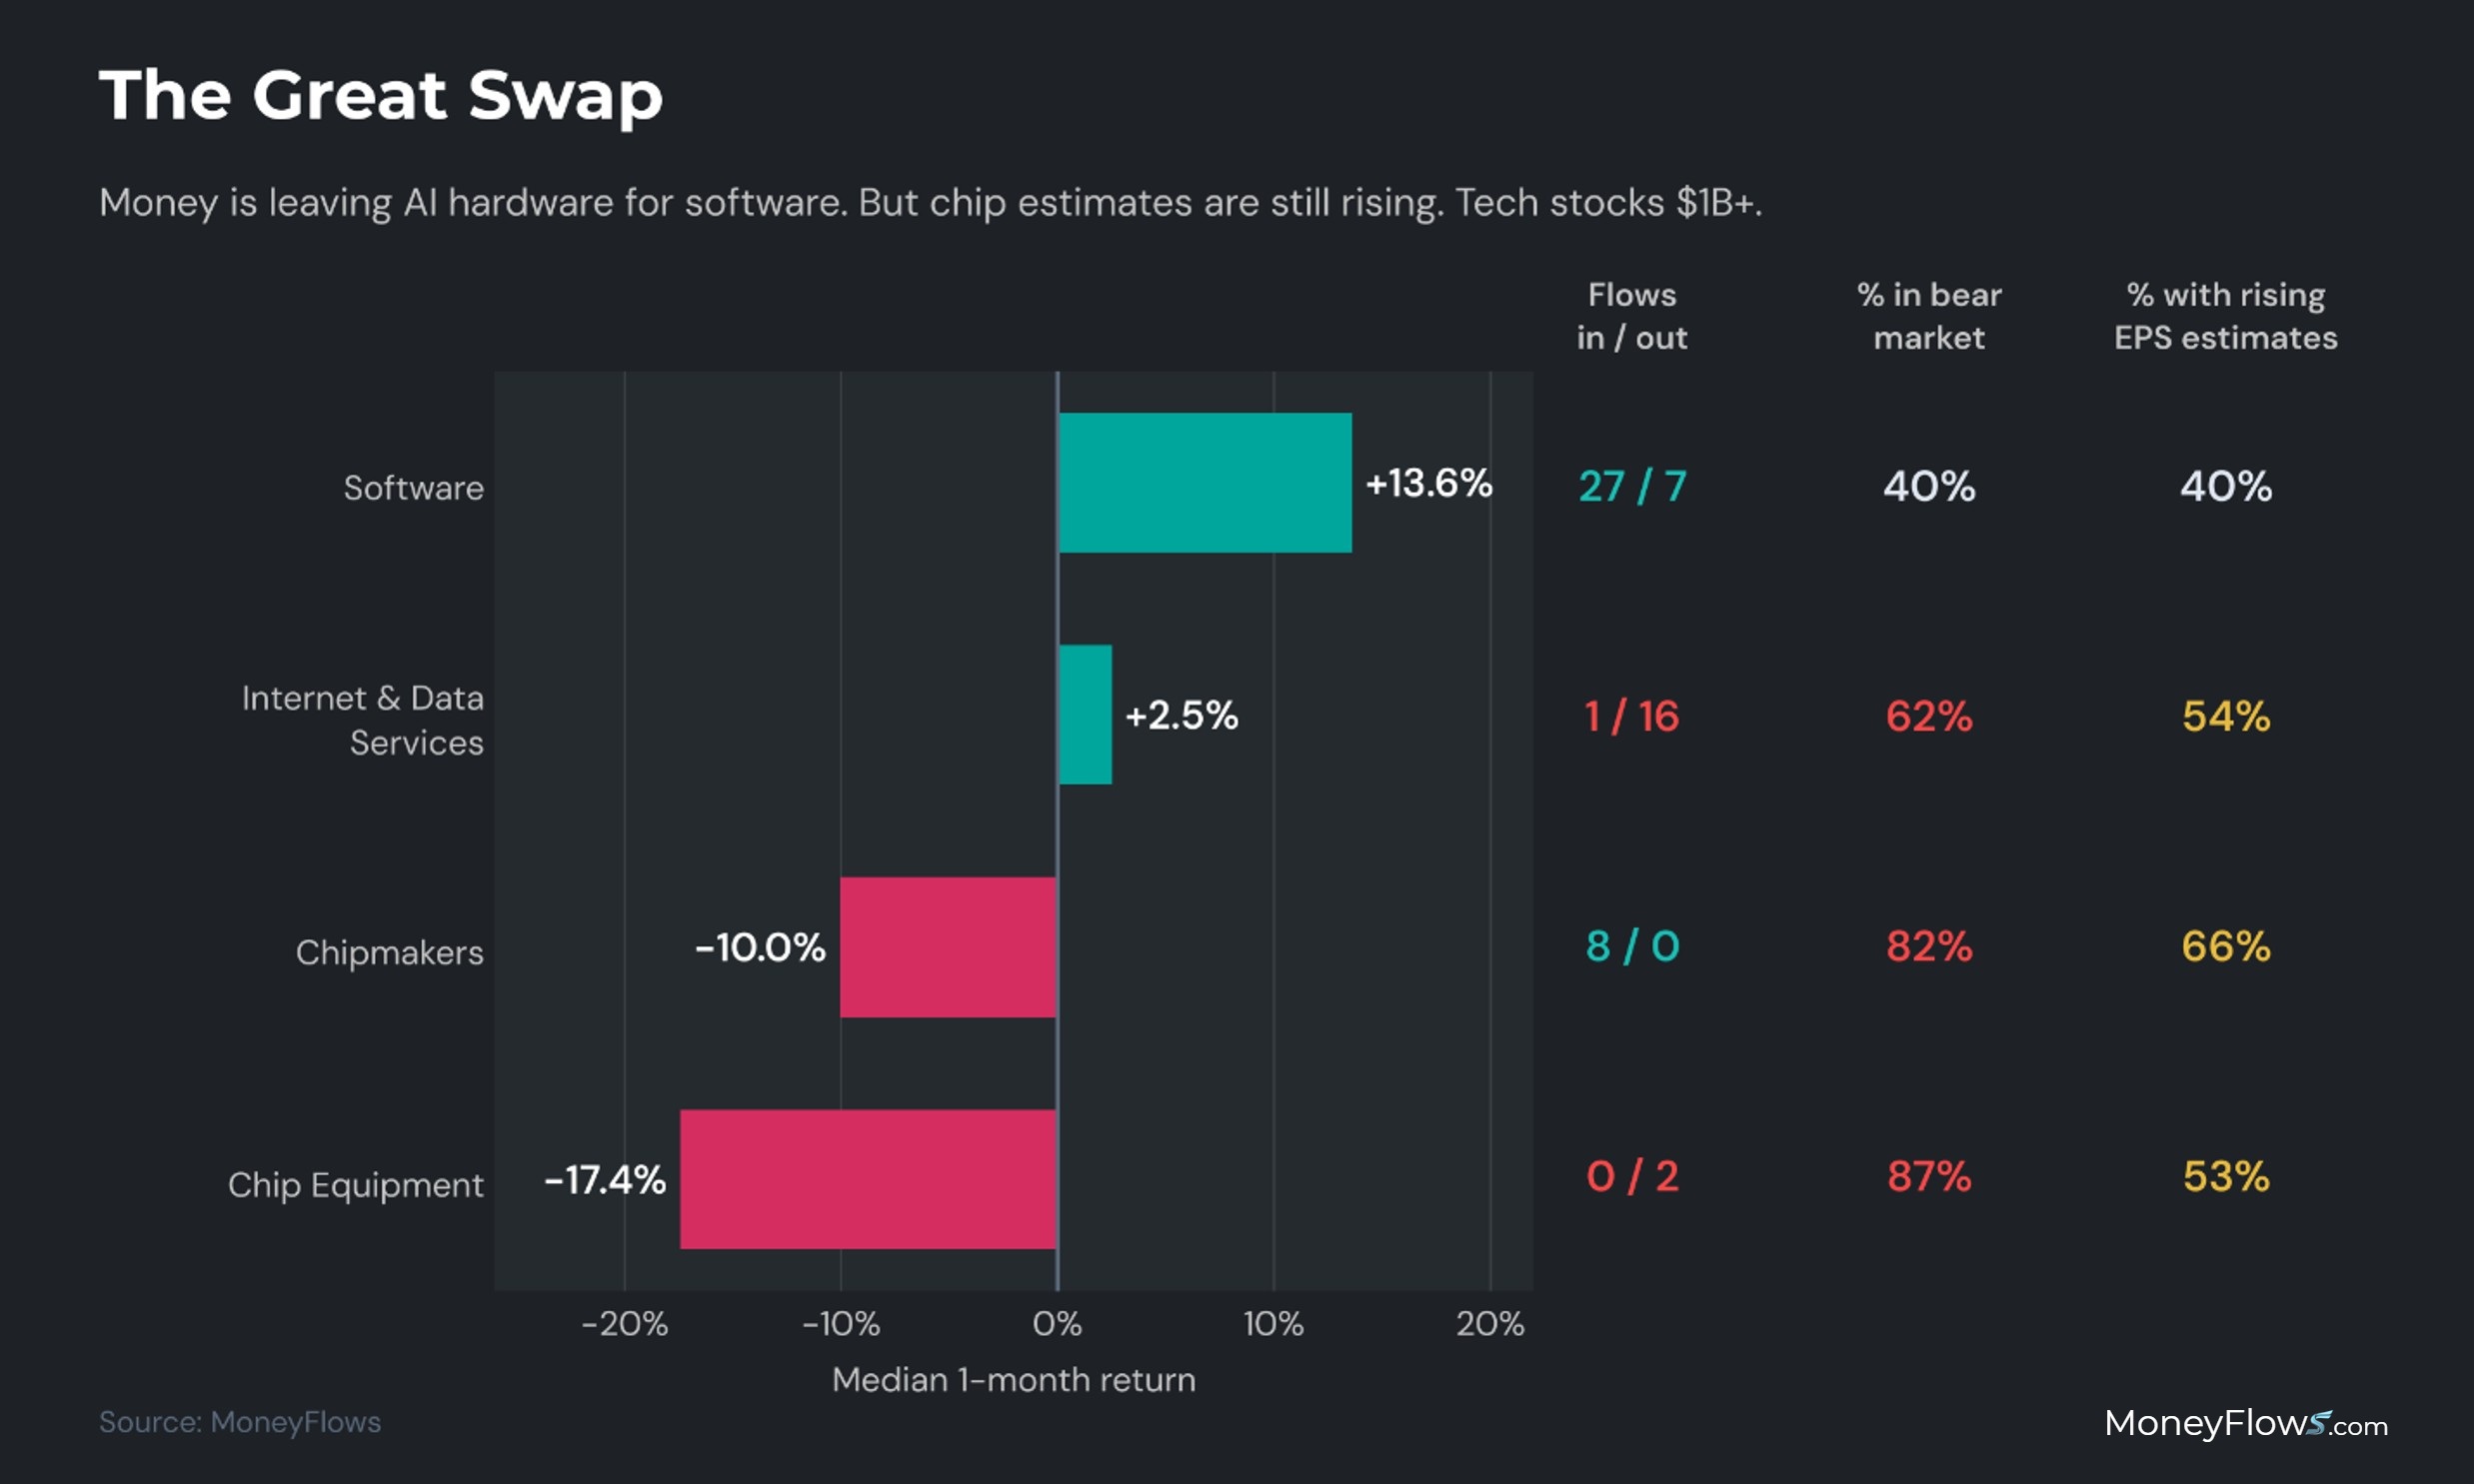
Prices are falling while earnings estimates are rising. That sounds like opportunity to me.
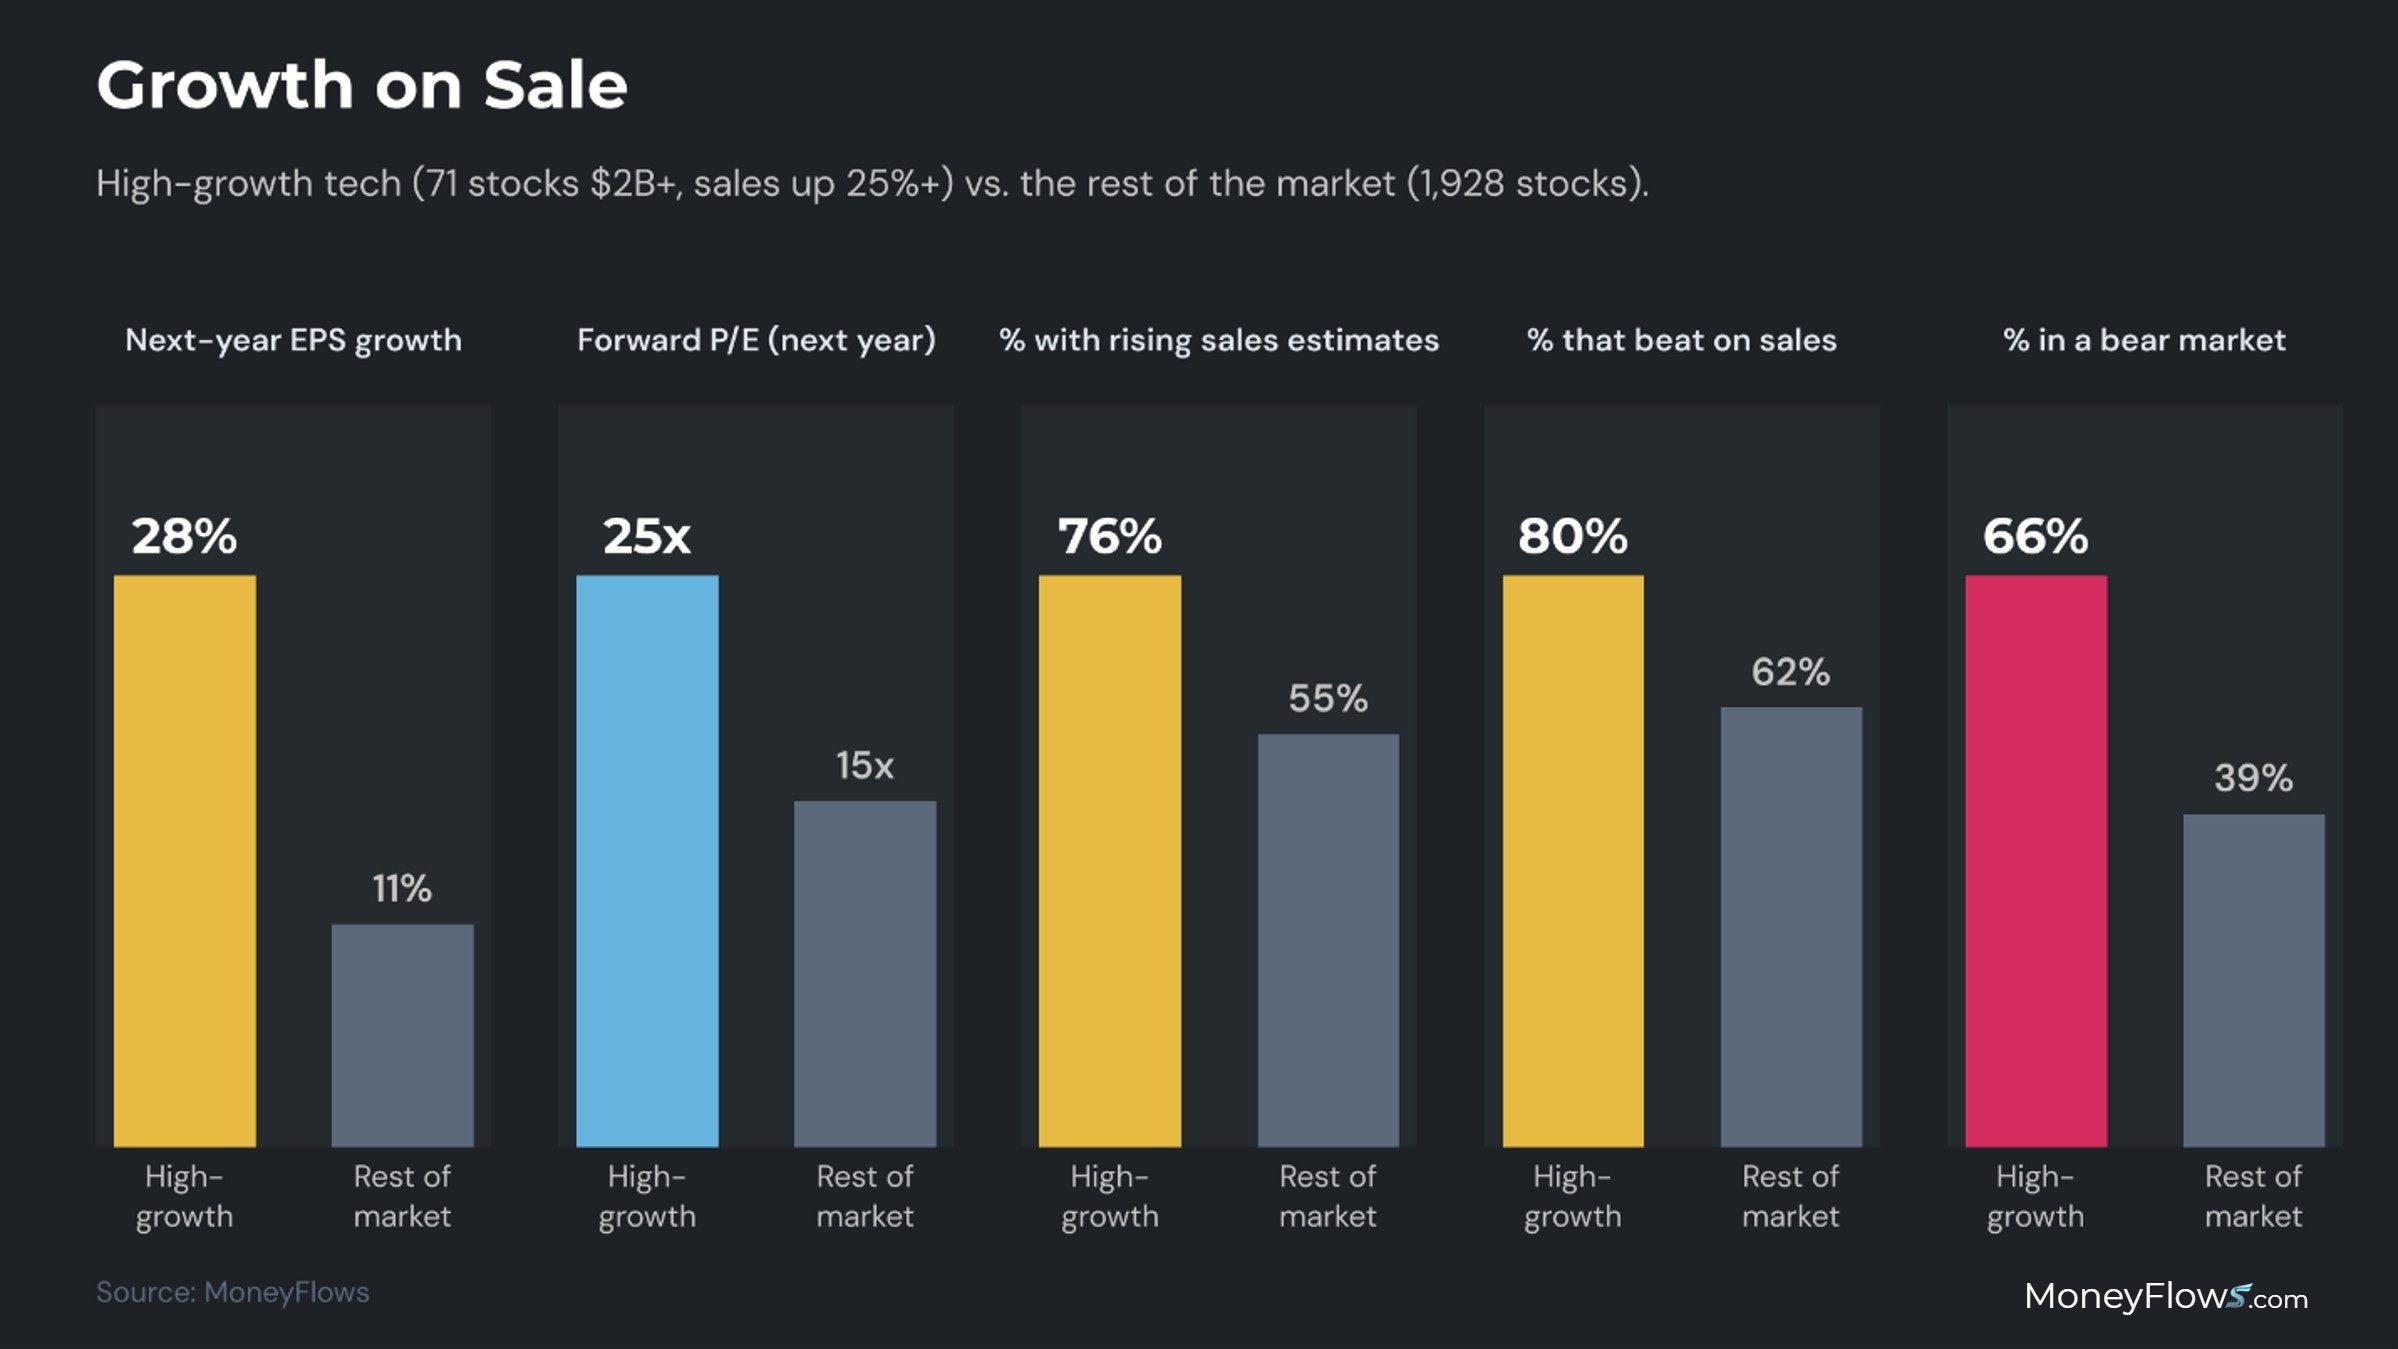
In looking at every tech company worth $2 billion or more that’s growing sales at least 25%, there are 71 of them in MoneyFlows data. Analysts expect earnings to grow 28% next year versus 11% for the rest of the market. These firms trade at 25 times forward earnings, so you pay less per point of growth than for the average stock. Three out of four have rising sales estimates. Four out of five beat on sales last quarter. And two out of three are in a bear market.
Growth is on sale.
Outside tech, money keeps moving, not leaving. We logged 263 inflows against 188 outflows this week. Health care led with 63 buys, mostly big drugmakers and the labs that serve them. Energy had 24 buys against two sells with oil above $100, and defense contractors led the industrials buying for the same reason. Utilities had 17 buys and zero sells.
The consumer is showing up too, with buying in hotel real estate stocks, apparel retailers, cruise lines, and restaurants. That fits the economy growing at a 3.4% clip last quarter.
That’s not panic. That’s rotation. And rotation is what healthy markets do before the next advance.
Which brings me to the calendar. The midterms are Tuesday, and history is screaming bullish.
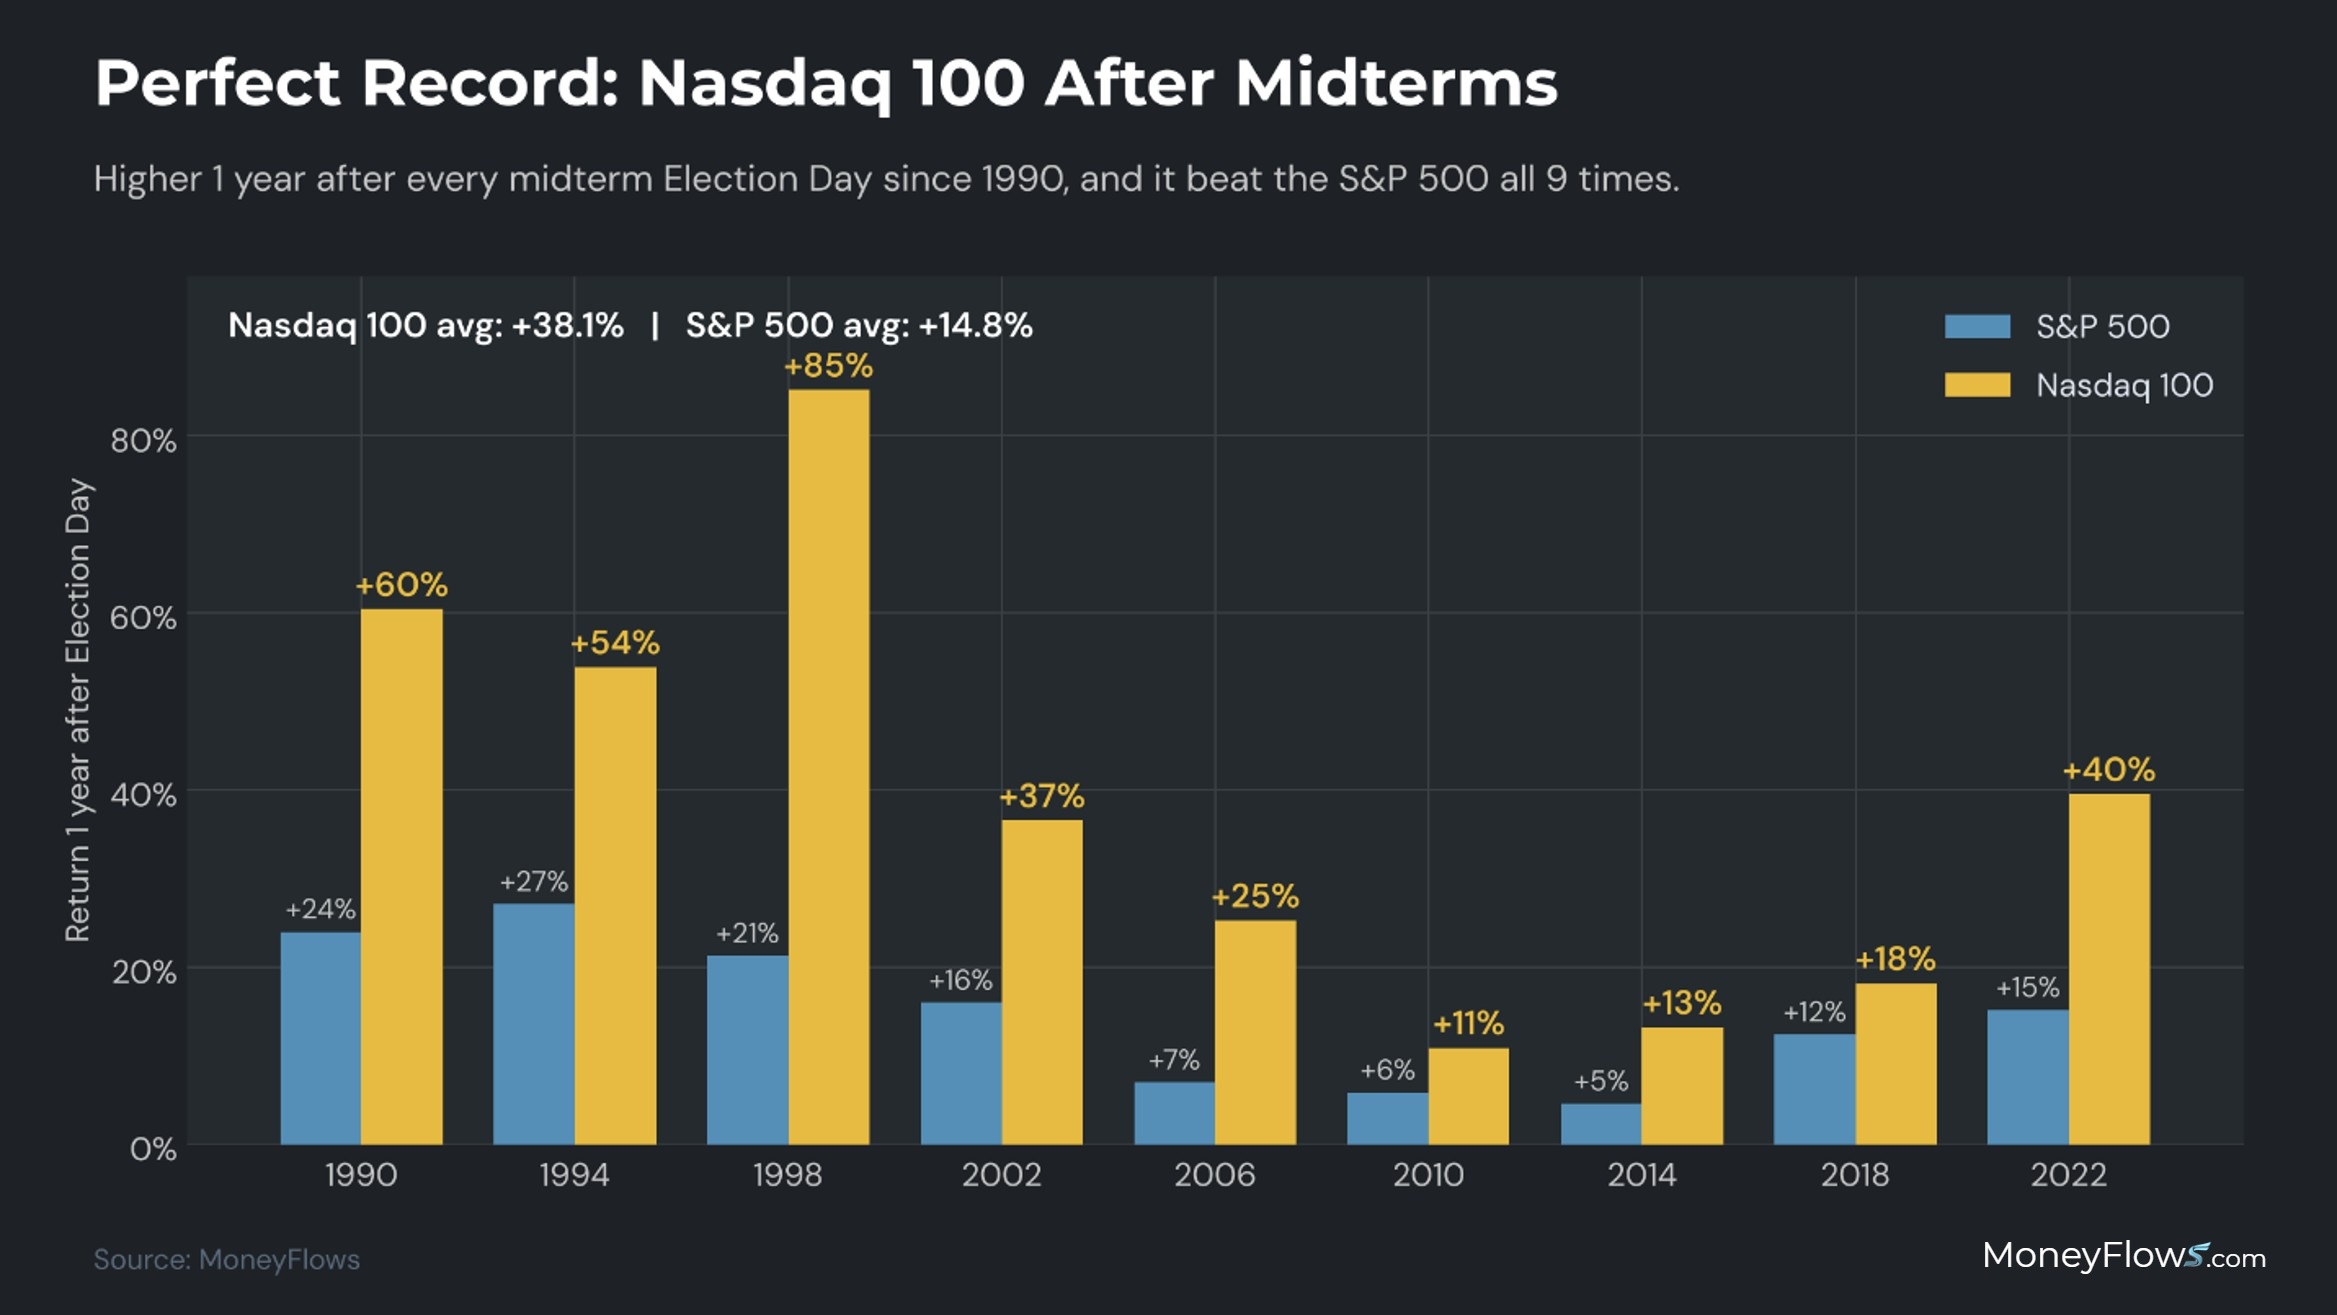
Since 1950, the S&P 500 has been higher 12 months after all 19 midterm elections, with an average gain of about 15%. Tech does even better. Since 1990, the Nasdaq 100 has been higher one year after every midterm election. That’s nine for nine, with an average gain of 38.1%, and it beat the S&P 500 all nine times.
The seasonal tailwinds stack up too. The fourth quarter of a midterm election year has been positive 16 of 19 times since 1950, averaging a 6.6% gain. And 2027 is the third year of the presidential term, the pre-election year. Since 1950, the S&P 500 has fallen in only two of them, 2011 and 2015, both by less than 1%. In our data, the Nasdaq 100 rose in all nine pre-election years since 1991 by an average of 42.2%.
It gets better. In midterm years with real turmoil before the election, the Nasdaq 100 averaged a 47.9% gain the following year. In calmer years, it averaged 25.8%. This year the index looks calm, but the median chipmaker is 34% off its high.
The tumult is real. It’s just hiding behind the index.
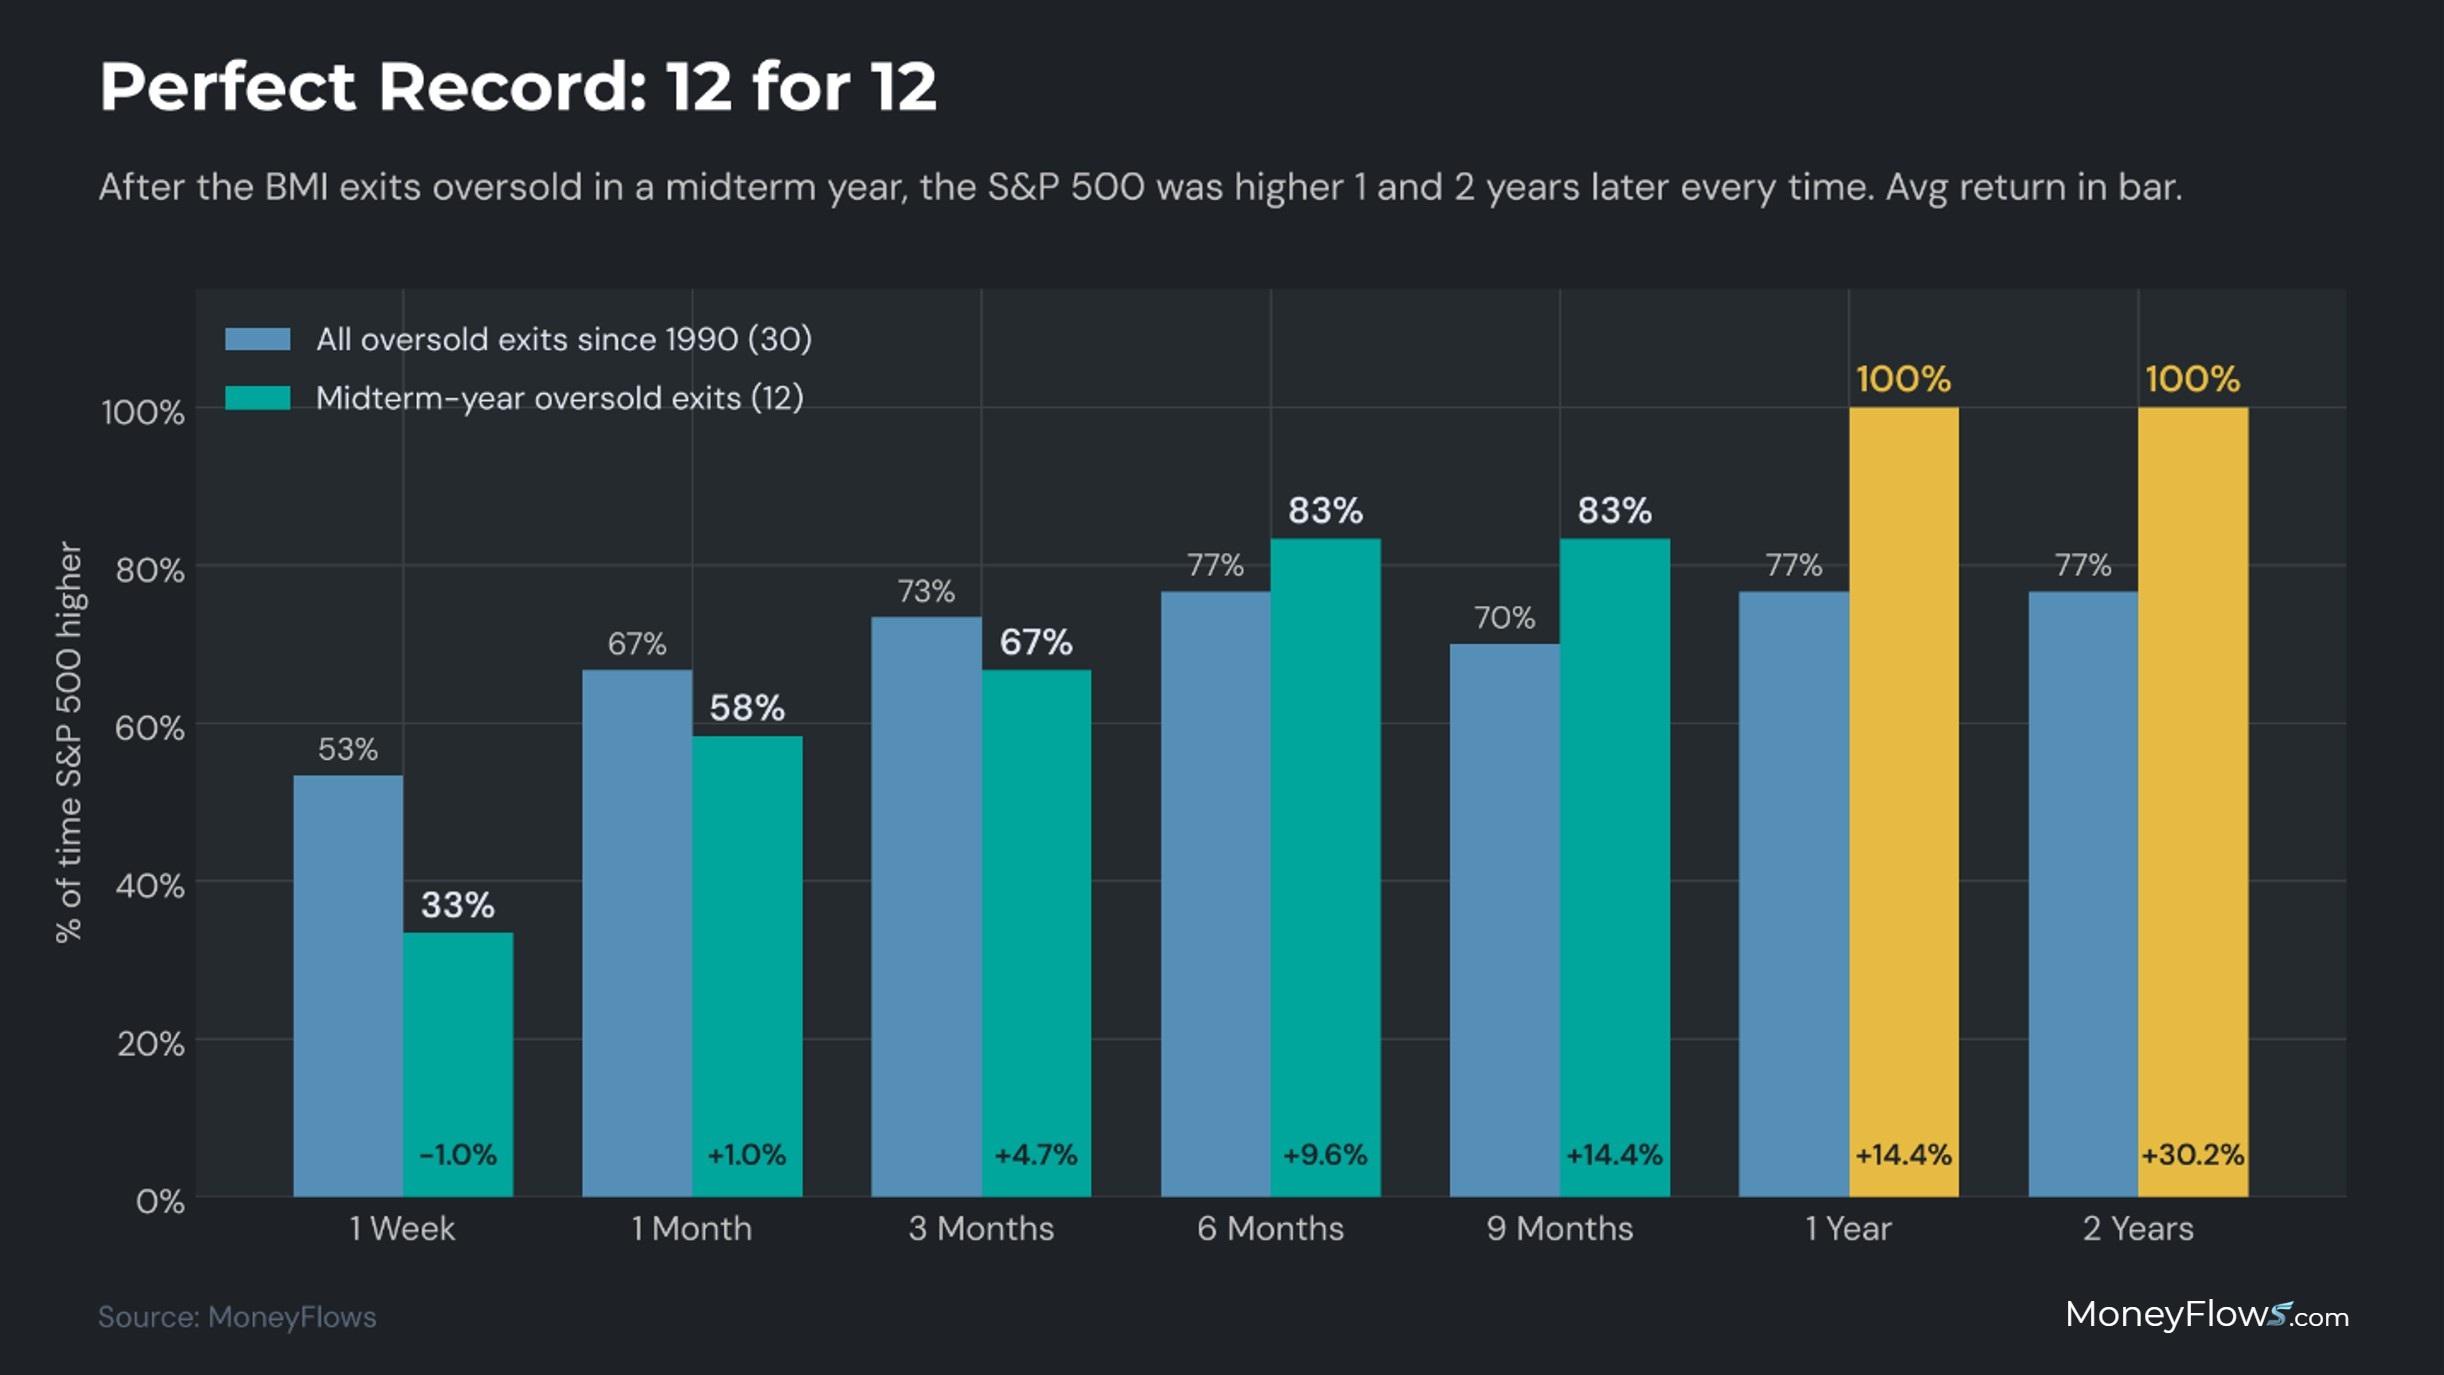
Then there’s the Big Money Index. It bottomed at 22.9% on Oct. 14, and it’s since climbed to 35.3%. Goin back to 1990, the BMI has exited oversold during a midterm year 12 times. The S&P 500 was higher one year later every single time, with an average gain of 14.4%. Two years later, it was higher every time, up 30.2% on average.
That’s three perfect records, all pointing in the same direction.
So where do the opportunities arise in 2027? I screened for stocks worth $2 billion or more that are down at least 25%, rank in the top quarter for fundamentals, and have rising earnings estimates. It resulted in 73 hits.
Picture a jar of marbles where only 7% of them are red. Grab 73 of them at random and you’d expect about five red ones. In our market, the red marbles are AI buildout companies: chips, storage, power equipment, and data center builders. Out of those 73 bargains, 26 were red. That’s not chance. That’s where the value is hiding.
That’s where I think the coiled spring sits. The stocks being sold hardest have the best fundamentals and rising estimates. Add software already leading, health care and energy drawing steady money, and a consumer that keeps spending, and 2027 is setting up as a broad advance, not a narrow one.
Will it be smooth? Unlikely. One week after those BMI signals, stocks were higher only a third of the time. With rates above 5%, oil above $100, and an election on Tuesday, expect choppiness. But volatility after a bottom is normal. It’s how markets shake out the doubters before the next run.
My belief in these themes hasn’t wavered. Only the mood has. And moods, unlike data, don’t last.
As Seneca put it, “We suffer more often in imagination than in reality.”
MoneyFlows finds the winners early…bringing them to you.
If you’re a serious investor or money manager, get started NOW.
Our PRO subscription allows you to spot daily flows and access our weekly Outlier 20 report.
This is the report that has found EVERY SINGLE ONE of our Outlier stocks.
Enjoy a click-through experience unlike anything out there.
Professional money managers and RIAs looking for additional portfolio solutions including ETF flows & ranks and your own Portfolio Tracking tools, please reach out about our Advisor Solution and Emerging Advisor Program.
Have a great week!
***Lastly, join me LIVE, Nov. 30 – Dec. 2, at the MoneyShow Masters Symposium Sarasota, FL. I’ll be presenting: Why the Midterm Election Historically Brings Epic Rallies – And What to Buy Now.
You don’t want to miss this! Click the image below to reserve your spot.