Is the Stock Market About to Bottom? The October Turn
by Jason Bodner All, Big Money Insights Weekly, StocksWhen light is low, our eyes shift from cones to rods. Known as the Purkinje effect, cones handle color in bright conditions while rods take over when light fades.
Vivid reds nearly disappear. Blues and greens become more visible. Your eyes are working fine, the light conditions simply changed. What you see depends on how you’re looking, not just what’s there.
Many investors see major indexes within 3% of all-time highs. Everything looks fine. But scan 5,000+ individual stocks and a very different picture emerges.
Hidden Bear
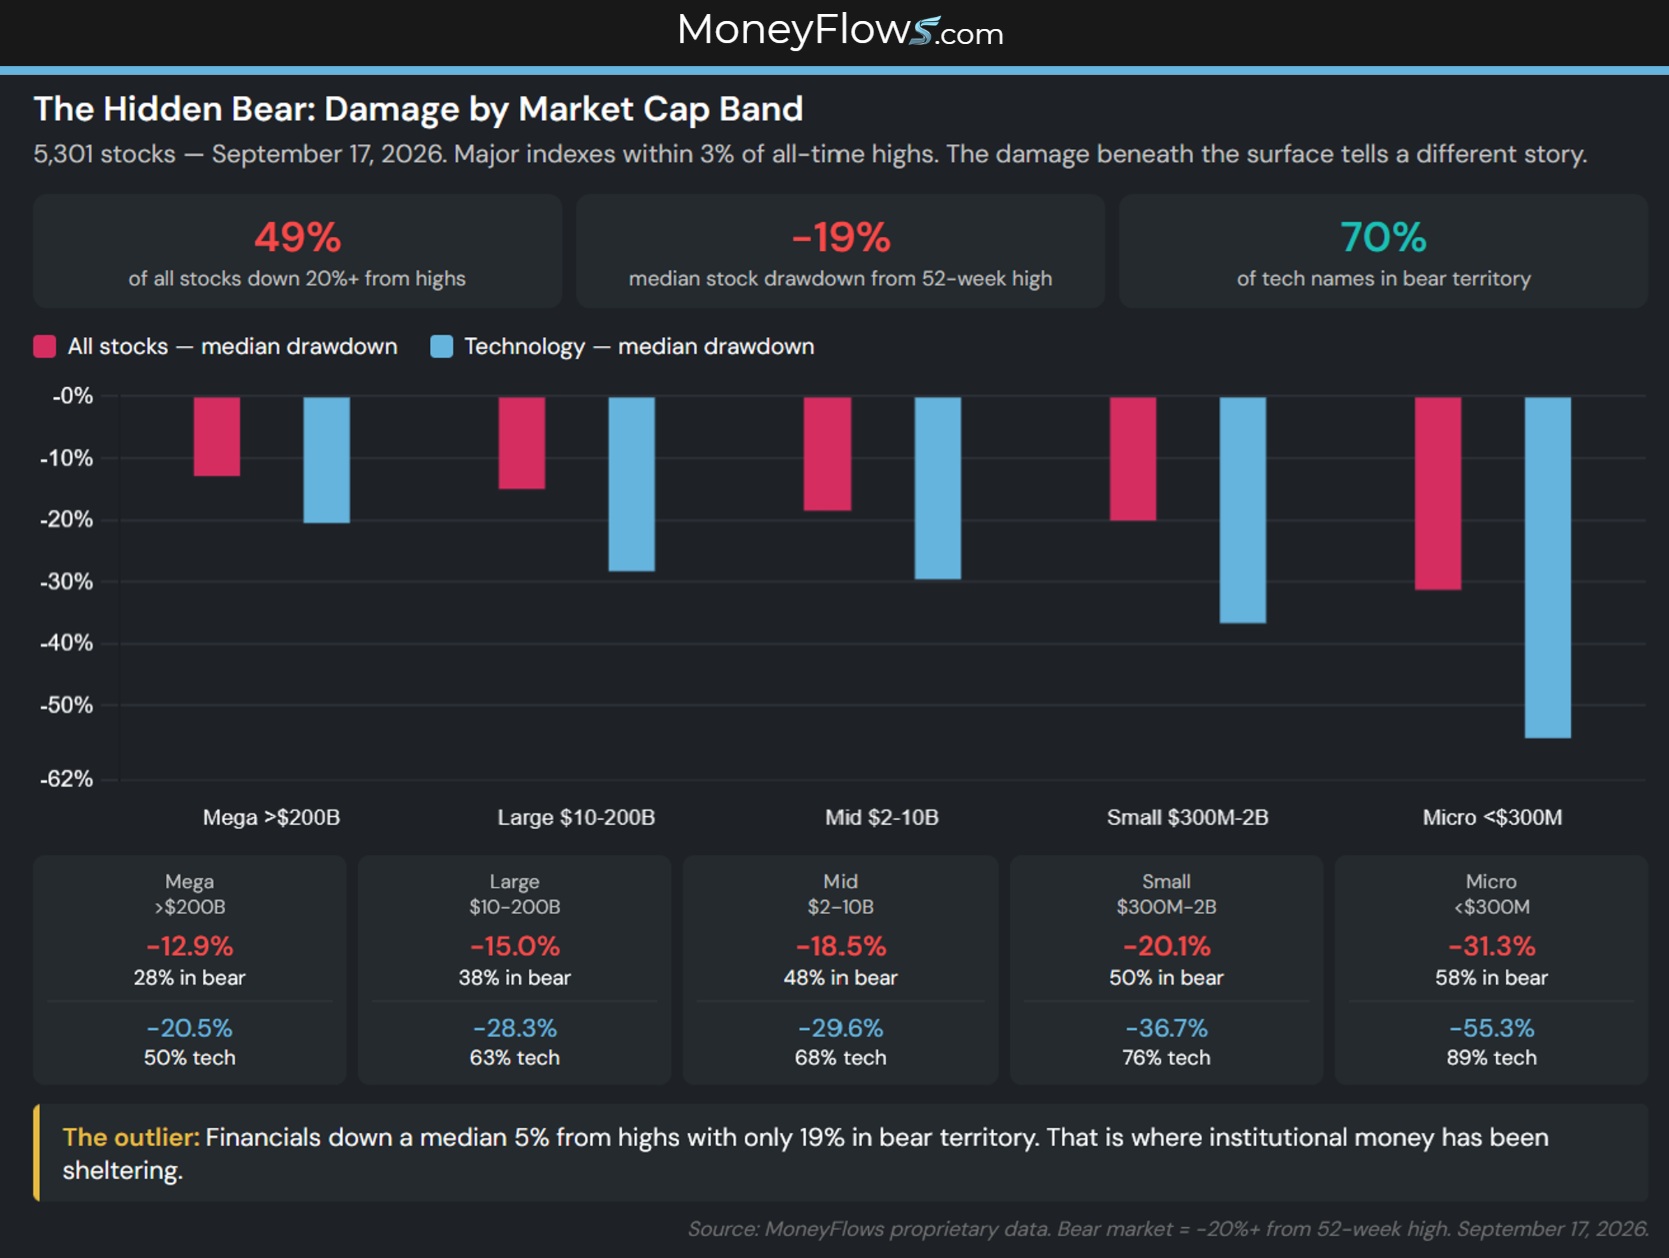
Nearly half (49%) of the publicly traded companies in the MoneyFlows universe are down 20% or more from their 52-week highs.
By definition, that is a bear market. Thursday’s relief rally barely moved the needle, shaving the number by roughly 1.5%. The bear is awake, you just have to look to find it.
The average stock is 19% off its high. The cap-weighted index is up nearly 20% year-to-date while the median stock is up 5%.
The damage shows a clear staircase. Bigger companies have fallen less. Smaller companies have been hit harder.
Mega-caps are down a median 13% from their highs, with 28% in bear market territory. Large-cap stocks are down 15%, with 38% of them down 20% or more.
Mid-caps down 18%, with nearly half in bear markets. Small-caps are down 20%, half below the threshold. Micro-caps are down 31%, with 58% in bear territory.
Technology is worse at every level, with 70% of all tech names in bear markets and the median tech stock down 34%.
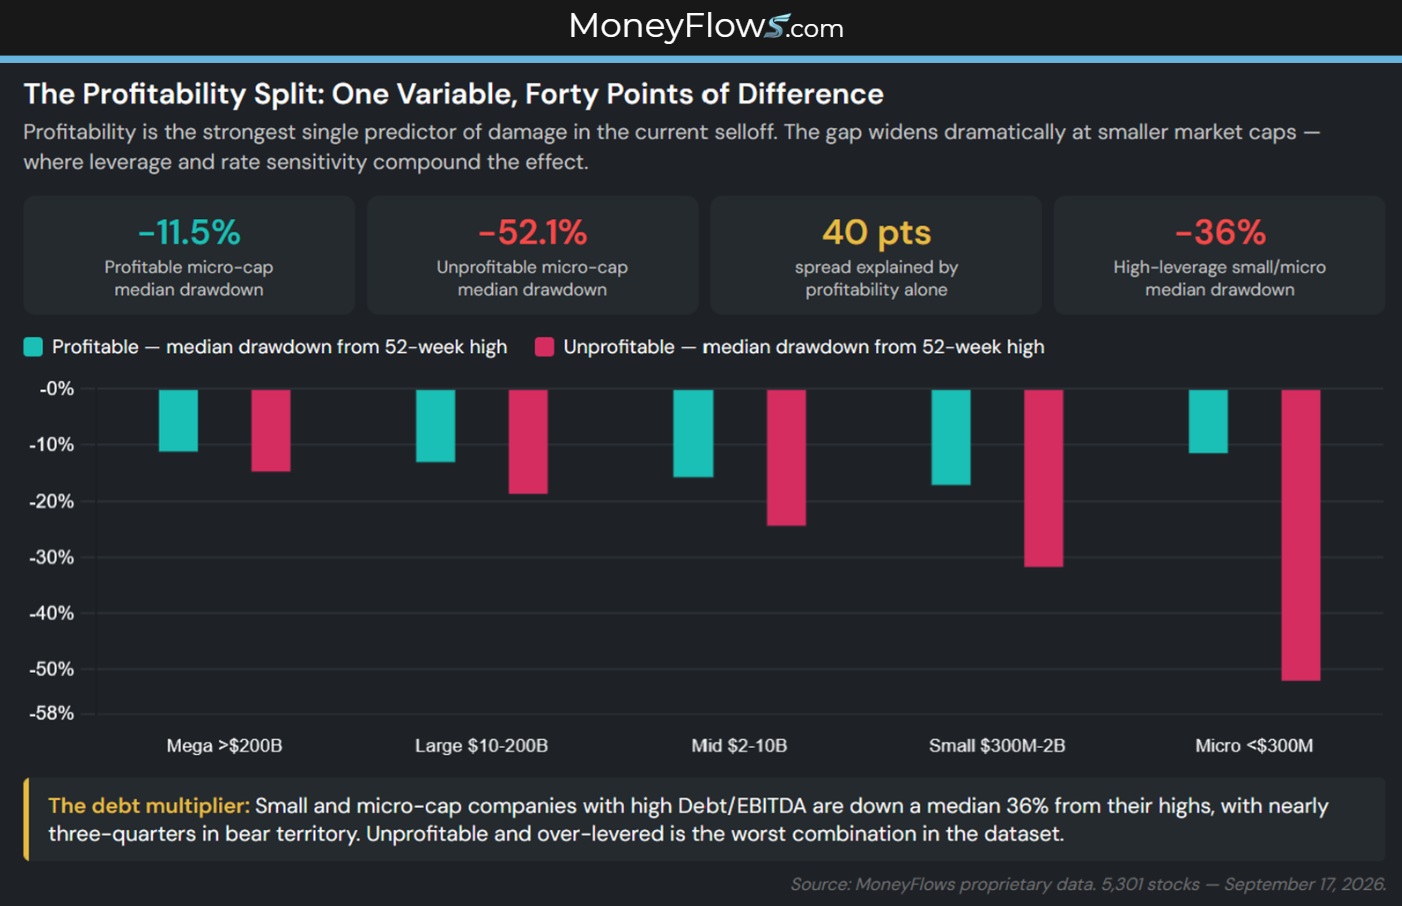
Two fundamentals predict damage. Profitability matters most. Profitable micro-caps are down an average 11% from the high. Unprofitable micro-caps are down 52%. That’s a 42-point spread driven by whether the business makes money.
Debt compounds it. Small- and micro-cap companies with high leverage are down a median 36%, with nearly three-quarters of them in bear territory.
Financials, down a median 5%, stands apart with only 19% in bear market territory. Along with energy and health care, that’s where institutional money has been hiding. Most other sectors have quietly been suffering.
Is the Stock Market About to Bottom?
Outflows Vs. History
Since Aug. 31, eight of 14 sessions produced 100+ outflows. That’s the biggest cluster of extreme selling since the March capitulation. Back then, a similar bout ran 12 sessions before the March 20 low that produced 337 outflows and marked the exact bottom.
The S&P 500 was 9% higher a month later.
The Big Money Index now differs from March 20, when the it fell from 65% to 42%. Now the BMI dropped from 69% to 50.7%. That’s still painful, but it’s above the typical bear market threshold. This also might be why the major indexes haven’t cracked yet.
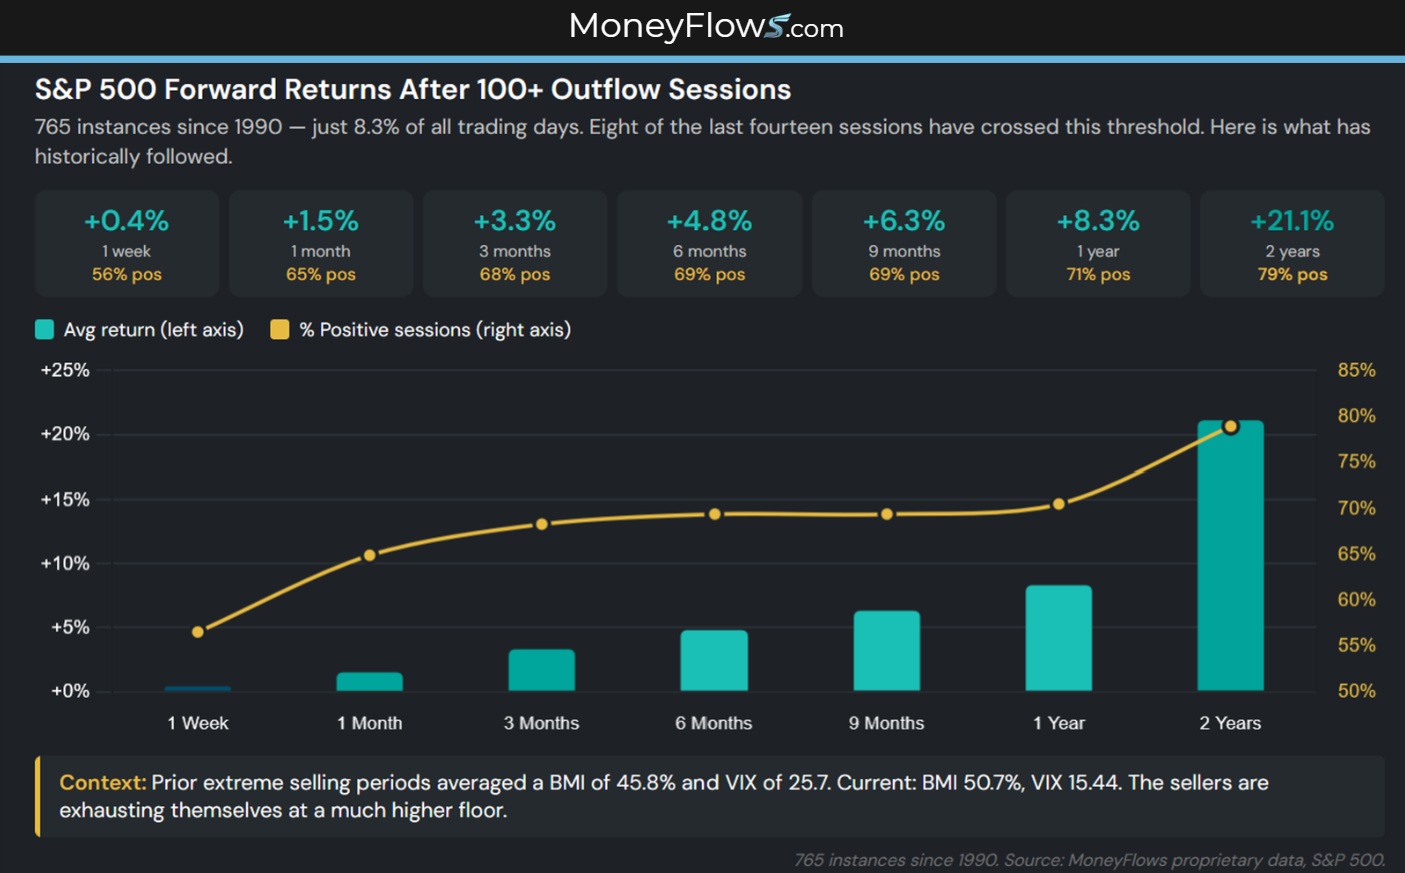
Since 1990, there were 765 sessions with 100 or more institutional outflows, or just 8.3% of all trading days in 36 years. Forward returns are positive at every horizon: one week, one month, three months, six months, one year, and two years.
The two-year average return is 21.1% with a 79% win rate. The pain has always been temporary and recovery has always followed.
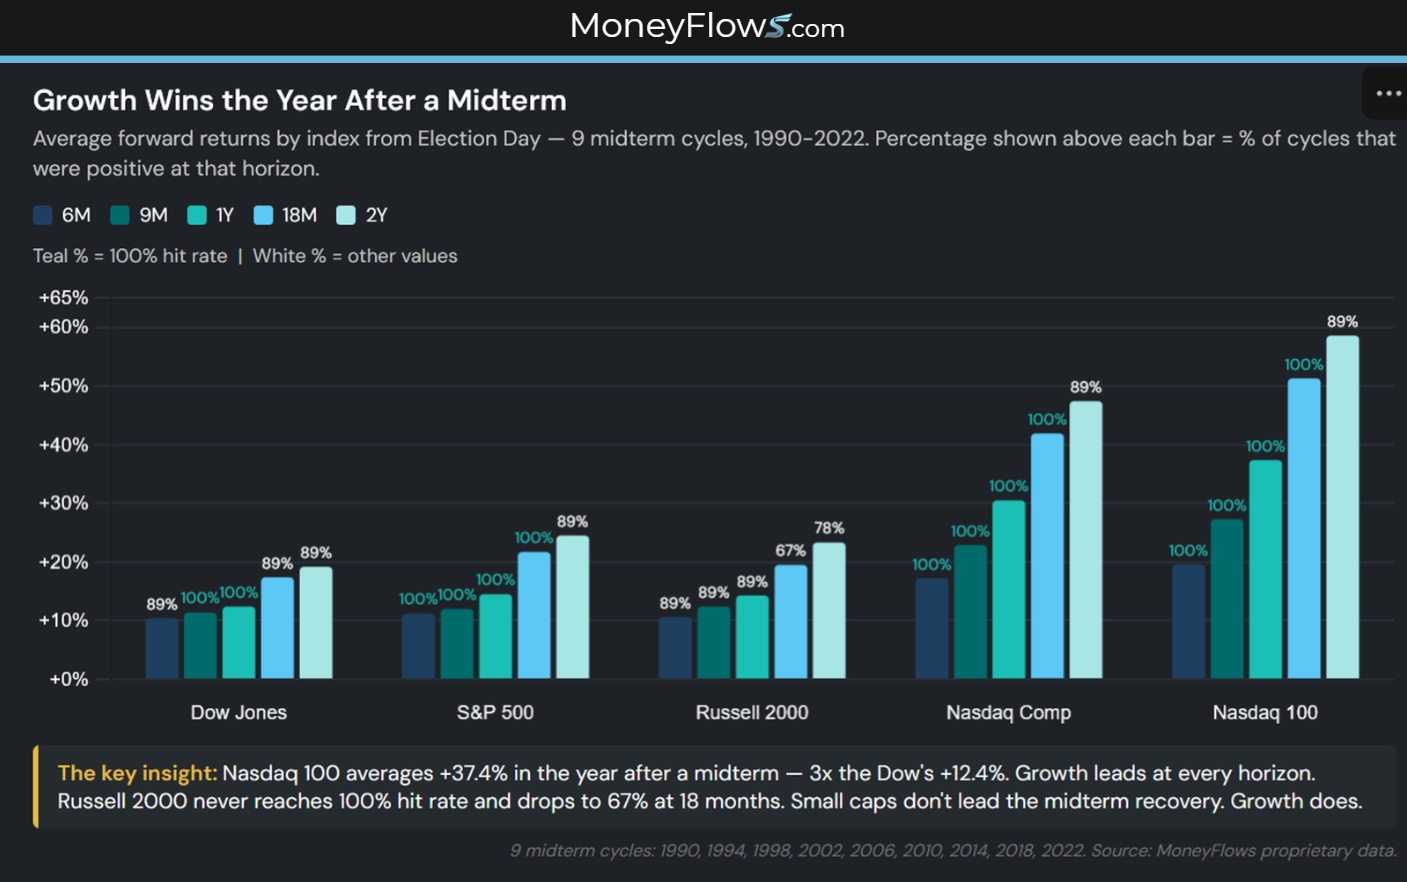
History also shows what comes back fastest. Across nine midterm cycles since 1990, the Nasdaq 100 averaged 37.4% in the year following Election Day, which is more than double the Dow’s 12.4% and well ahead of the S&P 500’s 14.5%.
Growth leads the recovery every time. The stocks most beaten up today – mid-cap, rate-sensitive, and fundamentally sound – snapped back hardest when midterm uncertainty cleared. Growth leads and it’s not even close:
The October Turn
Roadmap
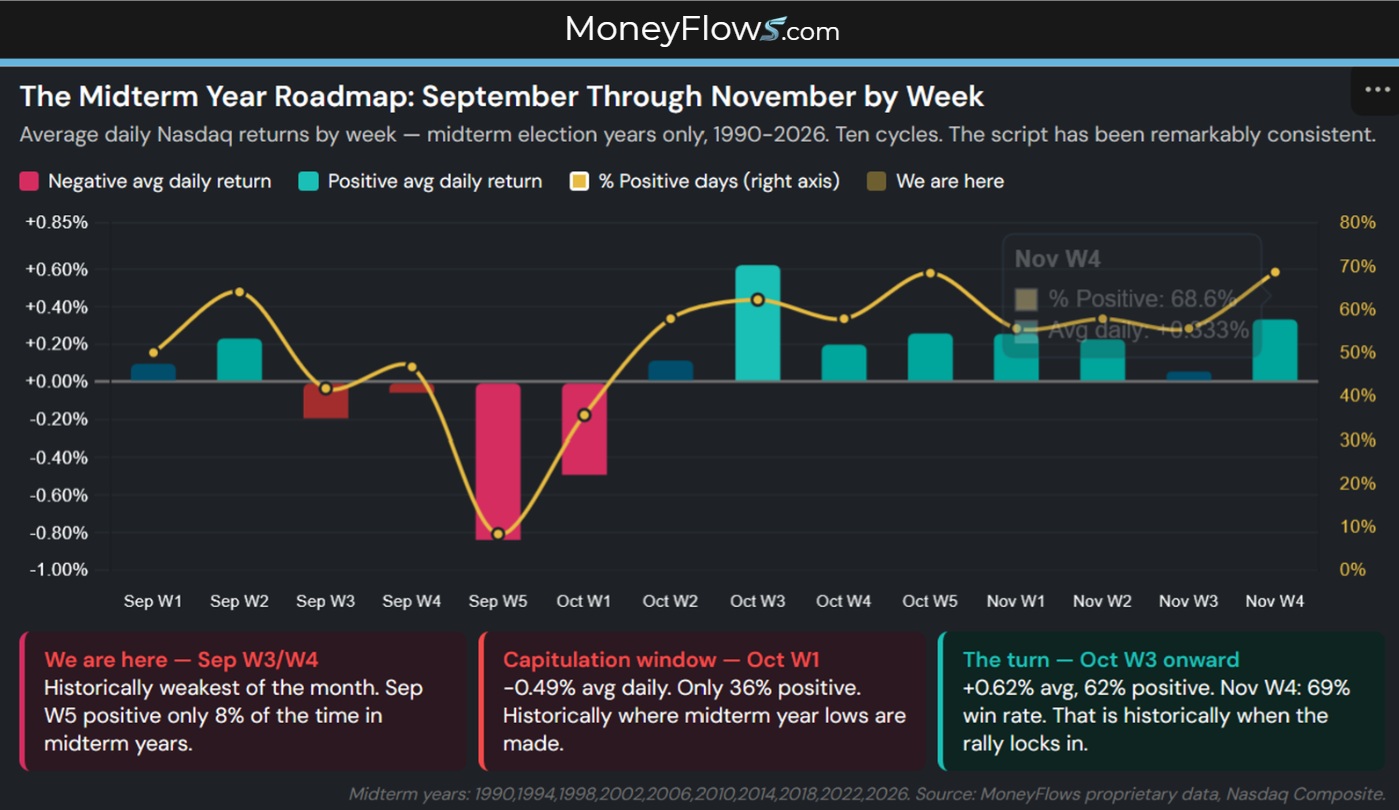
Our 36 years of daily data shows which weeks carry the most weight in midterm years. September weeks three and four are the weakest, with negative average daily returns and less than 47% positive days. We are in that window now.
October’s first week is historically the worst of the month at a -0.49% average daily return with positive outcomes occurring only 36% of the time. That is typically where midterm year lows are made.
October’s third week is the strongest. It averages a daily return of 0.62% with a 62% rate of positive outcomes. The turn happens fast. November in midterm years has been positive across all four weeks, with week four averaging a 69% win rate. That is historically when the rally locks in.
Political Overhang
Prediction markets now price Democratic Senate control at 60% on Polymarket and 55% on Kalshi. It’s the first time Democrats have led this race on either platform. A year ago, Republicans were above 80%.
Take these numbers with a grain of salt, though. Polymarket gave the next pope a 0.3% probability just minutes before he was announced. A 60% reading seven weeks from Election Day is a market expectation, not a verdict.
What matters for markets is not who wins, but that nobody knows yet. Uncertainty is what Wall Street prices (and hates). Resolution is what historically unlocks the Q4 rally.
Flows
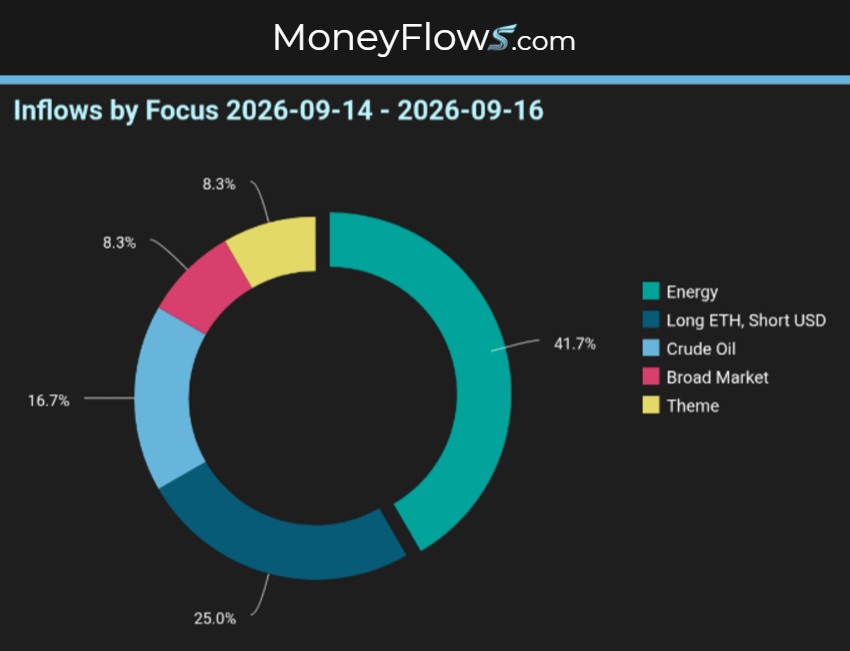
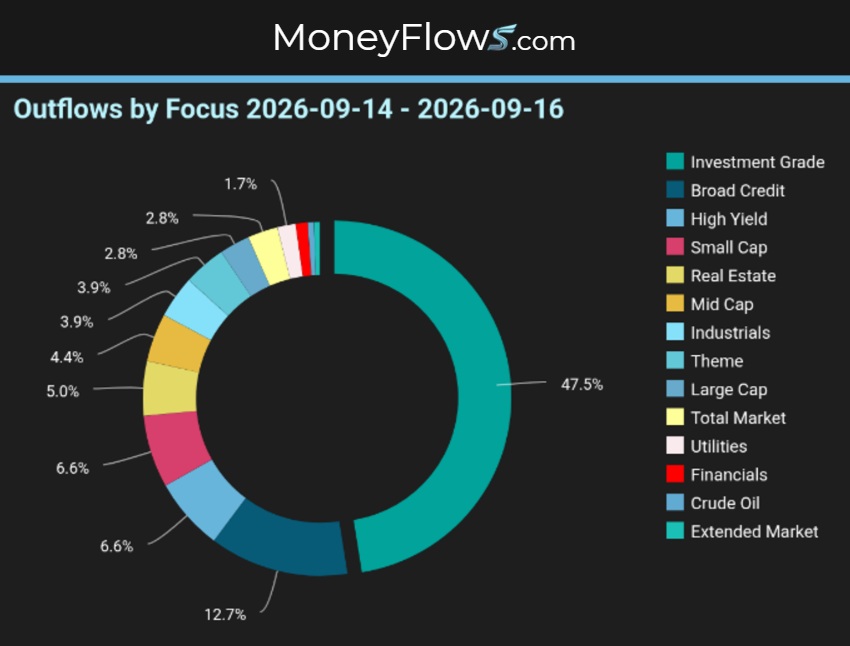
Energy was the only positive sector this week, marking its second straight week as the sole buyer. Eight of 14 sessions since Aug. 31, had 100-plus outflows. The sellers are everywhere. They are getting tired.
More than 120 fixed income exchange-traded funds saw outflows. Over 60 equity ETFs were sold. Only energy, cybersecurity, cryptocurrency, and mega-cap tech attracted buyers. The market is not rotating. It is sheltering.
When Does It End?
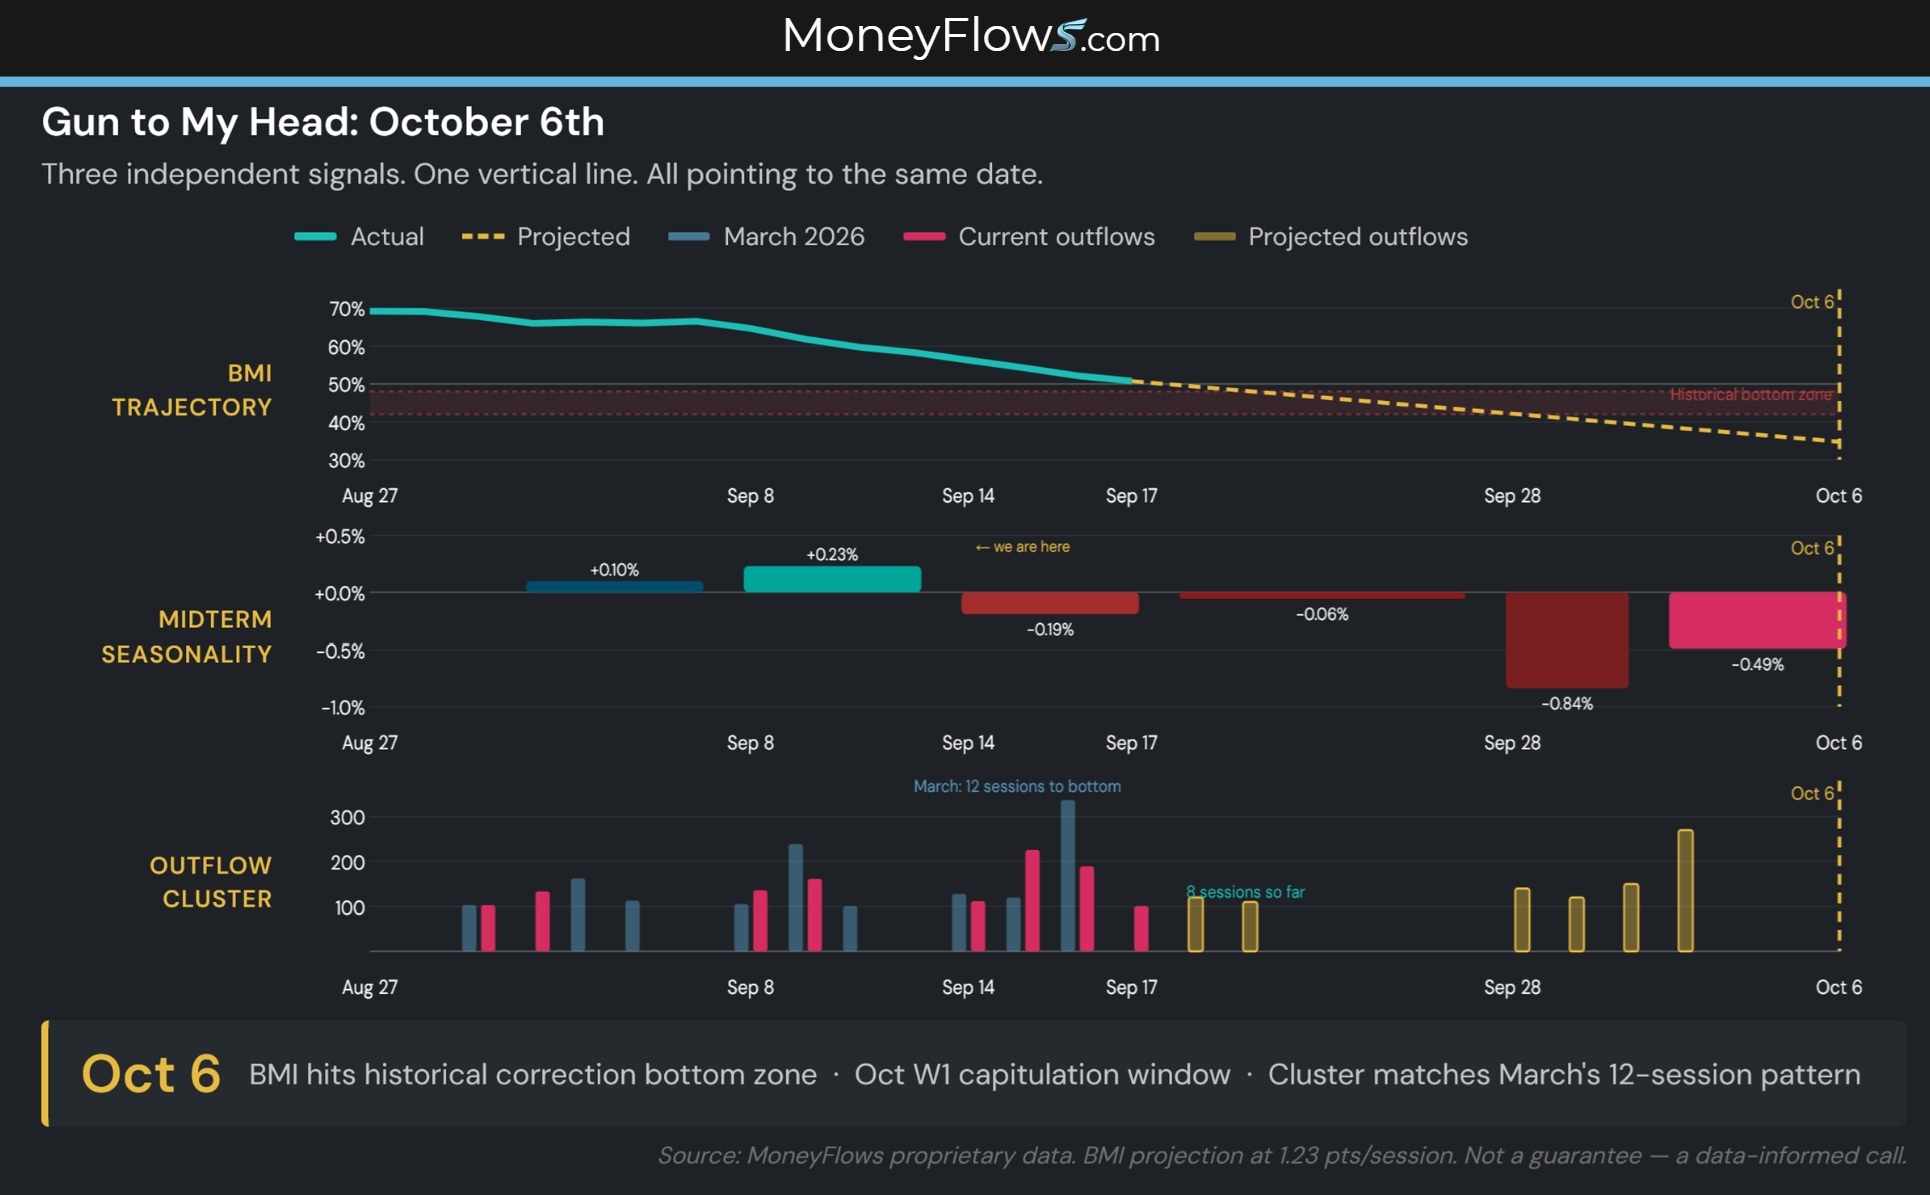
Forced to choose, I pick October 6th.
Three independent signals converge.
The BMI is dropping roughly 1.5 points per session. At that pace it hits the 42-48% zone where prior mid-bull corrections have bottomed (including on March 20) around the first week of October.
Over three decades of seasonality say October’s first week is the worst of a midterm year. It’s when lows happen.
The current cluster of 100-plus outflow days is at eight sessions. The March cluster ran 12 before the exact bottom.
All three point to the same two-week window. Oct. 6, is a Tuesday. The market opens, the sellers finish. The instruments say that is where this ends. Sorry wife (it is our anniversary).
Purkinje Moment
Eyes adjusting in the dark is temporary. When light normalizes, regular vision returns and colors come back.
The hidden bear is real. The breadth damage is real. The oil shock, rate pressure, and political uncertainty are real. And they’re happening during the historically most volatile stretch of the four-year presidential cycle.
History says October week one is the capitulation window. October week three is where it flips. November is when patient money gets paid.
As Epictetus wrote, “We cannot choose our external circumstances, but we can always choose how we respond to them.”
The data is the response. It knows where this goes.
MoneyFlows finds the winners early…bringing them to you.
If you’re a serious investor or money manager, get started NOW.
Our PRO subscription allows you to spot daily flows and access our weekly Outlier 20 report.
This is the report that has found EVERY SINGLE ONE of our Outlier stocks.
Enjoy a click-through experience unlike anything out there.
Professional money managers and RIAs looking for additional portfolio solutions including ETF flows & ranks and your own Portfolio Tracking tools, please reach out about our Advisor Solution and Emerging Advisor Program.
Have a great week!
***Lastly, join me LIVE, October 5-7, 2026, at the MoneyShow TradersEXPO in Orlando.
You don’t want to miss this! Click the image below to reserve your spot.