
Did the Stock Market Bottom? Follow the Big Money Index
by Jason Bodner All, Big Money Insights Weekly, StocksWhen the days get longer, the cold gets stronger.
The shortest day of the year is Dec. 21, but it’s not the coldest – not even close.
East of the Rockies, the coldest stretch usually shows up about a month later. Land, air, and water hold on to heat, so it takes weeks for the lost sunlight to catch up.
Scientists call this seasonal lag. The sun hides first and the thermometer catches up later.
Markets work the same way. I think we’re very close to the market’s winter solstice right now.
Indexes Never Felt the Cold
If you only watched the headlines, you’d think everything was fine. The S&P 500 sits just 1.7% below its August high. The Nasdaq 100 is even closer.
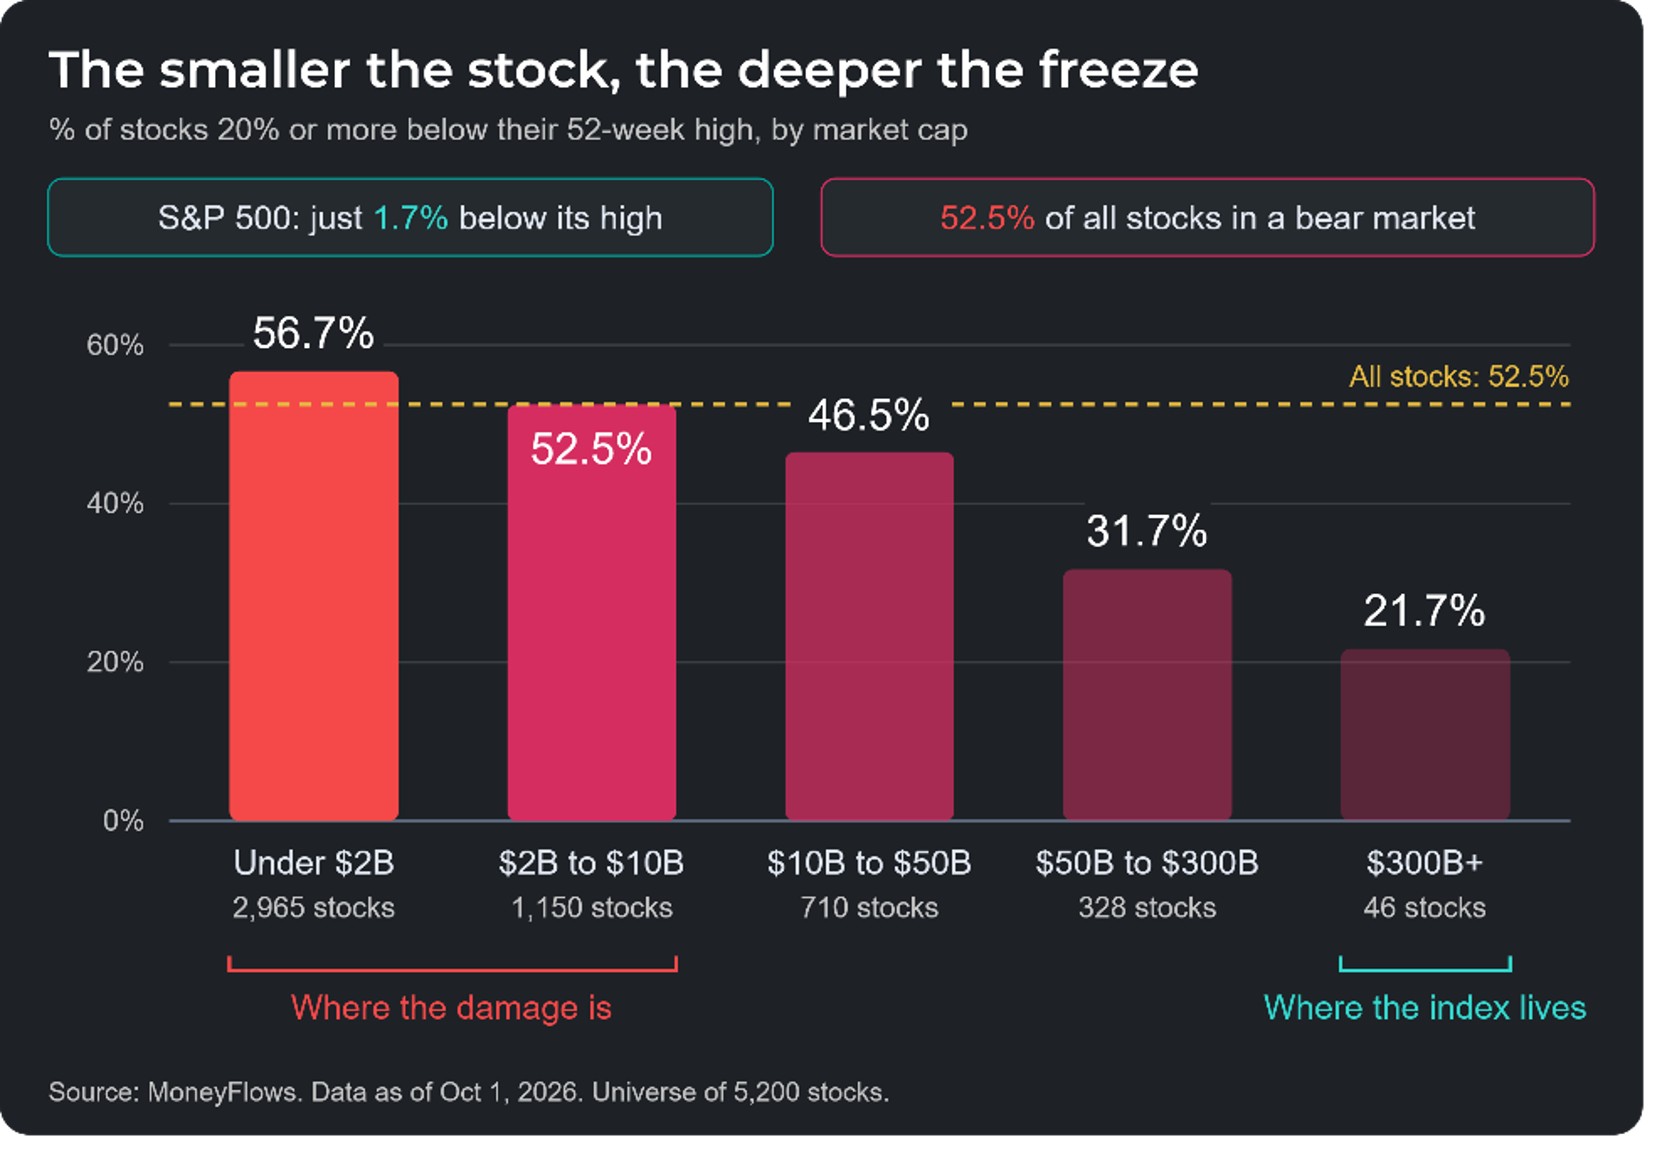
Those are indexes, though. The market underneath tells a different story. The Russell 2000 is 8.5% off its high. Of the 5,000+ stocks we track, 52.5% sit 20% or more below their highs. More than half of all stocks are in a bear market.
The smaller the company, the worse it gets. Among stocks under $2 billion, 57% are in a bear market. For giants worth over $300 billion, it’s just 22%. A handful of huge names are holding up the index while everything underneath freezes.
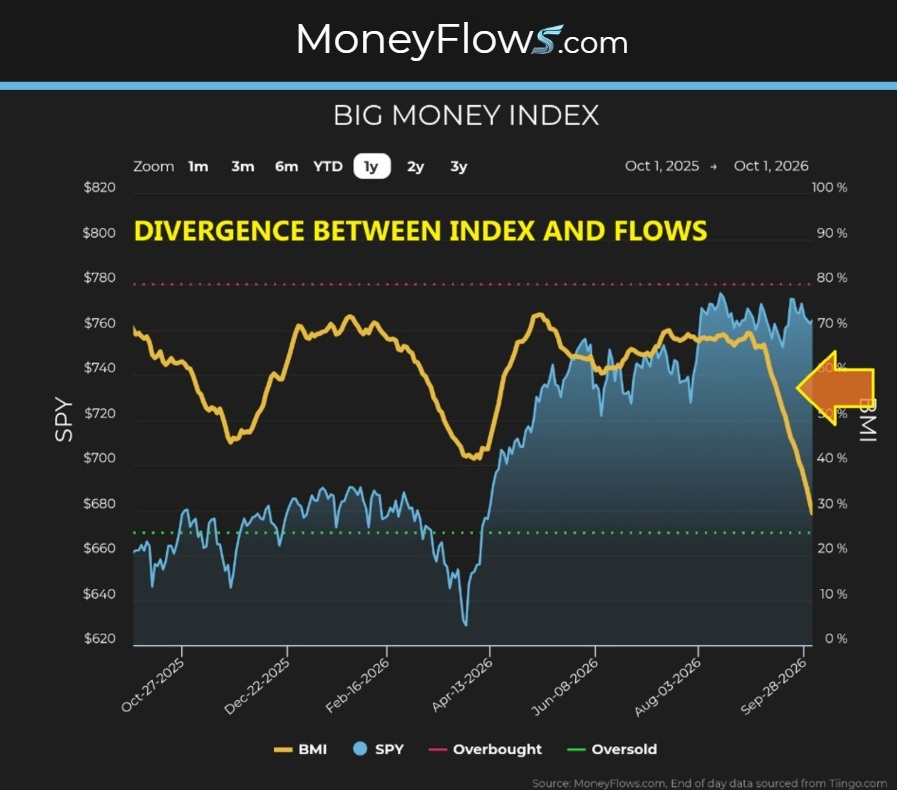
The Big Money Index (BMI) sees it too. It tracks buying versus selling. Above 80% is overbought and below 25% is oversold. On Thursday it hit 29.3%. Since 1993, the BMI has never been below 30% with the S&P this close to a record. The CBOE Volatility Index (VIX) fear gauge is at just 16.
All the pain is in the stocks.
Selling Hit a Rare Extreme
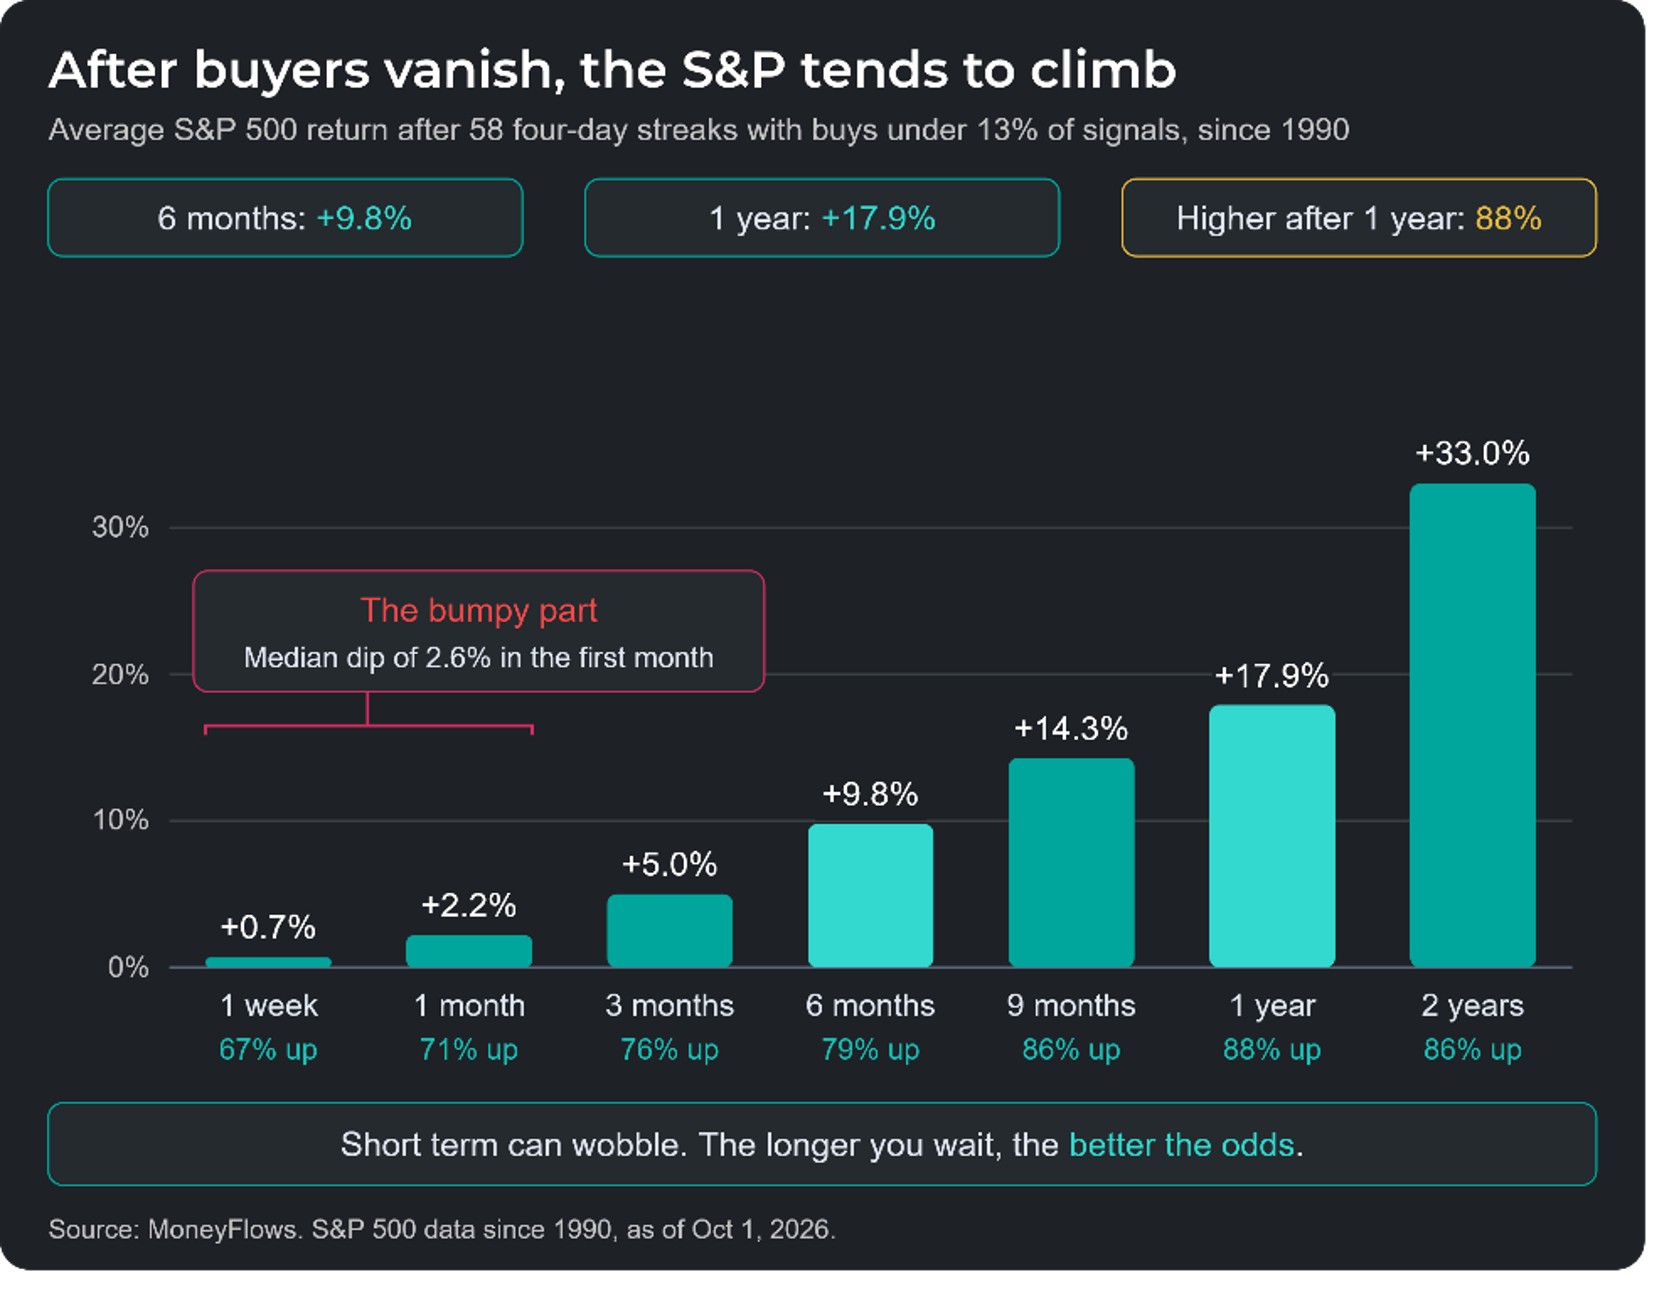
This week, buying nearly dried up. For four straight days, inflows were less than 13% of all signals. We’ve seen 58 streaks like that since 1990. The S&P 500 was never this close to its high during any of them.
What came next was strong. Six months later, the S&P 500 averaged a 9.8% gain. A year later, it averaged 17.9% and was higher 88% of the time. The weeks right after can still be bumpy, though.
Exchange-traded funds told the same story, with 100 or more outflows four days in a row. That ties the record. It happened only three other times: December 2018, September 2022, and April 2025. All three came at or near major lows. A year later, the S&P 500 was up between 20% and 40% each time.
Sector Spotlight: The Last Shelter Cracks
All sectors had net outflows this week. Last week, technology was the lone exception.
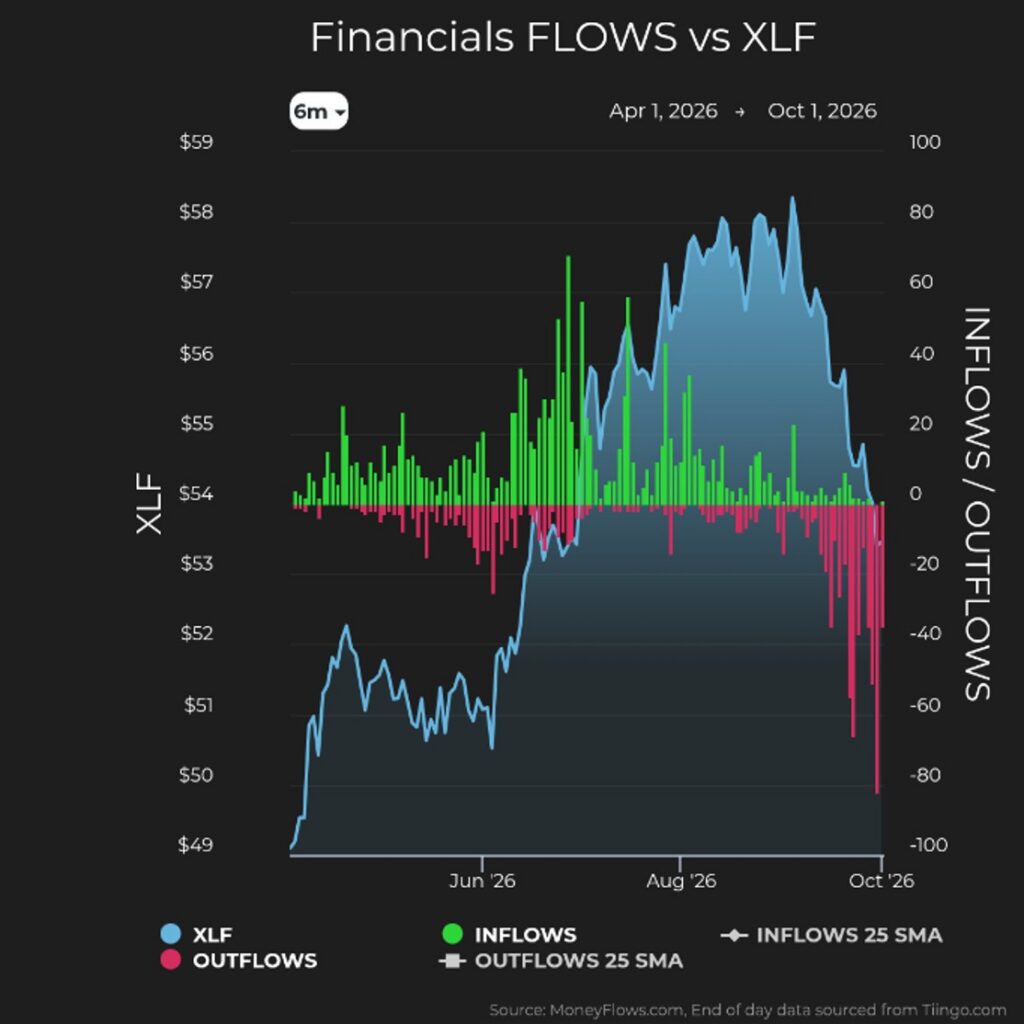
Financials got hit hardest, with 203 outflows and just 3 inflows. Banks alone saw 100 outflows with no inflows. Financials have been the market’s hiding spot. They have the fewest stocks in a bear market of any sector, and the most near their highs. Now that last safe spot is getting hammered too.
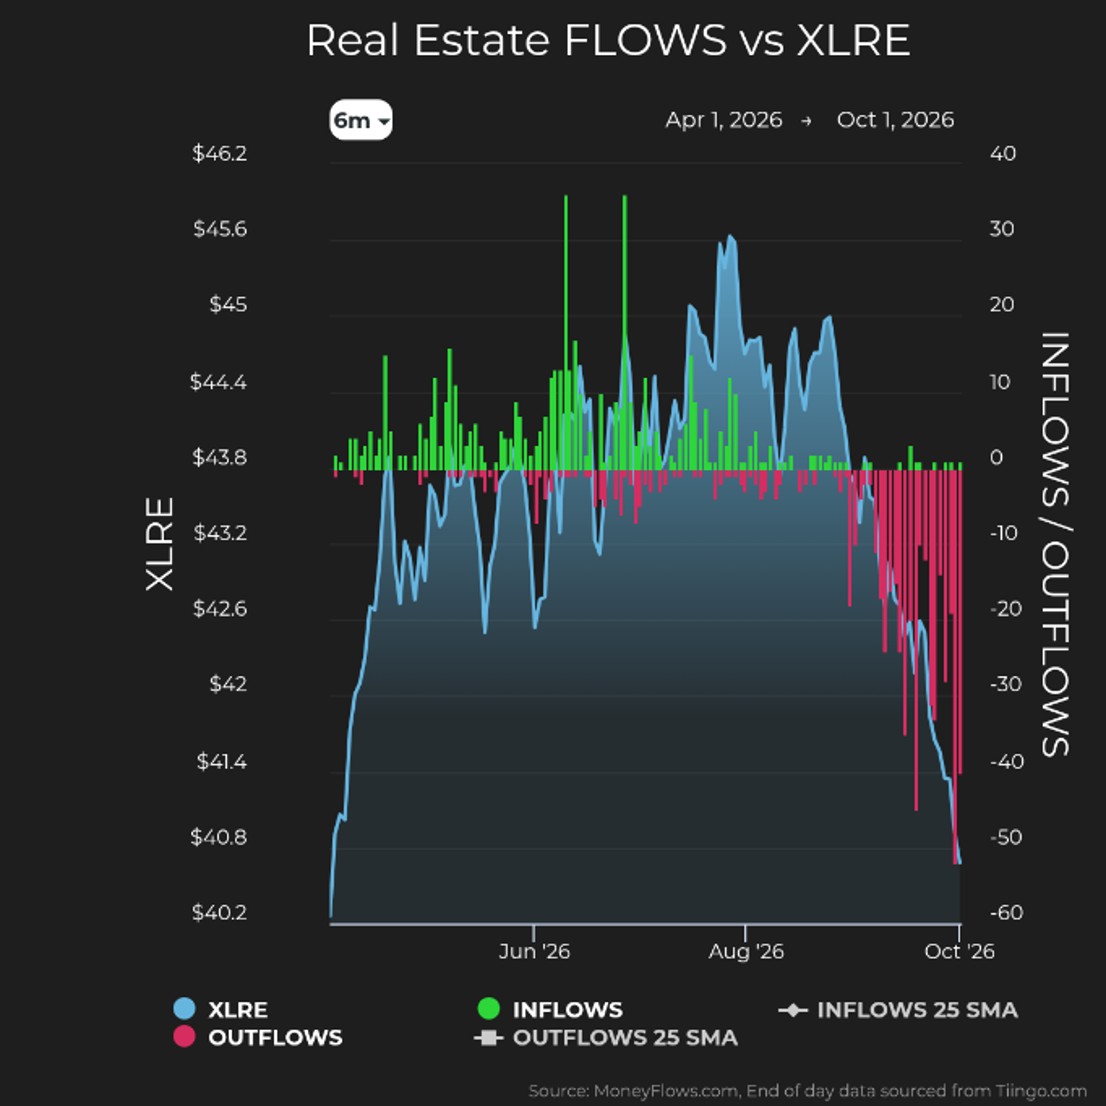
Real estate came next with 139 outflows – nearly all REITs. Hotels, restaurants, and leisure stocks saw 47 outflows and zero inflows. Dividend payers still foot the bill. The median stock sold pays a 2.4% yield. The median stock bought pays nothing.
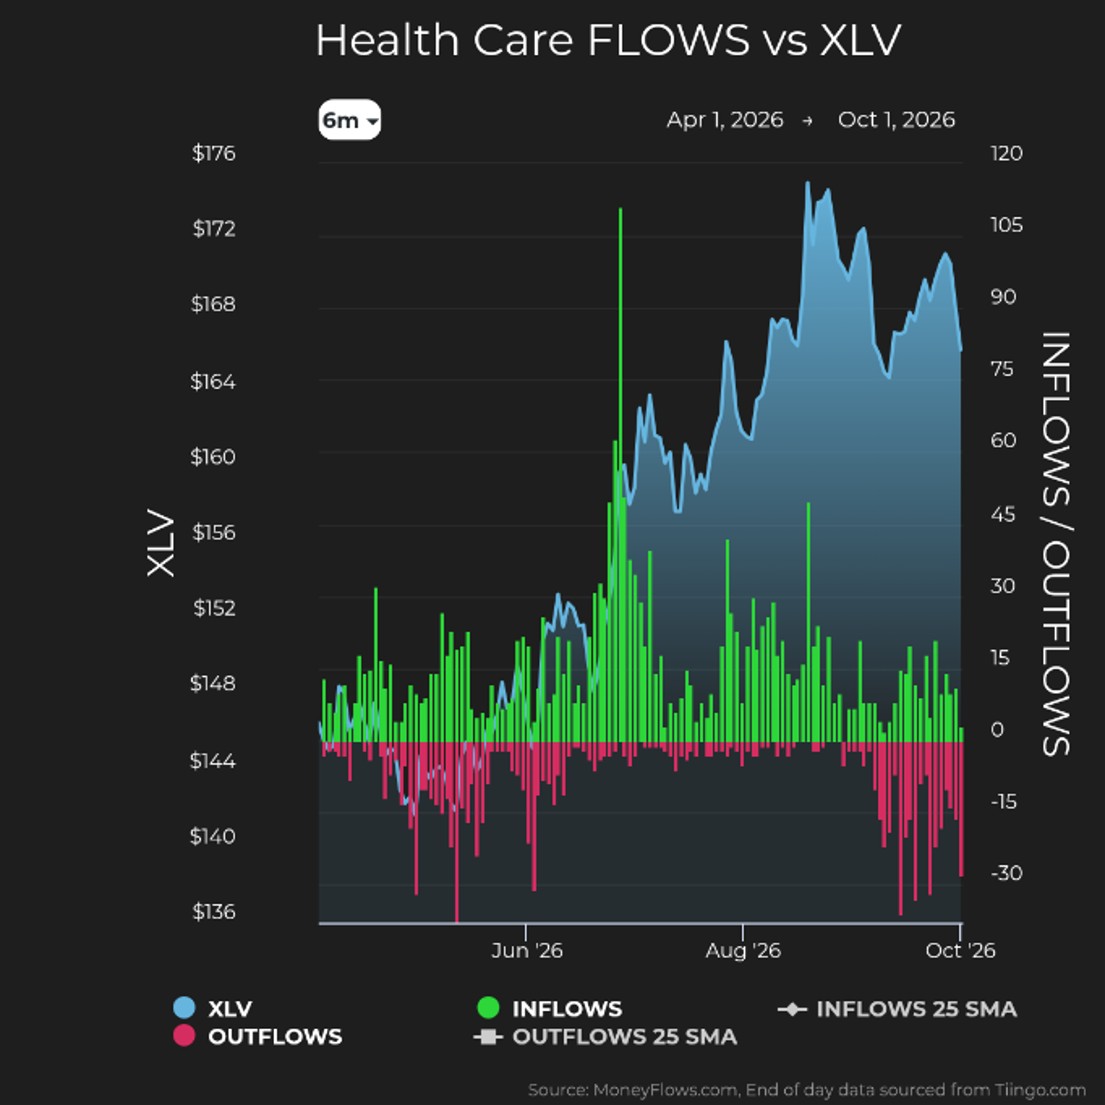
So, where’s the money going? Health care led all sectors with 38 inflows (mostly lab tools and genetic testing names).
Then there’s AI.
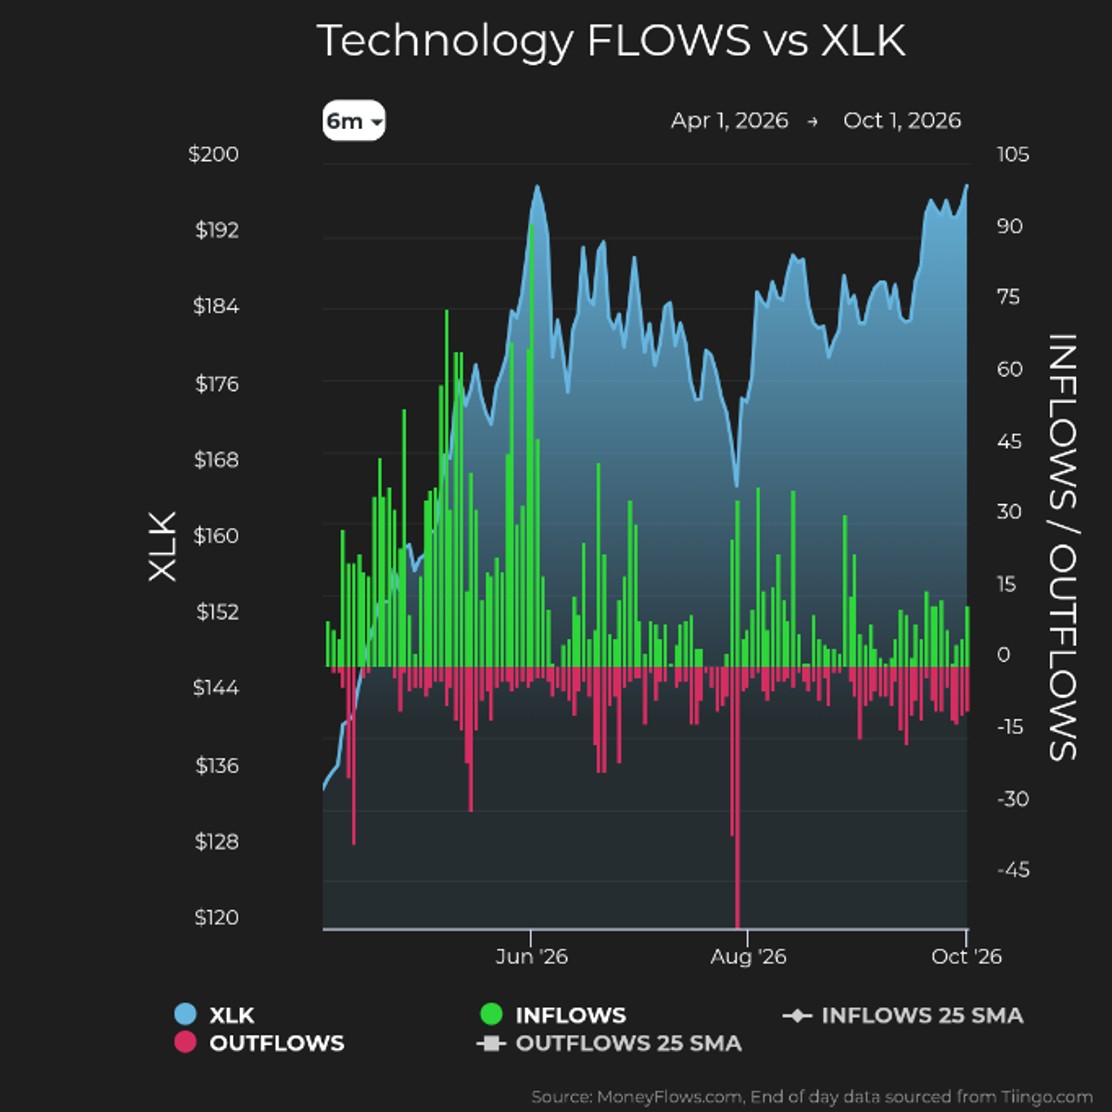
Since the July and August lows, smaller tech stocks worth $1 billion to $50 billion are up a median 18%. Similar-sized stocks outside tech are up just 3%. Chip equipment makers lead the way, up 28% from their lows. Big Money kept buying these names even during this week’s flush. Still, 64% of these smaller tech stocks are in bear markets, so they have plenty of room to run.
Has Peak Rate Fear Passed?
Much of this comes back to interest rates. Investors spent September worried the Federal Reserve might hike again.
This week, that worry slammed the bond market. Bond ETFs saw 250 outflows in four days, which was more than stock ETFs. Long-term Treasury funds got sold every single day. The only bonds bought were cash-like, short-term funds.
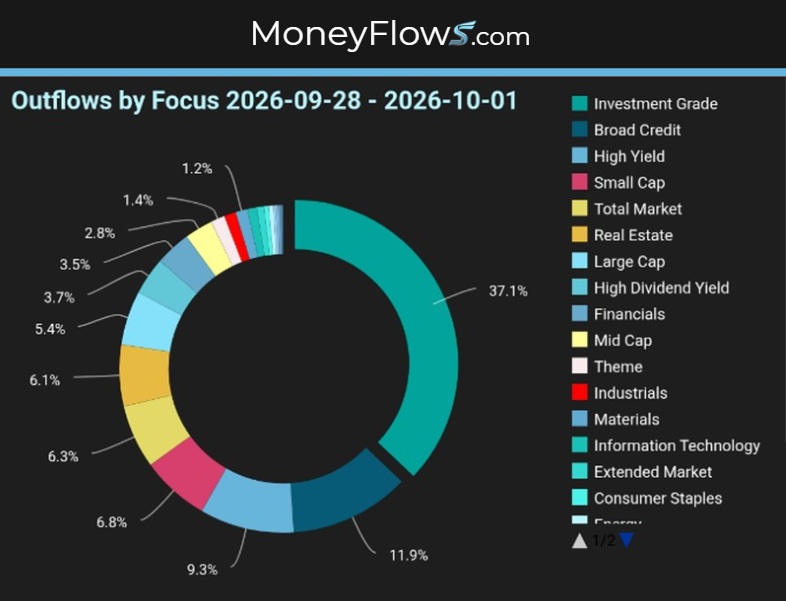
When investors dump long bonds this broadly, rate fear is often close to peaking. Friday’s weak jobs report adds to that case. It’s hard for the Fed to hike into a soft job market.
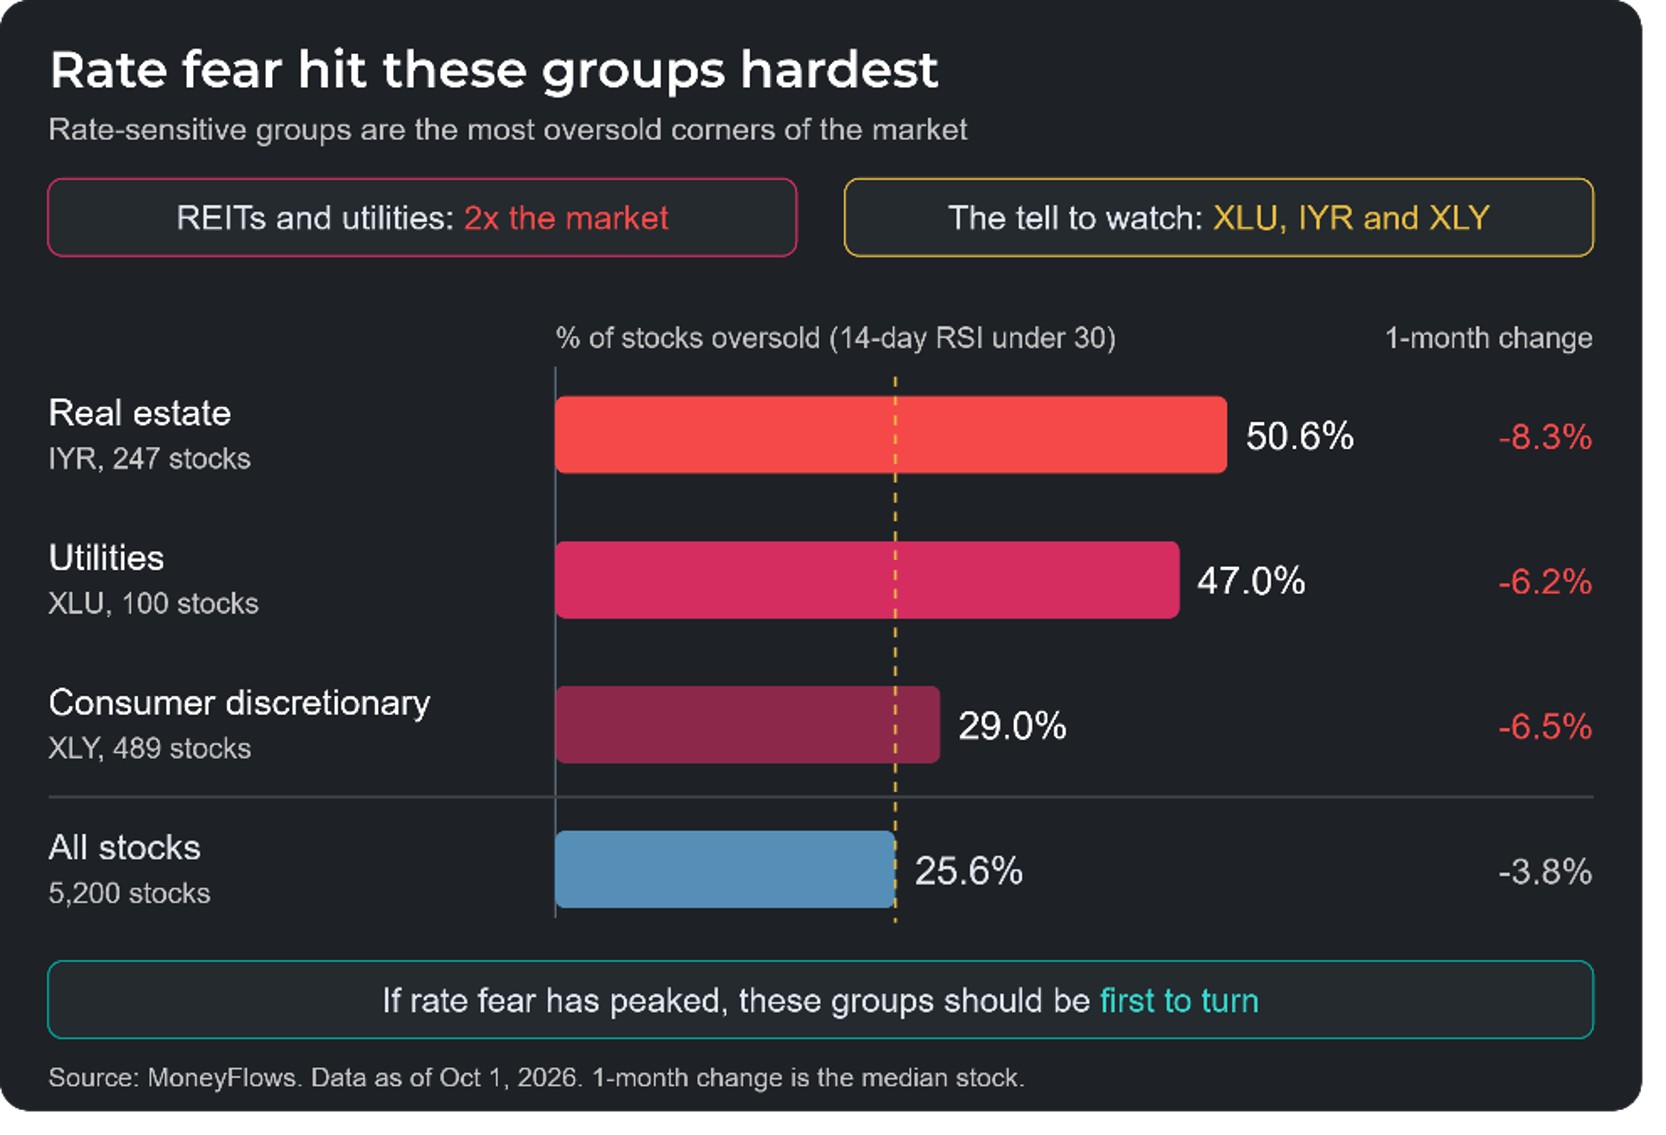
If rate fear has peaked, we’ll see it first in the groups hurt most by high rates. Utilities and real estate are both yielding sectors sensitive to rates while discretionary is sensitive to consumer spending with constrictive rates. About half of all REIT and utility stocks are technically oversold, roughly double the rate for the overall market.
When the selling in these groups dries up and buying shows up, that’s our tell.
Did the Stock Market Bottom? Follow the Big Money Index.
The Low Usually Comes First
Back to seasonal lag. The BMI is a 25-day average, so it lags by design. It keeps getting colder after prices have already turned.
At its current pace, the BMI should reach oversold around Oct. 6. It could keep falling for another week after that.
History says not to wait for it, though. In 12 oversold episodes since 1990, the S&P 500’s low came within a week of the BMI’s low. In all 12, the S&P 500 bottomed first. Once the BMI hit bottom, the S&P 500 had usually bounced about 2%.
That puts a likely low for the market underneath around Oct. 6-14. It also lines up with the midterm election calendar. Since 1990, seven of nine midterm-year fall lows landed between Oct. 2 and Oct. 15.
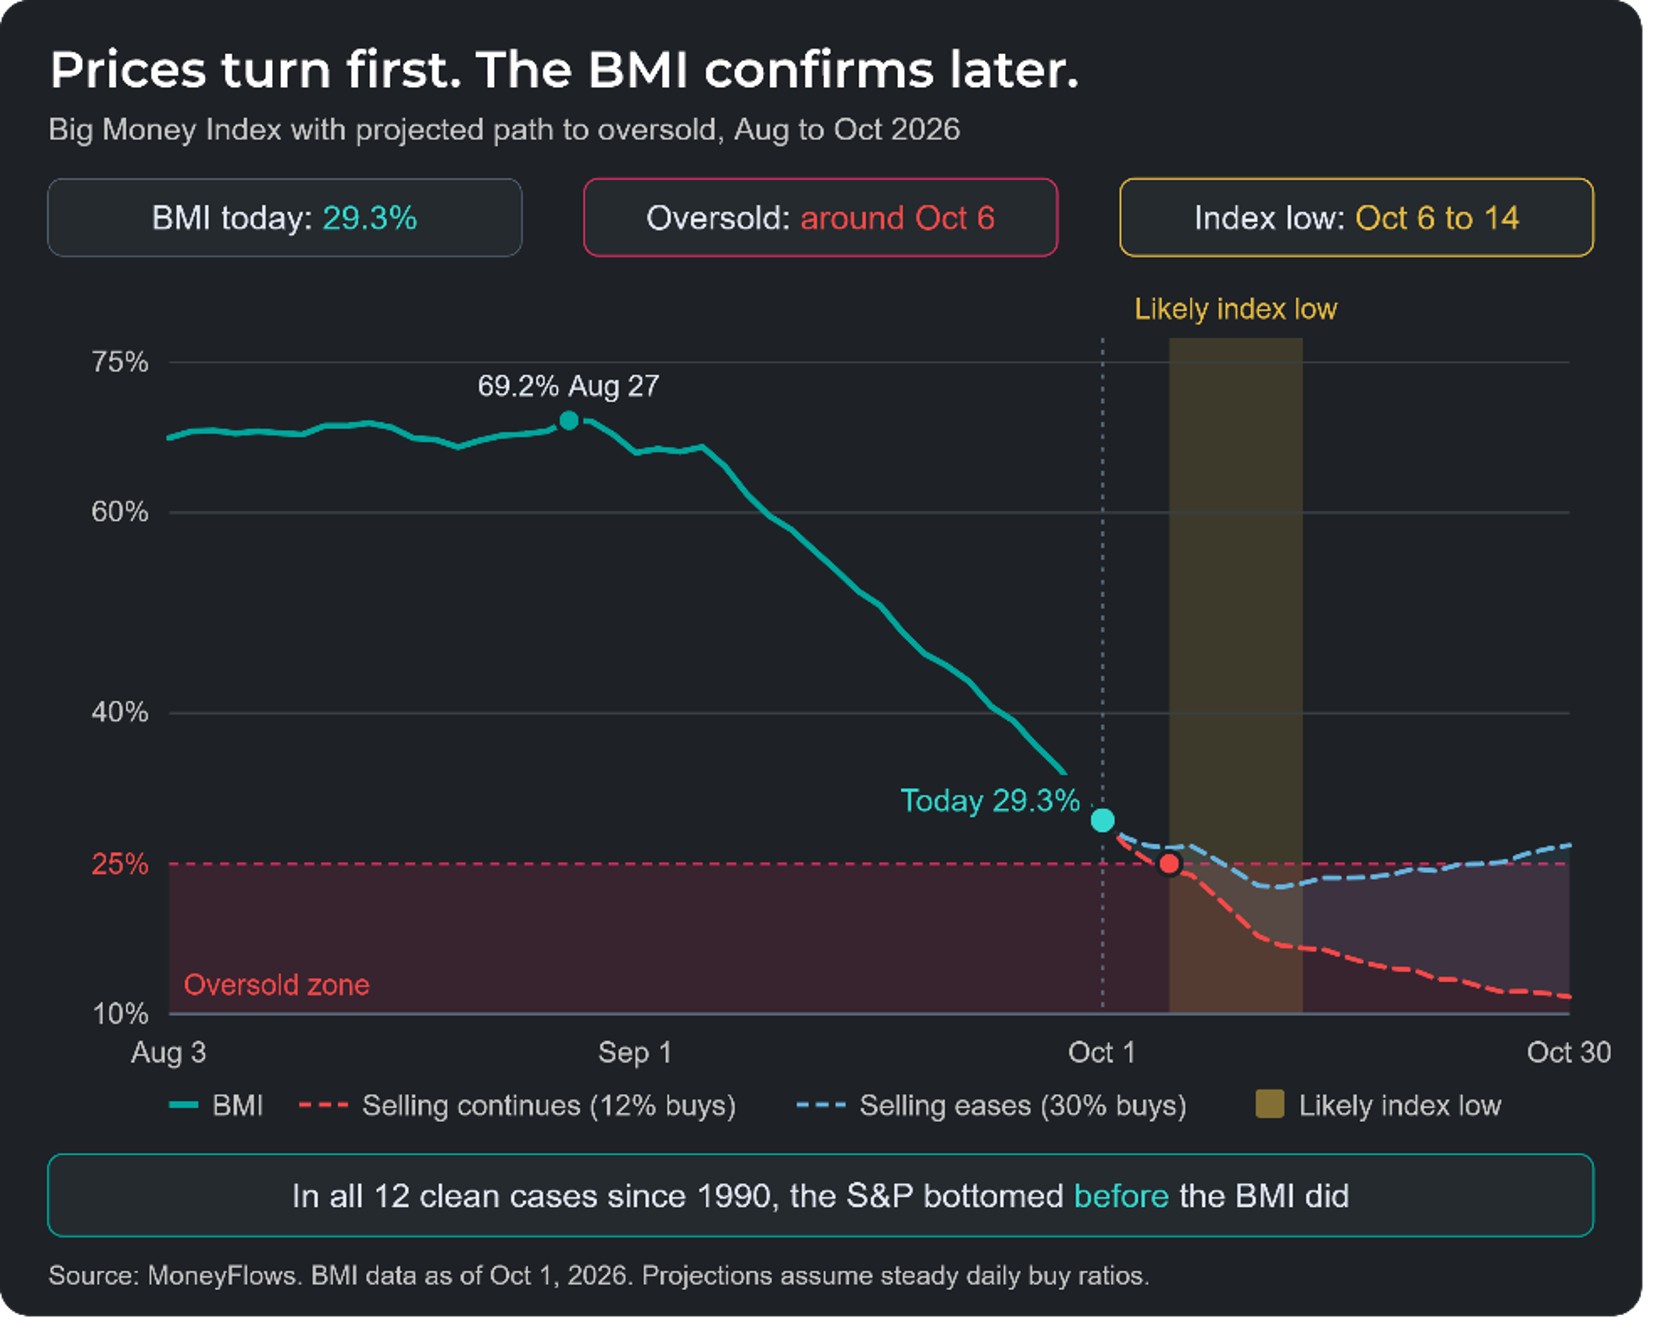
There’s one warning. In 2018, the S&P 500 also sat near a high when the Big Money Index went oversold. It still fell another 11% into December as the Fed kept hiking. That’s why rates are the key this time. If peak rate fear is behind us, history leans toward a quick finish.
The surface index never felt the cold. The market underneath took all of it. But the days are already getting longer, and the turn usually shows up before anyone sounds the all-clear.
As writer Hal Borland penned, “No winter lasts forever; no spring skips its turn.”
MoneyFlows finds the winners early…bringing them to you.
If you’re a serious investor or money manager, get started NOW.
Our PRO subscription allows you to spot daily flows and access our weekly Outlier 20 report.
This is the report that has found EVERY SINGLE ONE of our Outlier stocks.
Enjoy a click-through experience unlike anything out there.
Professional money managers and RIAs looking for additional portfolio solutions including ETF flows & ranks and your own Portfolio Tracking tools, please reach out about our Advisor Solution and Emerging Advisor Program.
Have a great week!
***Lastly, join me LIVE, Nov. 30 – Dec. 2, at the MoneyShow Masters Symposium Sarasota, FL. I’ll be presenting: Why the Midterm Election Historically Brings Epic Rallies –
And What to Buy Now.
You don’t want to miss this! Click the image below to reserve your spot.