
When The Tide Goes Out
by Lucas Downey All, Big Money Insights Weekly, Special ReportsIt’s a little hard to surf when the tide goes out.
The wave peters out on the shore and recedes back to the sea.
Stocks saw their own version last week. Suddenly investors stopped gleefully scooping up stocks on the gaining momentum.
As we’ve been saying, that crescendo of buying is usually just before a massive shift. Exuberance often quickly turns to pain. We saw that clearly.
The tide of buying receding means our data signals more downside ahead.
They say a high tide lifts all boats. But that can also mean being left high and dry. As an investor, you don’t want to get stranded when the tide goes out.

When The Tide Goes Out Of Big Money
Stock volumes flow like waves. Last Thursday we pointed out how the market was preparing for its Initial Descent. And it was timely: the S&P 500 finished down -5.89% on the day. While some believe the price action came out of the blue, our data painted a different picture.
It told of a shift in big money.
Leading up to last Thursday, volumes suddenly slowed dramatically. Let’s think of big money as waves. Intuitively there will be troughs and crests; ebbs and flows as money moves in and out of markets.
We need to pay attention to those flows.
Let’s dive into the data.
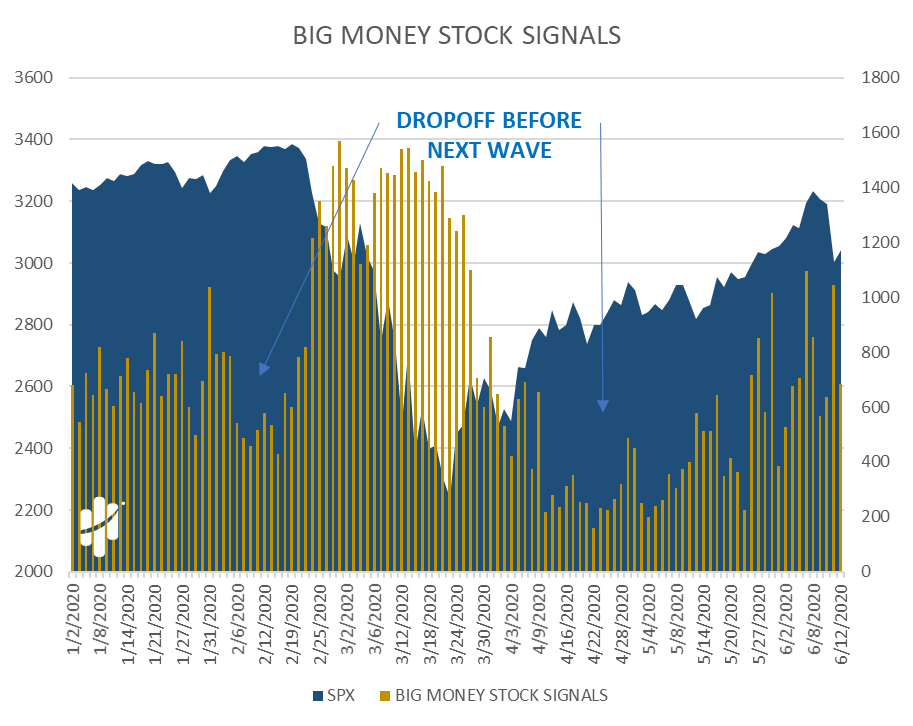
Below, is a chart of Big Money stock signals. To simplify, think of it like unusually big volume. There was a major surge in volume as money gushed out of stocks in March. But notice how just before, there was a drop-off. Like when the tide goes out before the next big wave comes.
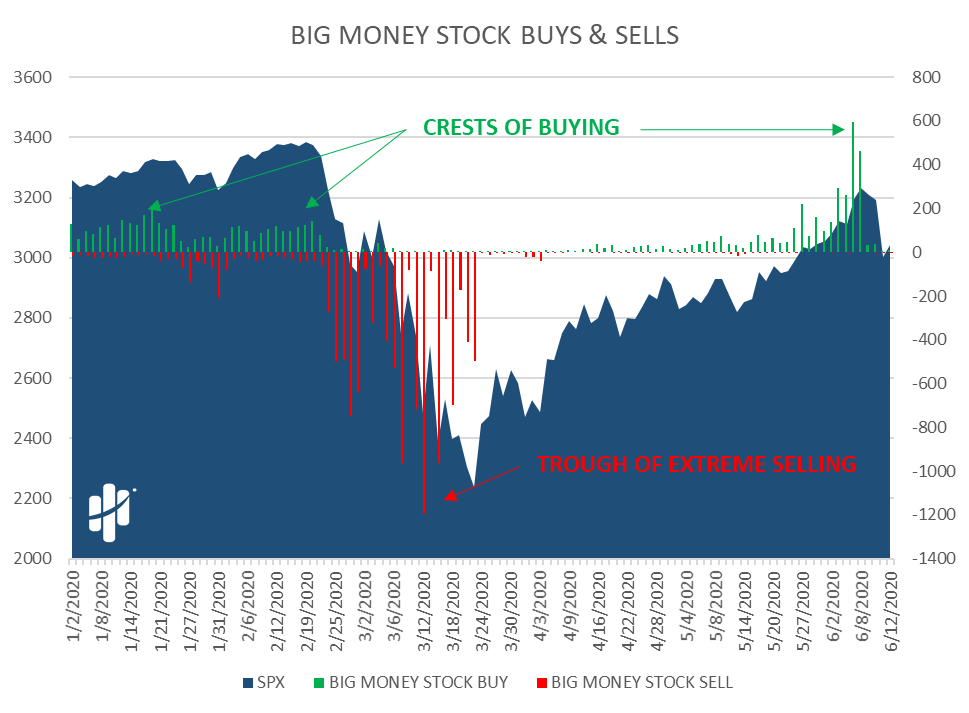
Let’s go further. A subset of big money stock signals are our big money stock buys and sells. These are the signals that tell us if big money is likely moving in and out of stocks in a big way.
When selling hits extremes, bottoms are near. When buying hits extremes, (like now) tops are often near.
Big money usually crests before the market pulls back:
But, stocks aren’t the only waves we look at.
ETF Volumes Flow Like Waves
Let’s do a similar exercise with ETFs. For 2 weeks, we’ve pointed out how when ETF buying gets nuts you need to be careful. We said that we were likely in the final laps of this wave of buying in our post, Record Breakers.
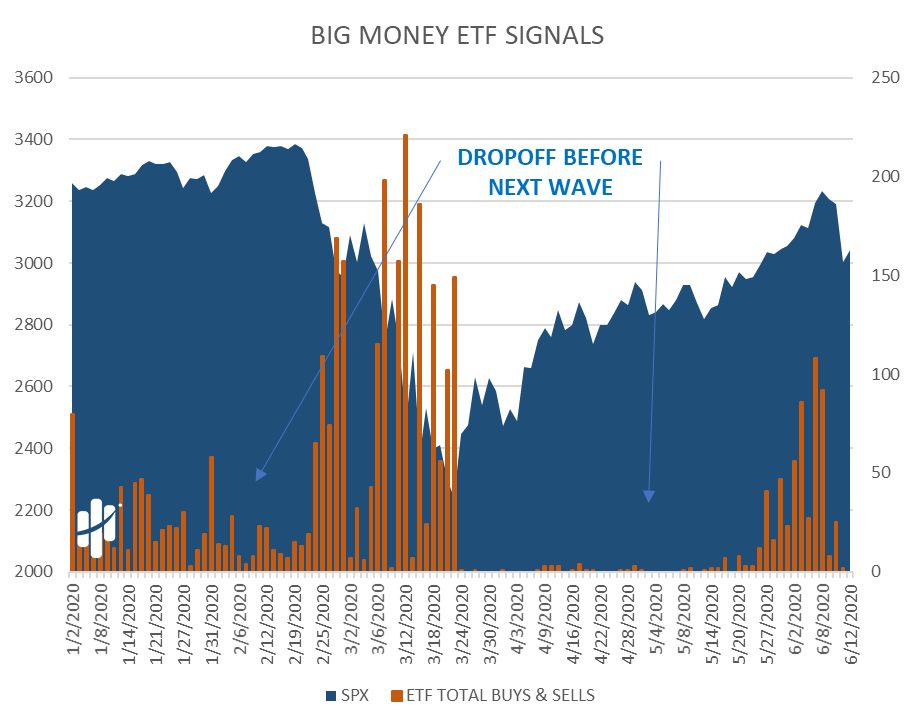
Once again, the underlying wave troughed and crested in advance of the market bottom and top.
Below are the big money ETF signals. Think of them as the total number of ETFs making buy and sell signals on unusually large volumes:
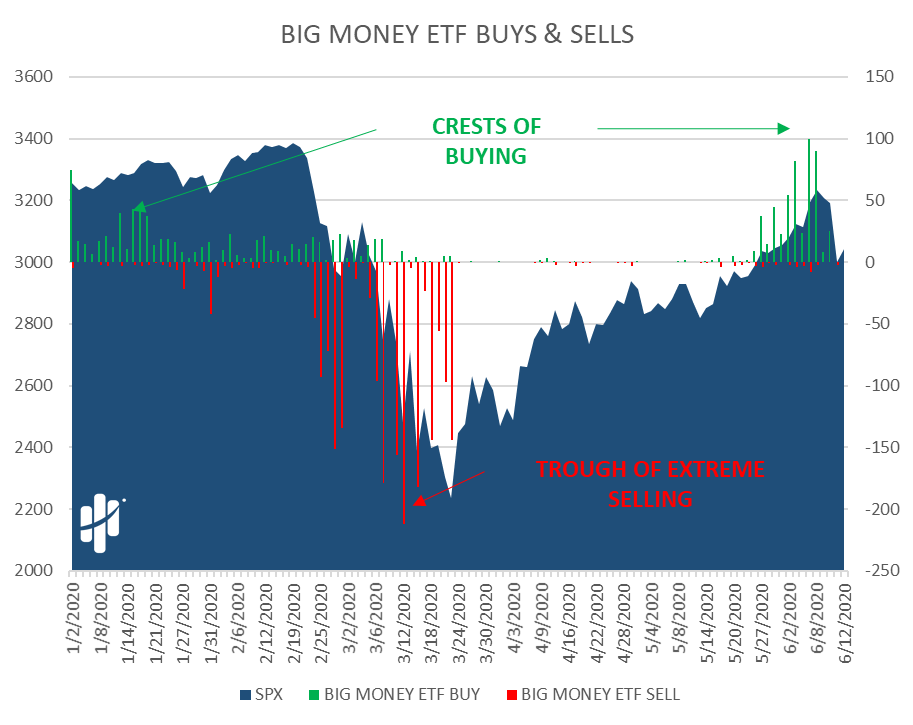
Now, let’s break out the big money ETF signals as buys and sells. These are the signals that tell us if big money is likely moving in and out of ETFs.
Again: big money crests before the market pulls back:
The Phases Of Big Money
To make it even clearer, we actually visualize money flows as waves. Why? Because money flows in phases. It moves from one extreme to the other like water sloshing around in a tub.
But it does so in a measurable way.
Over the last month, we’ve seen nothing but massive buying. No selling. While it can be a little scary because we all know what goes up must come down, that’s still like the investing bonus level. Eventually however, buying slows and selling begins to match buyers.
Here’s how we visualize the phases of big money:
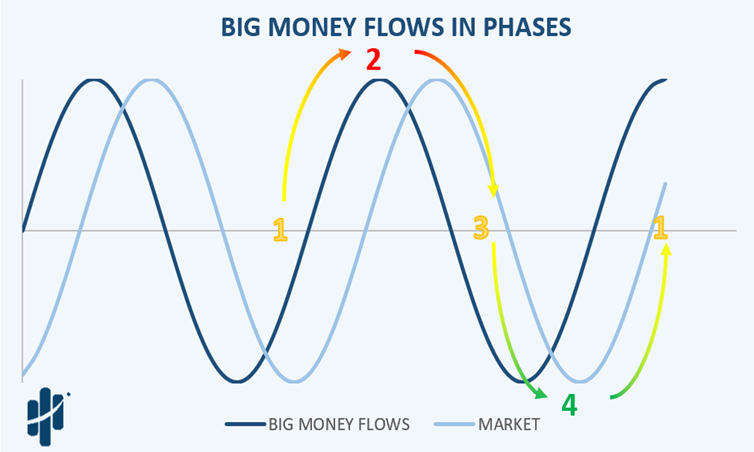
For weeks we were in phase 1, now we are approaching phase 2. The phases work like this:
- Huge buying and very little selling – (think FOMO)
- Buying slows and selling picks up – (usually near a peak)
- Buying slows further and selling begins to take over – (a pullback has begun)
- Buying is gone, and sellers are in control – (think bear markets and scary headlines)
Phase 2 has begun, so the tide looks like it’s going out.
Bottom line: there is a new narrative in our data. It says to be careful. While pullbacks can take time to play out, planning ahead is how you win.
Don’t get beached.
Our own, Luke Downey, shared his thoughts yesterday on Wall Street Unplugged. Check it out.