

Top Sector this Earnings Season
by Lucas Downey All, Big Money Insights Weekly3rd quarter earnings season is around the corner. This is a great time to read up on your favorite companies and dive into business trends.
Also, quarterly reports give you an eye into a new crop of leaders likely to emerge. Even in bear markets, there’s pockets of green. Today we’ll cover the top sector this earnings season.

If you want to find leading stocks, follow the earnings. Sounds simple right? Well, believe it or not there’s a lot of truth to that statement. There’s a high correlation between stock performance and a company’s earnings.
For proof, back in March, Alec Young showed that since 1992, the S&P 500 index moves virtually in lockstep to its earnings, to a tune of nearly 95%! Clearly earnings matter. And that’s why it’s important to track where earnings are likely to grow.
Today we’ll cover the earnings landscape for the 3rd quarter and focus on the single area expected to grow their bottom lines the most – even in this challenging environment. When there’s opportunity, you can bet institutional investors will be along for the ride… and they have been.
Top Sector this Earnings Season
Alright, let’s first begin by looking at the overall market.
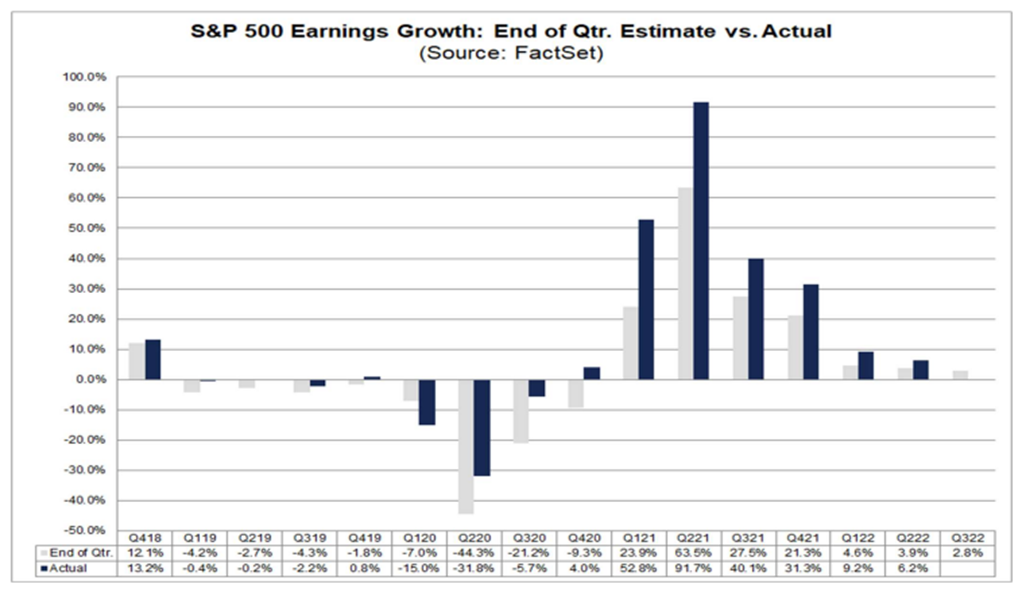
According to FactSet, as of September 30th the S&P 500 is expected to report earnings growth of 2.8% for Q3. Notably, this is well below the 5-year average growth rate of 14.6%.
In the following chart, off to the right, you’ll see Q3’s earnings growth expectations (grey) relative to recent quarters including actual results (blue):
Source: FactSet
Now, as of October 7th, estimates have fallen further to 2.4% growth. Which if that level holds, it’d be the slowest growth in earnings since Q3 2020. That may sound like bad news, but it gets better. Actual earnings tend to crush estimates by a wide margin.
Based on projections of prior earnings positive surprises, there’s reason to believe growth will be in the neighborhood of 6-7%. That’s a much more exciting growth rate.
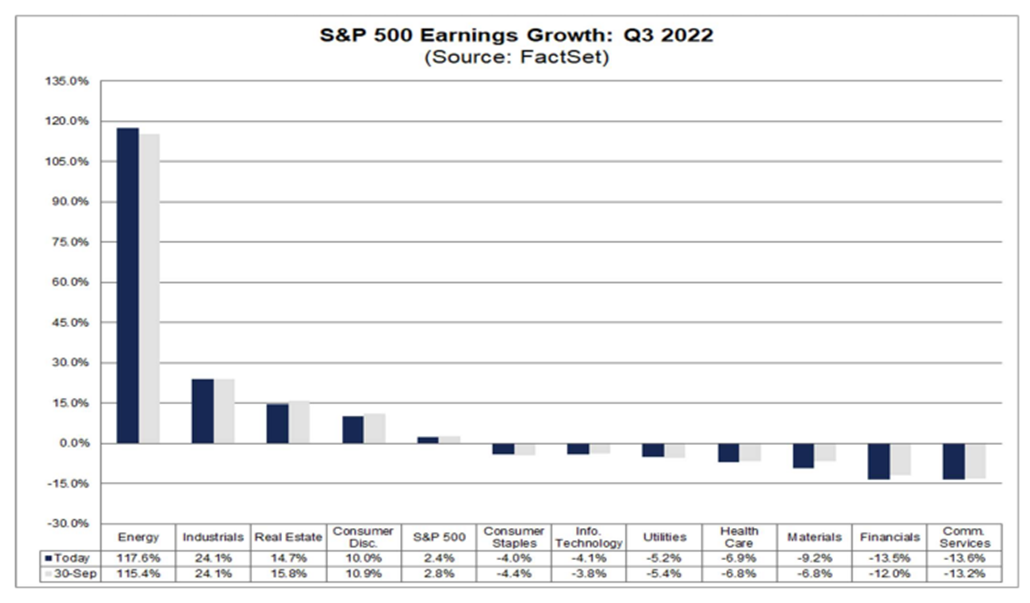
But the larger question is which area is set to grow earnings the most? According to FactSet, 4 sectors are slated to grow earnings this quarter: Energy, Industrials, Real Estate, and Consumer Discretionary. All other sectors are expected to show earnings slumps:
Source: FactSet
Looking at the chart above something should jump out: The Energy sector towers above all groups in terms of expected earnings estimates, with a staggering 117.6% growth rate. This group is by far the largest contributor to market earnings.
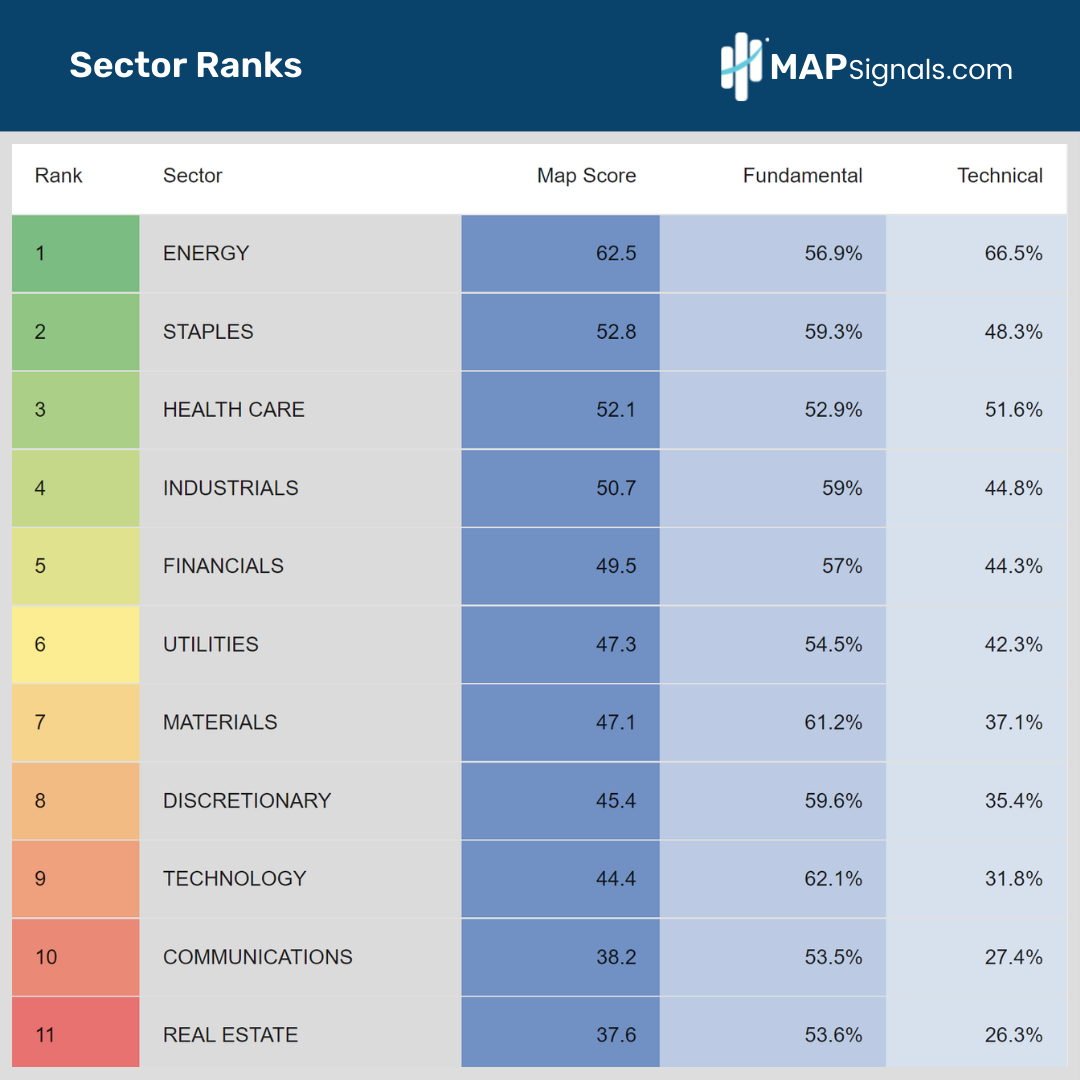
If you’ve been following MAPsignals research this year, you’ll know that the Energy patch has been the oasis, with the highest sector ranking all year.
See that below. The MAP Score for Energy is 62.5, nearly 10 points higher than the 2nd ranked group, Staples:
And when you’re in the top spot, it should come as no surprise that big investors have been attracted to the group in 2022. When earnings are booming, stocks are incredibly attractive.
Below you’ll see the daily Energy stock buys and sells. Blue bars are the total of stocks getting bought while red are sells.
Other than a few minor pullbacks, the Energy sector has been a one-way train higher:
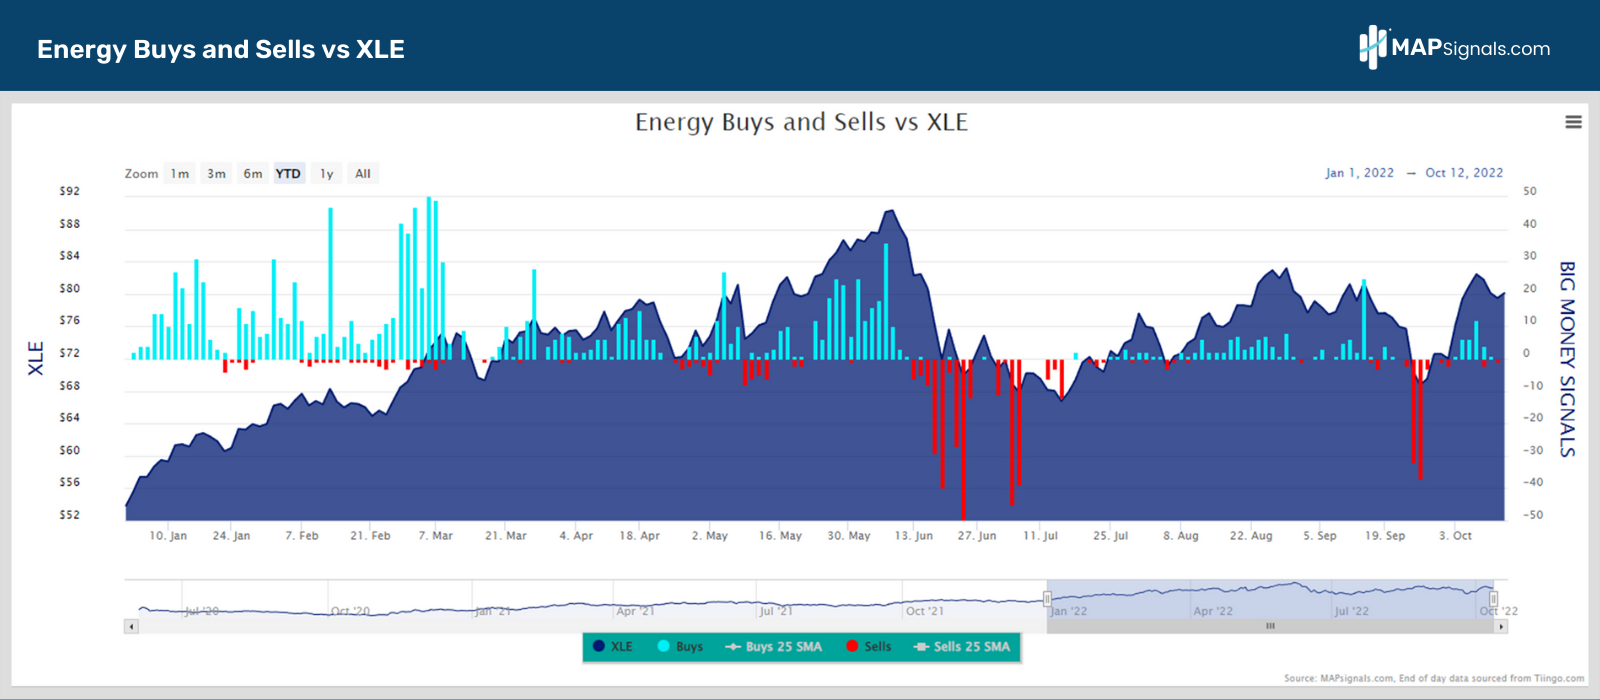
Energy stocks have been far and away the cream of the crop in our data all year… and for good reason. Oil & Gas prices have stayed elevated due to supply disruptions and a war in Ukraine. It’s one of the “sticky” areas of inflation.
And that’s where the opportunity for your portfolio comes into play. High commodity prices fall to the bottom lines of energy companies.
Needless to say, stocks follow earnings. And it’s why having a beefy allocation to energy stocks makes a ton of sense in this macro environment. Oil and Gas names have been the bellwethers in 2022 amid the market challenges.
A great way to see that is with our monthly MAP 50 report. It’s a list of the 50 top ranked stocks attracting institutional capital.
Here’s a snapshot of September’s report. You’ll notice 26% of the list is Energy stocks. That’s massive:
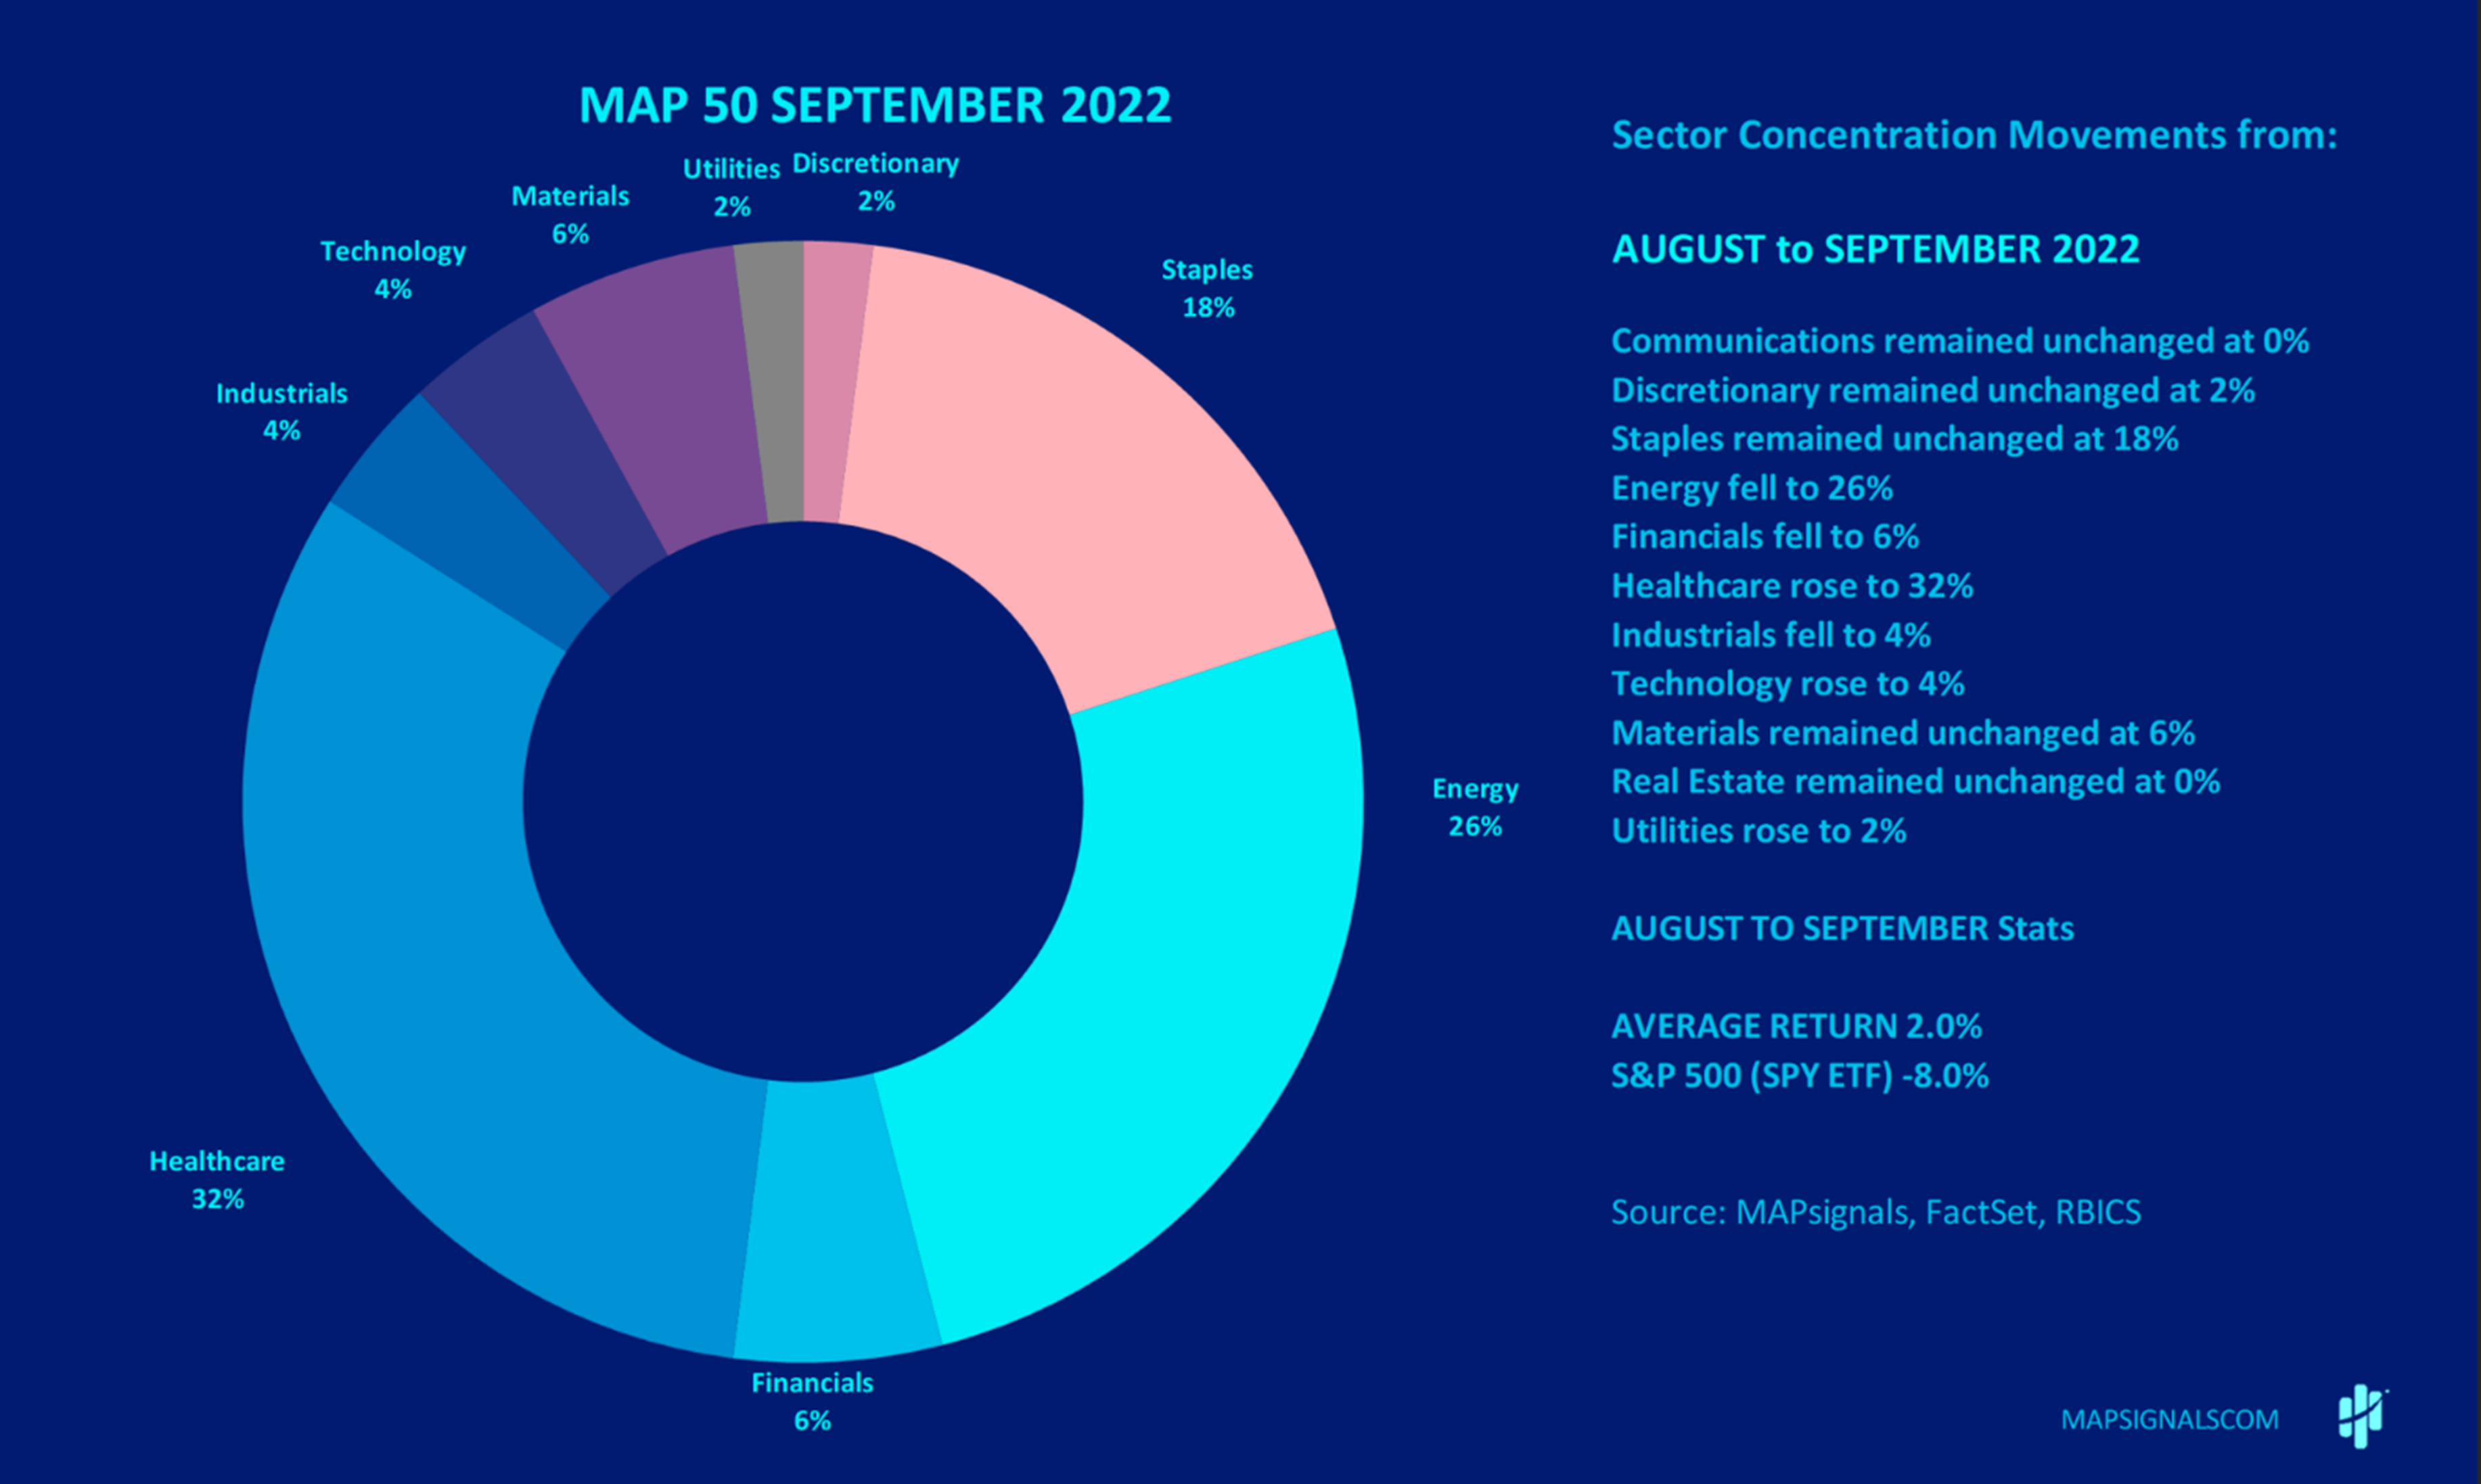
My bet is the strong Energy theme will continue for a couple of quarters. Our MAP 50 report for October is being released tomorrow, so sign up here with any subscription level if you’re wanting a great list of Energy stocks to pore over with great fundamentals and institutional support.
Let’s wrap up.
Here’s the bottom line: Earnings season begins next week. By far and away the Energy sector is poised to shine. It’s the one area where earnings are gushing.
Not only that, non-stop Big Money support is another confirmation that investors like the group. That’s a feather in the bull’s cap.
Energy is the top sector this earnings season. And remember, when you follow the earnings, chances are you’ll find tomorrow’s leaders.
The MAPsignals data-driven approach is a great tool to enhance your portfolio, no matter what level of investor you are. Whenever the next leadership groups emerge, and trust me they will – the Big Money will lead the way.
Have a great week!