
Time To Pop The Hood
by Lucas Downey All, Big Money Insights Weekly, Special ReportsWhen the check engine light flashes – bring your car in…don’t panic.
Running a diagnostic test helps visualize what’s going on.
To do that, a mechanic’s gotta pop the hood.
The same goes for the market. Today we’re popping the hood.
wikipedia
Monday’s Sell-off Was Off The Chart
Let’s start from the top and work our way down. I want you to see what we’re seeing under the hood each day.
Monday’s halted sell-off was epic. When we say it was off the chart, we actually mean that.
The below chart nets buys and sells each day. Green sticks are net buys and red are net sells. You can see just how large Monday’s selloff was compared to December 2018.
Have a look:
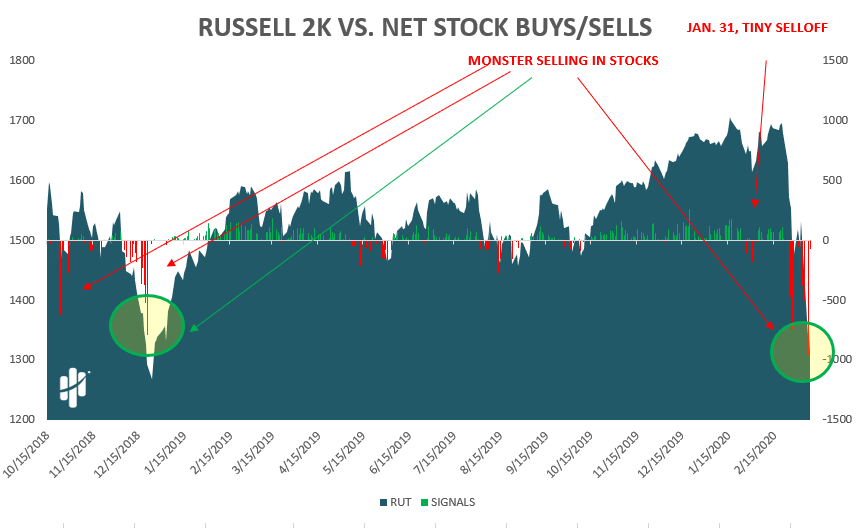
We’ve seen similar, but nothing of this magnitude. It was the single largest day of selling in stocks in our history.
Usually days like Monday are near local bottoms.
But, even as epic as it was, it’s still eerily similar to prior sell-offs.
The next charts should make that very clear.
We are inching ever closer to what is historically a very strong buy signal for us. The thing is, for us to get oversold – things have to get ugly…like now.
Below you can see our big money index which measures buying vs selling on a 5 week moving average. When it’s falling, like now, buyers have disappeared.
Our Mapsignals Big Money Index is free-falling:
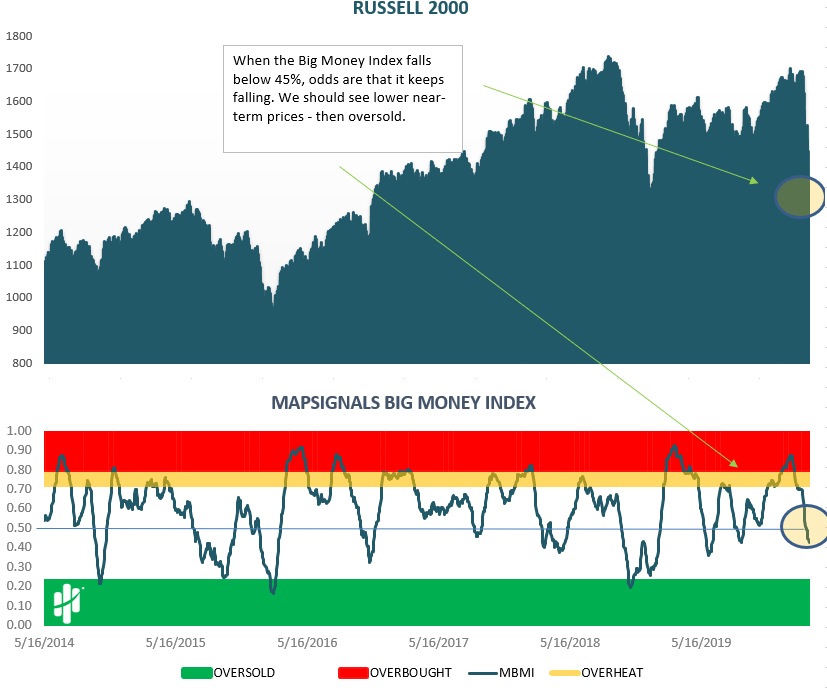
We’re likely 1-2 weeks away from being oversold. So, that means we likely have a bit more downside.
Big Money Selling In Sectors Is Huge
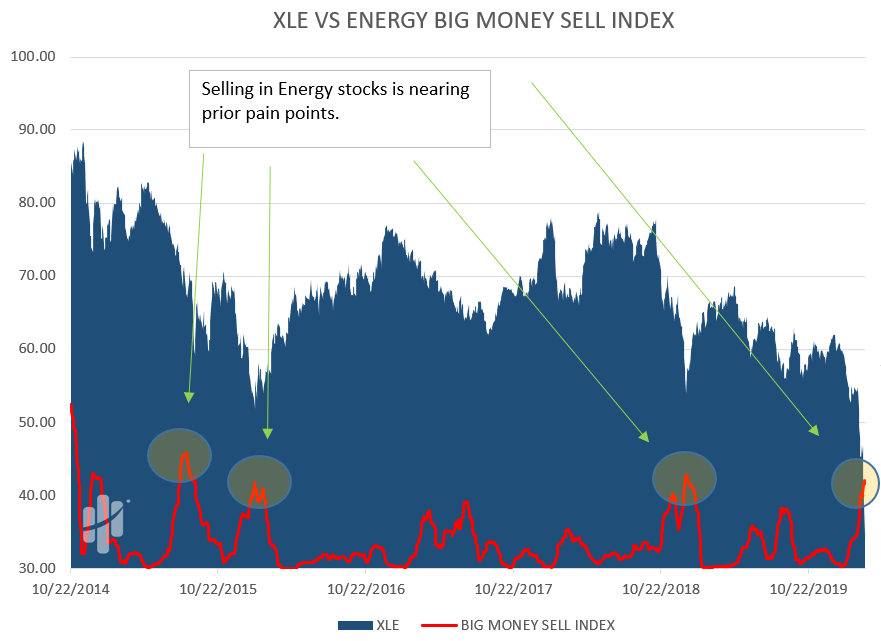
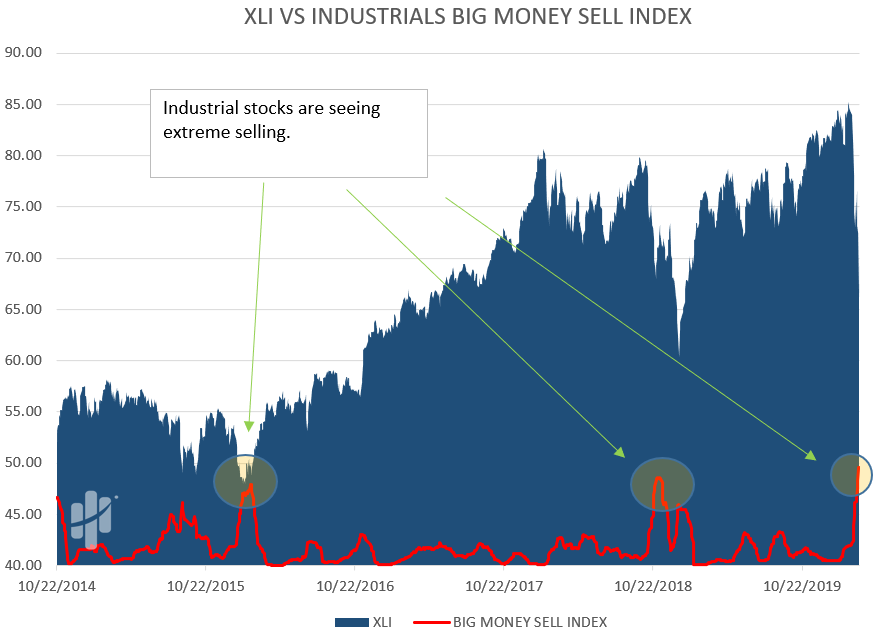
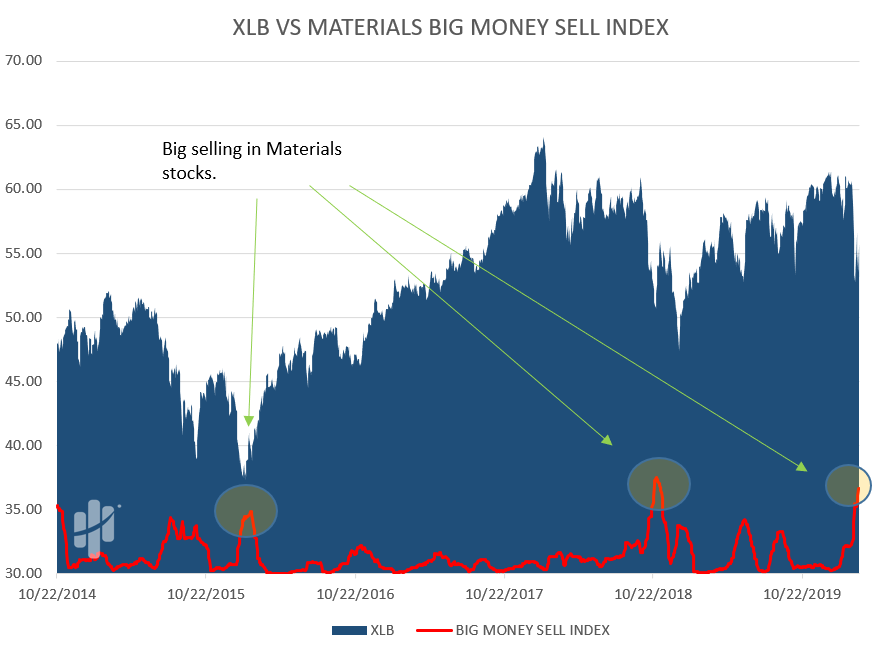
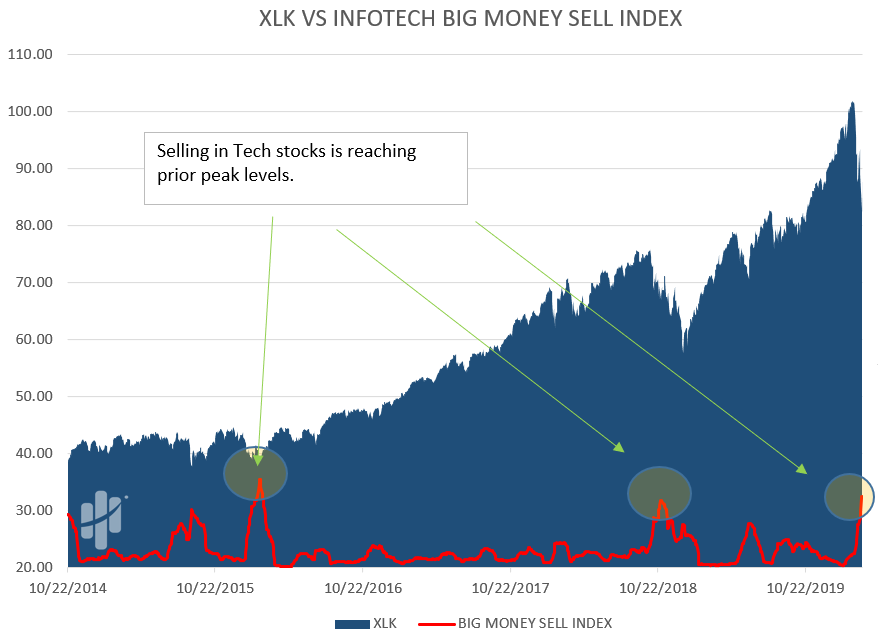
Let’s work our way down into sectors. Here’s a look at 5 sector charts that show how big the selling is currently.
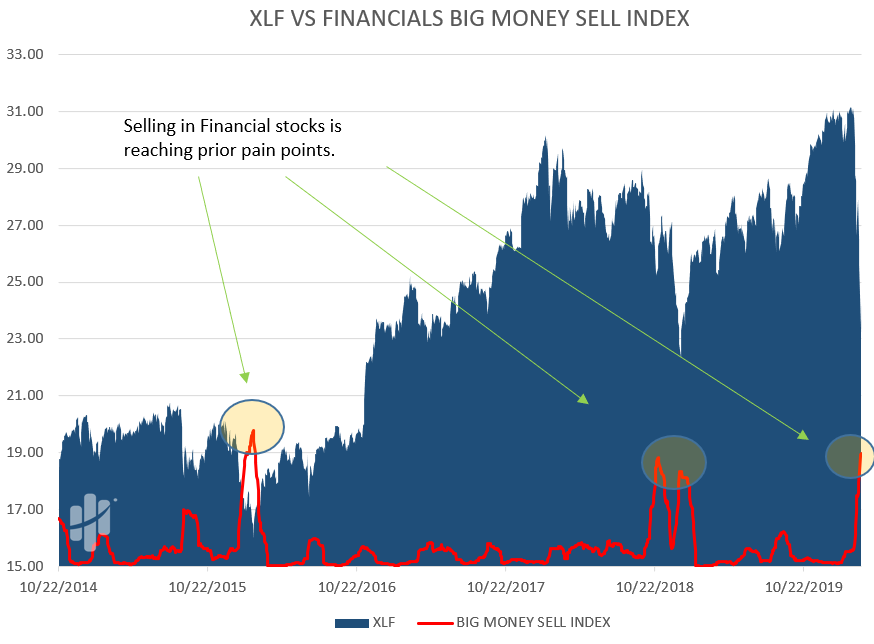
We create each big money index by taking a moving average of sell signals in each sector. As the index moves higher, selling is increasing.
The key takeaway is how similar-sized selling has happened before over the past 6+ years.
Here’s Financials:
Now, Energy:
And Industrials:
Then Materials:
And lastly, Technology:
Here’s the bottom line – pullbacks like these happen. It’s part of the game.
Using data is such an advantage in times like this. We are able to gauge supply and demand by looking under the hood.
And the mechanic in me says, “she’ll be ready for the road in no time.”
So, don’t panic when the engine light flashes – it’s part of owning a car.
The same can be said for investing.
A diagnostic test gives you the clarity you’re looking for.