The Geopolitics of Energy and the Midterm Market Cycle
by Jason Bodner All, Big Money Insights Weekly, StocksThe Lever
Archimedes said, “Give me a lever long enough and a fulcrum on which to place it, and I shall move the world.”
He was describing physics. He was also accidentally describing the political calculus of September 2026.
Oil is the lever. The Strait of Hormuz is the fulcrum. And the same mechanism creating market volatility may also be creating the incentive to resolve it.
The Setup We Expected
September arrived right on schedule. Midterm election anxiety is rising. Bond yields are elevated. Oil is above $90. Some growth stocks are getting hit. Investors who felt comfortable in June suddenly do not.
None of this should be surprising. Midterm election years are the weakest of the four-year presidential cycle, averaging 5.8% returns since 1926 with average intra-year drawdowns of 16%. The first nine months produce average declines of about 1% as uncertainty builds. We have been talking about this for months. So far, the script is playing out.
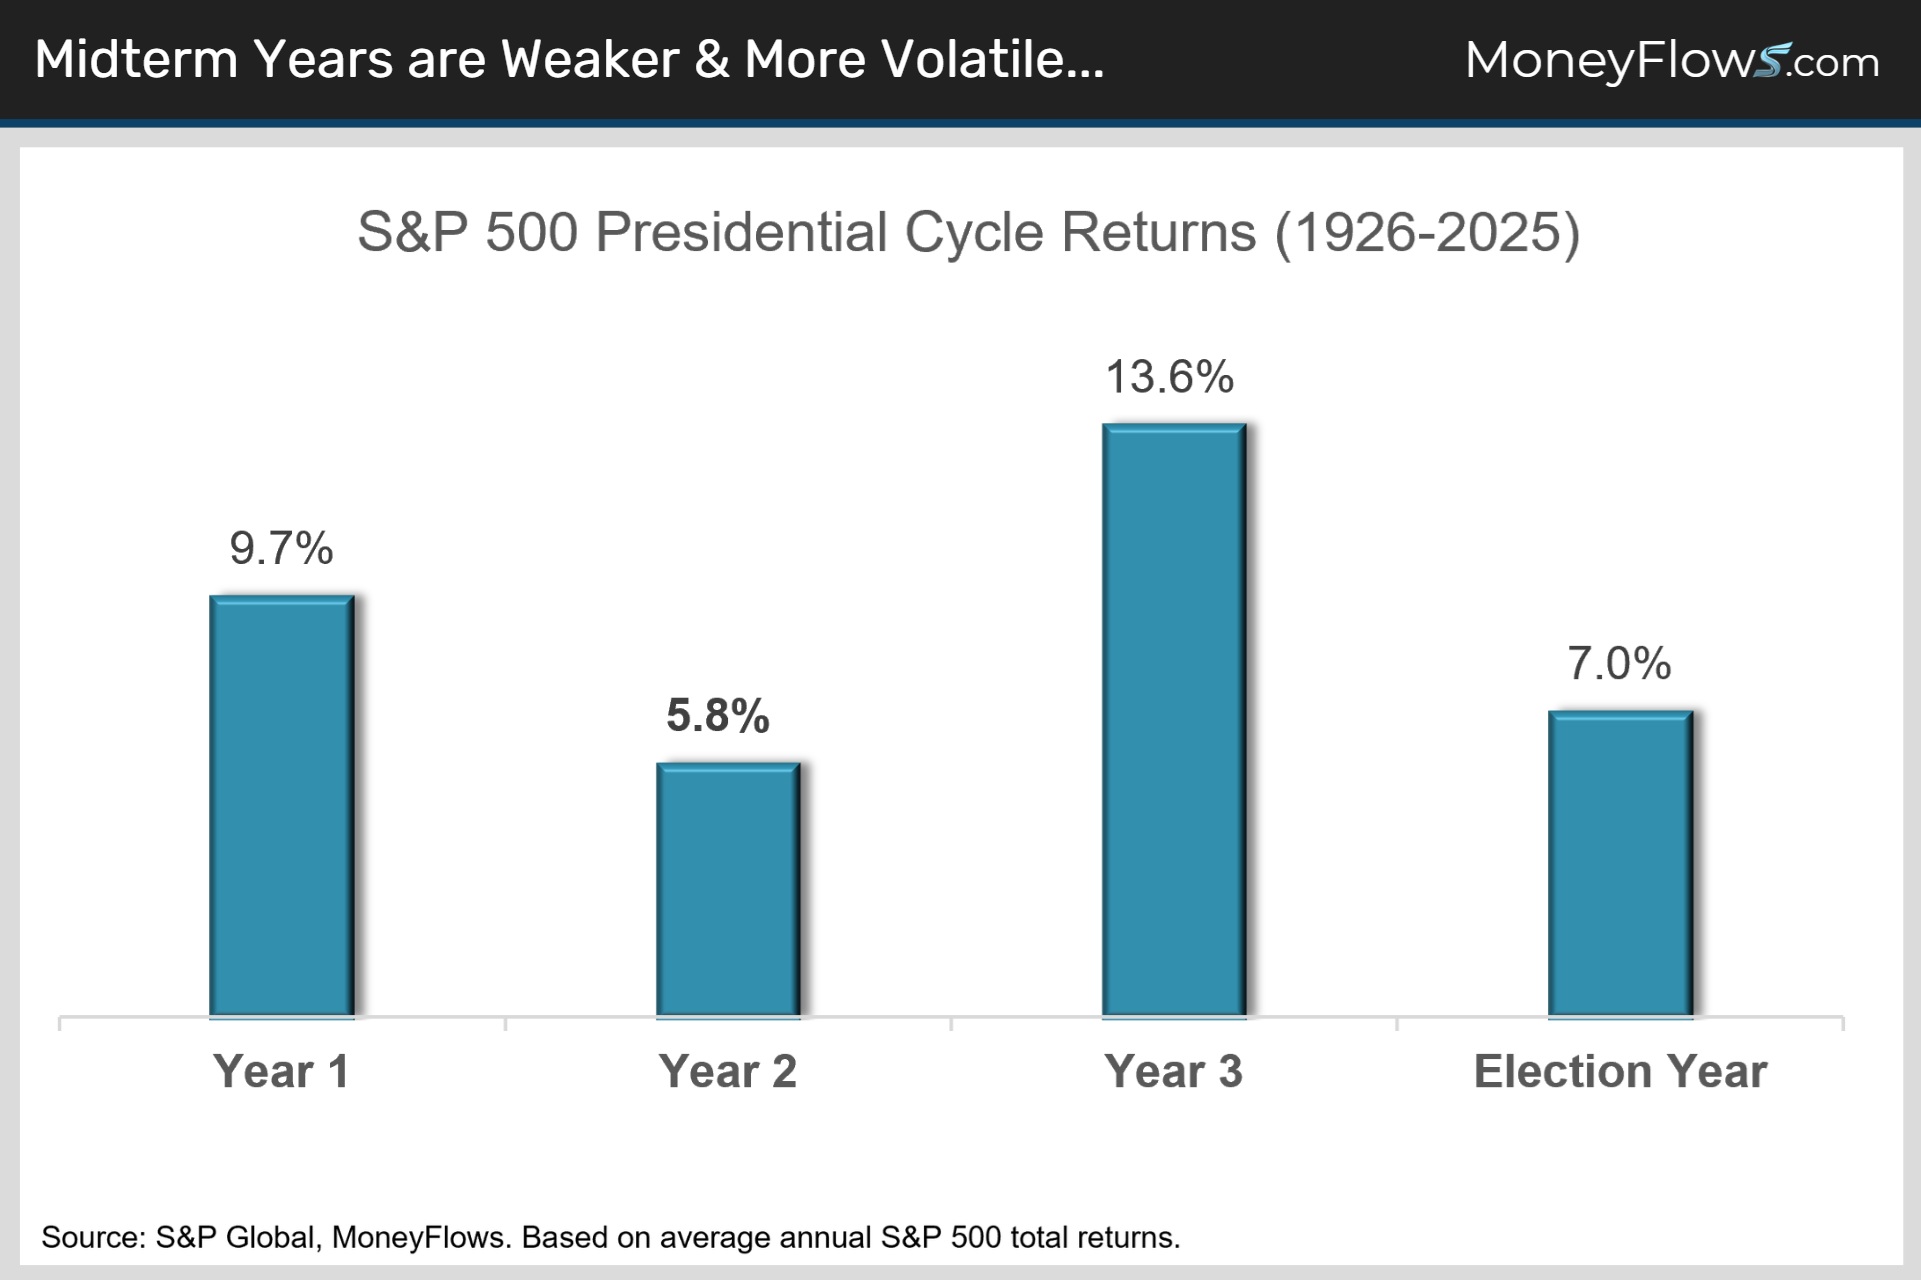
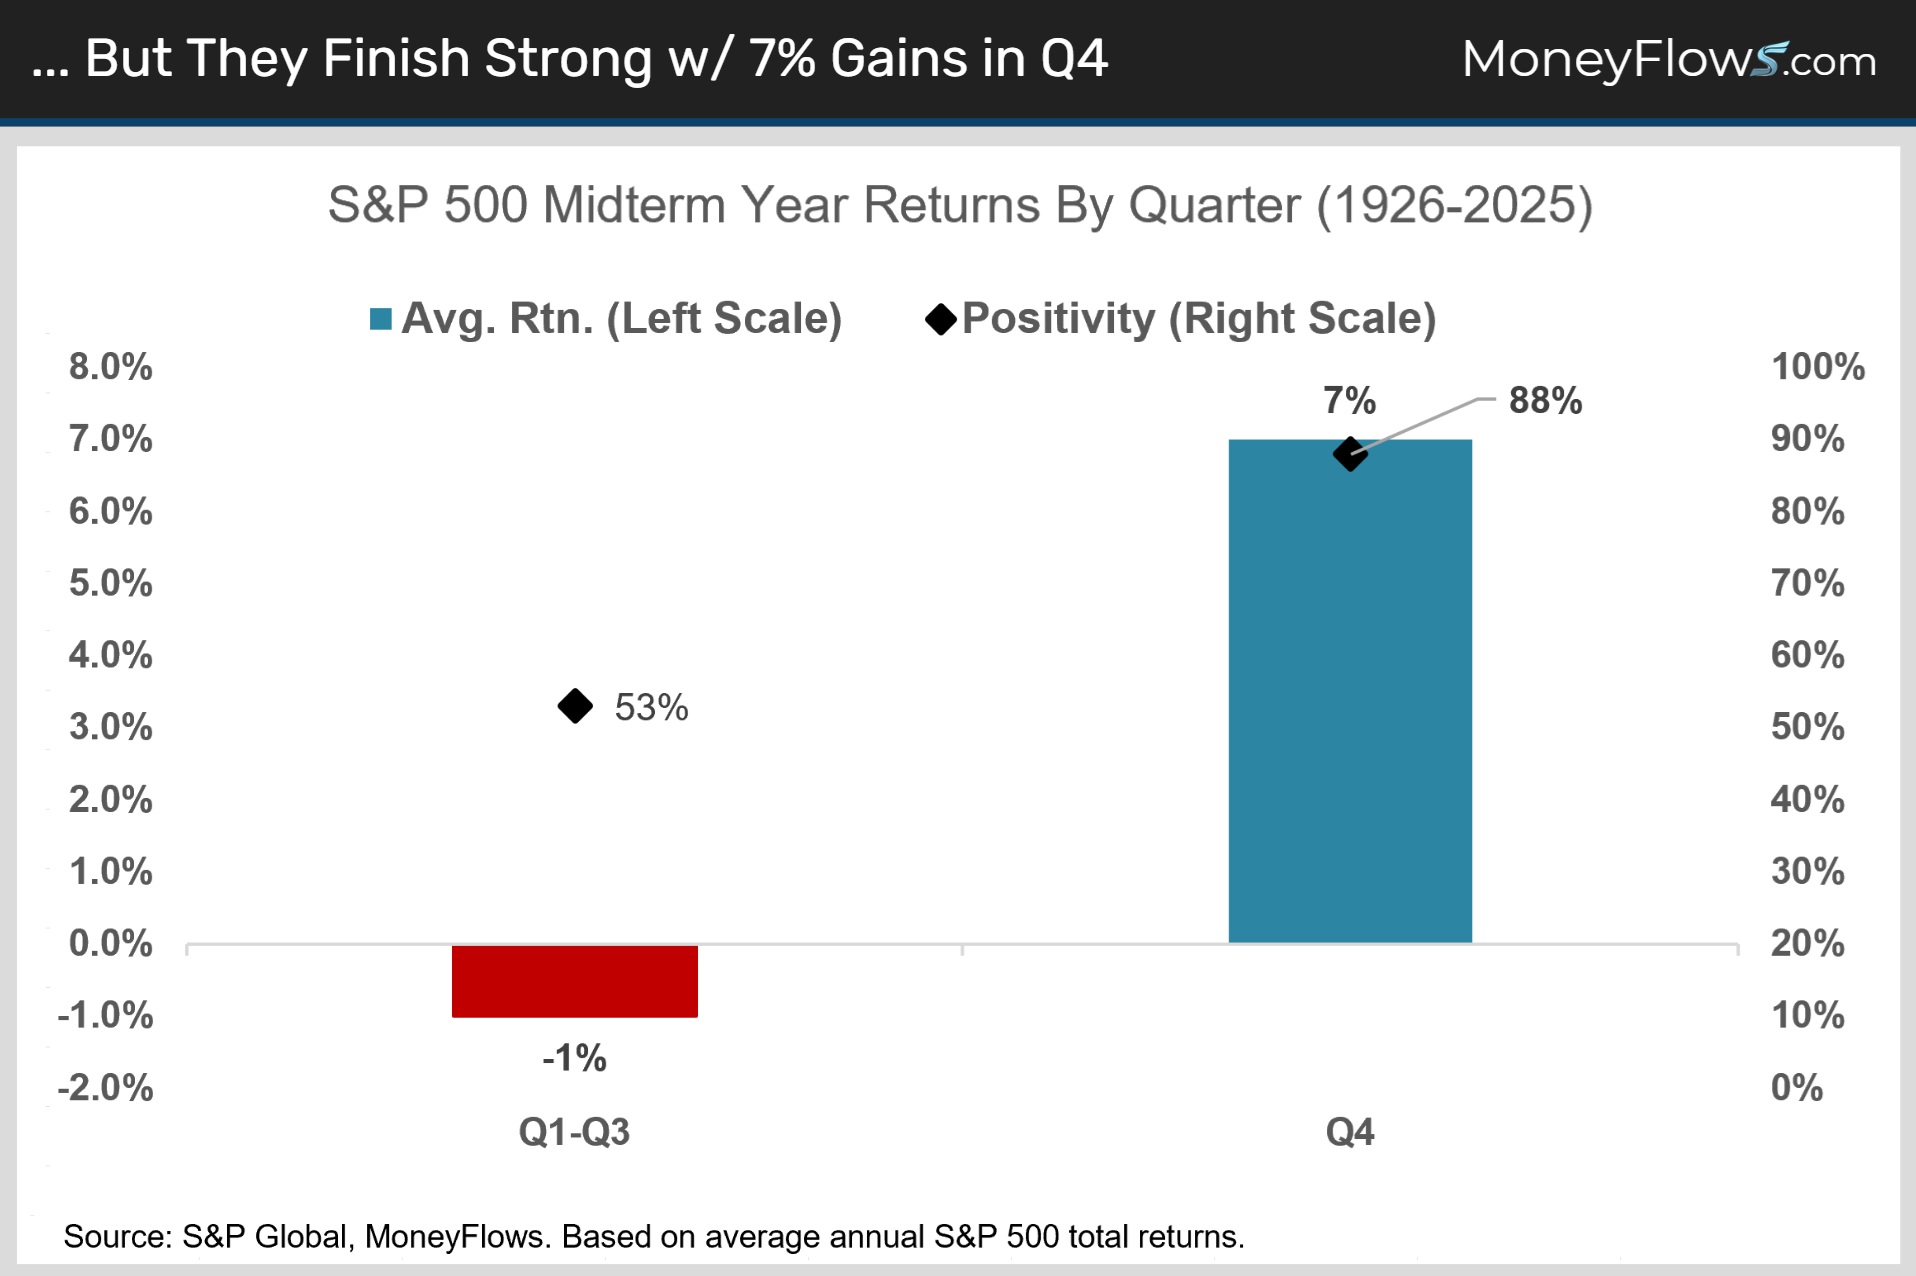
What matters is what comes next. Midterm years have averaged a 7% gain in the fourth quarter, with an 88% positive rate once election uncertainty fades. Since 1950, the S&P 500 has averaged a 36% one-year forward return from its midterm-year lows. The choppiness is the price of admission.
The Lever
Here is how the fear mechanism works. The Strait of Hormuz handles roughly one-fifth of global oil trade. Disrupt that flow and oil rises. Gasoline follows. Headline inflation rises. Bond investors demand higher yields. The Federal Reserve feels pressure even though monetary policy cannot produce a single barrel of oil.
Higher yields pressure growth stocks because future earnings get discounted at a higher rate. This week the 30-year Treasury hit 5.34%, its highest yield since 2007. Japan’s 10-year bond touched a 30-year high. United Kingdom gilt yields hit their highest rate since 1998.
It’s one variable with a lot of similar symptoms.
But the lever works both ways. If Hormuz normalizes, oil falls, inflation fears ease, and long-end yields can compress. Secretary of the treasury Scott Bessent can then accelerate buybacks, adding more downward pressure.
The unwind could be as fast as the buildup.
The Geopolitics of Energy and the Midterm Market Cycle
The Political Incentive
President Trump doesn’t want his midterm legacy to be losing the Senate and possibly Congress in his lame duck year. Resolving Hormuz removes the oil shock, cools inflation fears, and gives the bond market pre-election breathing room.
The Venezuelan deal announced earlier this year, securing a 35% equity stake in 65 billion barrels of oil reserves, suggests the strategic chessboard was already being set before Iran escalated. The political clock is ticking, and markets know it.
What the Data Says
Tuesday was the week’s most instructive session: 45 inflows and 133 outflows on real volume. The one-day ratio of 25.3% inflows was the lowest since the Situational Awareness blowup.
But context matters. In March, rising outflow spikes came with a collapsing Big Money Index, from 65% to 42% in three weeks, and each spike brought more selling. Then March 20 brought capitulation. It produced 337 outflows, the biggest selling day of 2026, and marked the exact low. One month later the S&P 500 was nearly 9% higher.
Tuesday wasn’t March. The BMI was 65.9%, more than 18 points above the March trough. At these BMI levels, outflow spikes historically look more like selling exhaustion than something worse.
Look how outflow spikes have aligned with local troughs over the past few months:
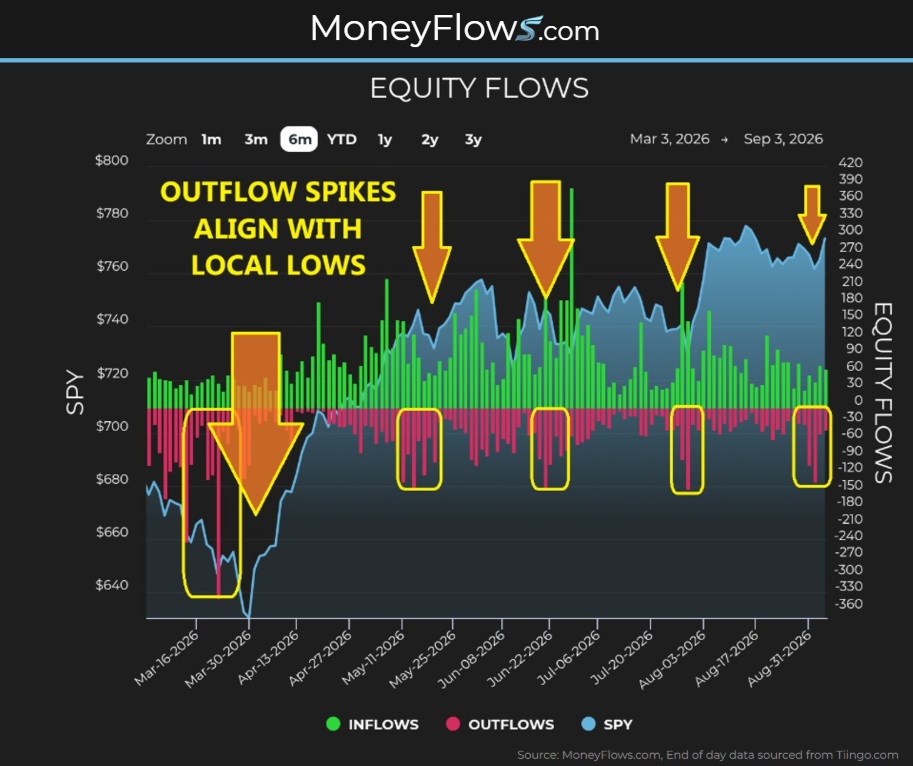
The market is rotating, not divesting. Wednesday and Thursday supported that view. Buyers returned, the Nasdaq composite gained 1.40% Thursday, and the BMI stabilized above 66%.
Sector Spotlight
Exchange-traded fund flows tell the rotation story. Commodity ETFs dominated inflows across crude oil, broad commodities, agriculture, and natural gas. Tuesday also saw 48 bond ETFs register outflows across maturities, credit qualities, and geographies. Over three days there were 70 bond ETF outflows involving 51 unique funds.
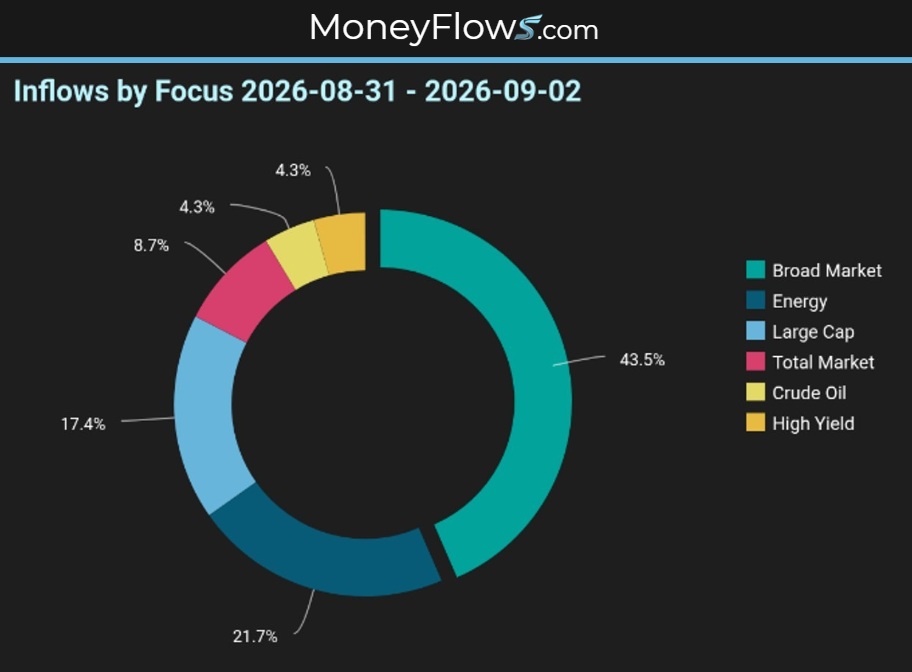
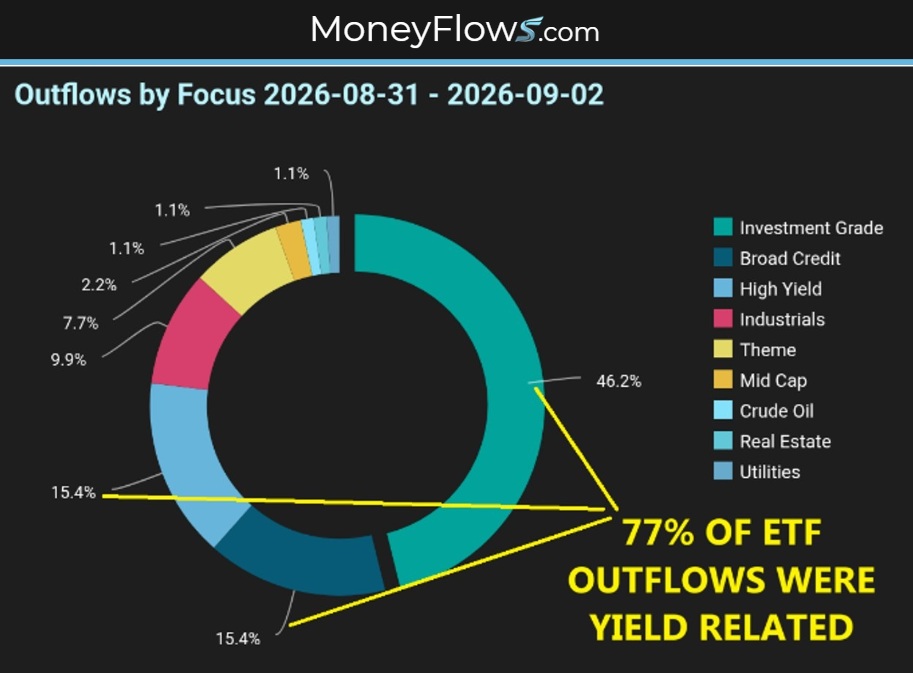
To me, that looks less like rotation and more like a washout. In stocks, extreme outflow readings have repeatedly marked local troughs – just like March 20. The same logic may apply here. When virtually every corner of fixed income gets sold at once, a lot of the sellers who wanted out may have just gotten out.
Sector flows confirmed the repositioning. Energy led at 52 net inflows, its strongest reading in months. Health care extended its streak to 11 straight weeks of net inflows with 29. Technology stayed positive with 7. Selling concentrated in industrials at -62, discretionary at -53, and real estate at -32 – those are exactly the rate-sensitive and cyclical areas taking the brunt of higher yields.
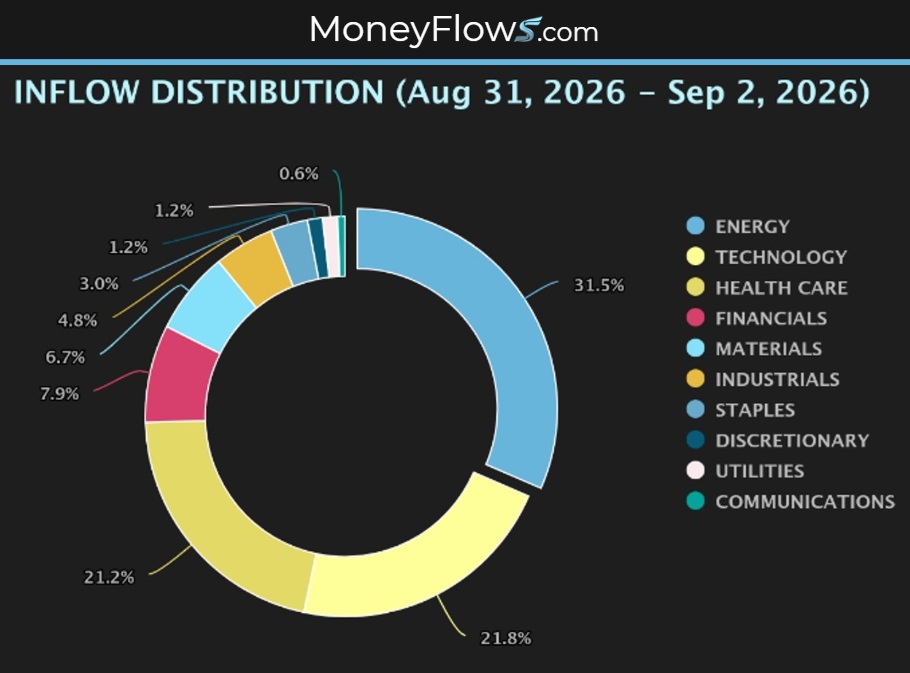
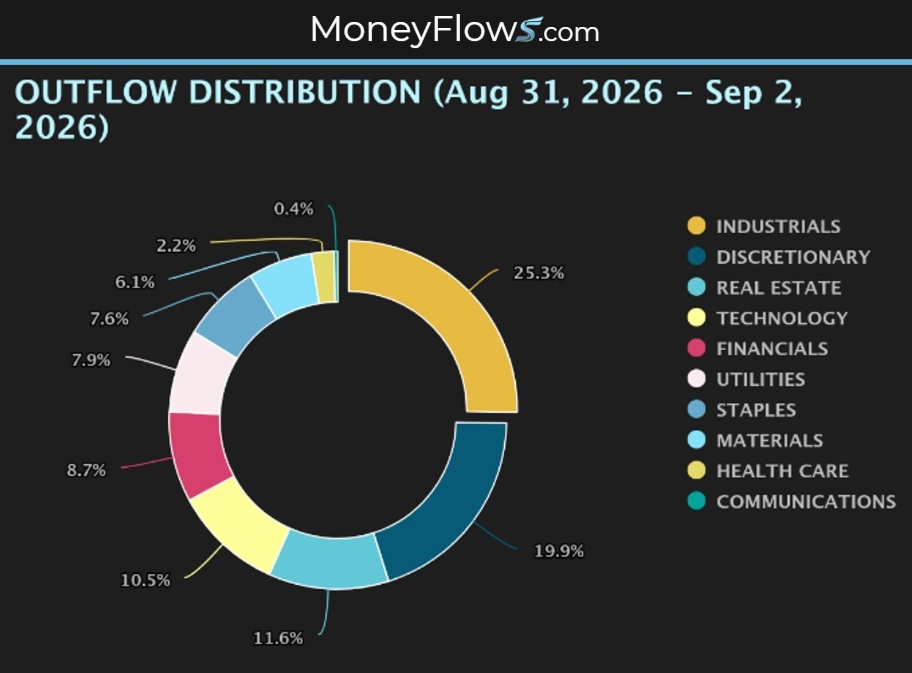
If Hormuz normalizes and the oil shock fades, those areas can reprice quickly.
The Earnings Backdrop
Friday’s jobs report added to the puzzle. The economy added 162,000 jobs in August, nearly triple expectations, while unemployment held at 4.1%. The headline needs context: 42,000 jobs came from public education, reversing July’s 45,000 decline.
Still, the message is clear. The economy is stronger than expected, even with high oil and rates.
Corporate America says the same thing. With 97% of S&P 500 companies having reported, 86% beat earnings estimates and 77% beat revenues. Blended earnings growth reached 52%, the highest since Q2 2021 and more than double the 23.1% expected on June 30.
In all, 10 of 11 sectors beat earnings expectations. Net profit margins hit a record. For Q3, positive guidance is running nearly two-to-one over negative guidance. And the forward price-earnings ratio is 19.6, below the five-year average of 19.9.
Businesses are producing record earnings while the market got cheaper.
Also, the AI buildout hasn’t changed. Nvidia CEO Jensen Huang guided to 70% revenue growth for fiscal 2028. Samsung, SK Hynix, and Micron, which control more than 90% of global DRAM, all warned of supply shortages through 2028.
The businesses haven’t changed. The narrative has.
The Other Side of the Lever
Volatile Septembers in midterm years always feel uncomfortable. They also end. November and December of midterm years are historically among the strongest months of the four-year presidential cycle. This time, the calendar and the political incentives may be pointing in the same direction.
The lever works both ways. The fulcrum hasn’t moved. And I think the force being applied is about to change direction.
As the Tao Te Ching says, “Return is the movement of the Tao. The nature of things is to cycle. The direction that looks permanent rarely is.”
MoneyFlows finds the winners early…bringing them to you.
If you’re a serious investor or money manager, get started NOW.
Our PRO subscription allows you to spot daily flows and access our weekly Outlier 20 report.
This is the report that has found EVERY SINGLE ONE of our Outlier stocks.
Enjoy a click-through experience unlike anything out there.
Professional money managers and RIAs looking for additional portfolio solutions including ETF flows & ranks and your own Portfolio Tracking tools, please reach out about our Advisor Solution and Emerging Advisor Program.
AND don’t miss my sit-down with Market Insider to blow the lid off how Wall Street’s “Big Money” actually operates—and how retail investors can ride their coattails.
Have a great week!
***Lastly, join me LIVE, October 5-7, 2026, at the MoneyShow TradersEXPO in Orlando.
You don’t want to miss this! Click the image below to reserve your spot.