
Stocks Finally Reach the Rare Overbought Zone
by Lucas Downey All, Big Money Insights Weekly, StocksHappy anniversary!
One year ago today, extreme oversold conditions ignited a rally for the ages.
Today, it’s time to acknowledge the other extreme: Stocks finally reach the rare overbought zone.
Last October, it was a lonely call to suggest “a massive rally is coming soon.” But when you’re armed with evidence-rich data, those crowd-stunning calls are easy to make.
Today marks the one-year anniversary of the oversold Big Money Index (BMI). For those keeping score, both the S&P 500 and NASDAQ 100 are both up 35% since.
It’s one of the most powerful risk-on signals you’ll find.
Congratulations if you heeded that call.
Today’s message signals a shift in tone. We’ll try and decipher what investors can expect going forward.
More importantly, when it’s a good idea to take some profits off the table.
Please NOTE: Our long-term bullish stance is not changing.
However, overbought conditions will not last forever and eventually a healthy pullback will begin.
We’ll cover the one data point to help guide you once the tides shift.
But first, let’s take a stroll through the Big Money landscape.
Stocks Finally Reach the Rare Overbought Zone
Markets are constantly moving from one extreme to the other. Our trusty Big Money Index (BMI) helps us gauge when the pendulum has swung too far.
Since 2018, we’ve had 7 extreme oversold readings and 10 overbought readings:
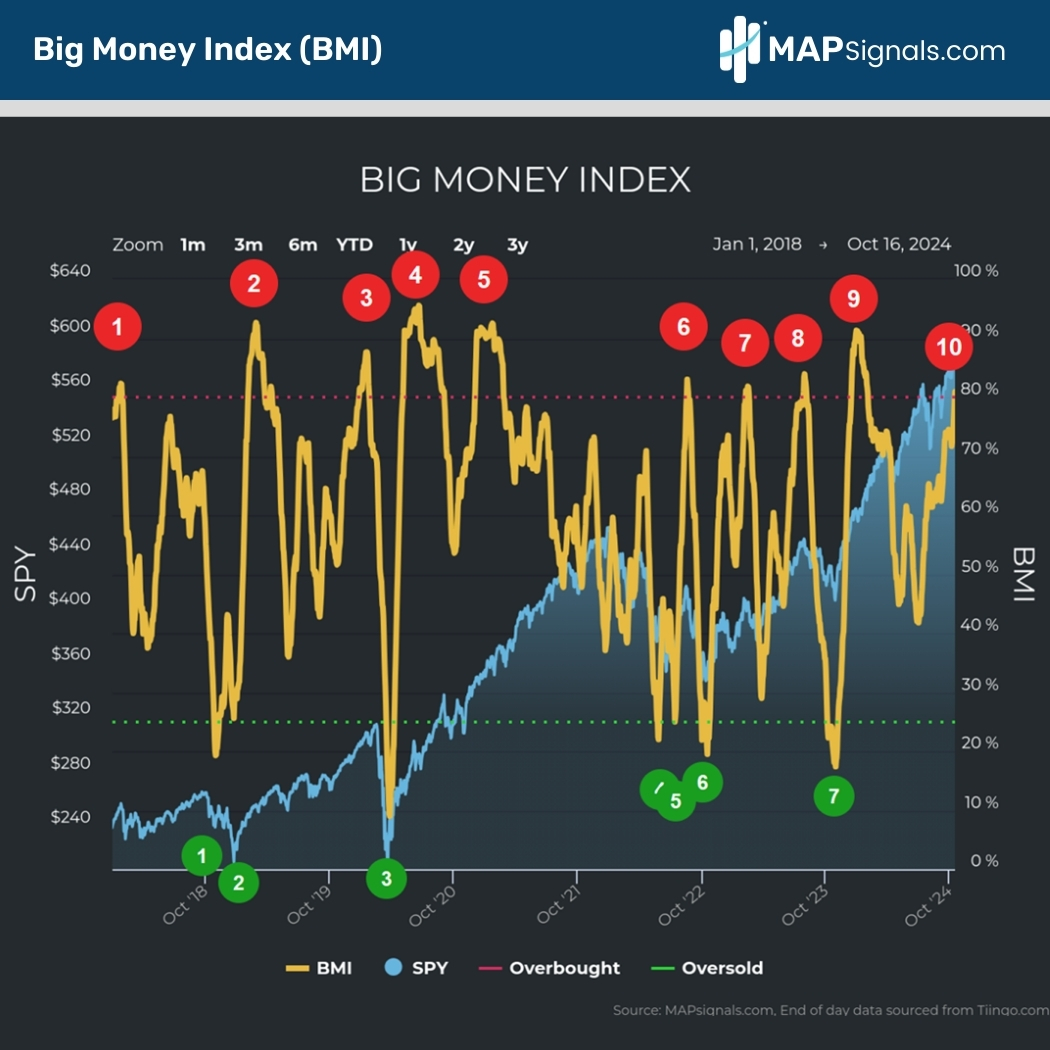
From this image it should be evident how powerful oversold readings are for market returns. Since 2018, once the BMI reaches oversold (green dots) the average 12-month return for the S&P 500 is +26.1%.
I should also mention that the win percentage is 100% in this limited window. So when we yell to back up the truck, like we did on March 19th, 2020 …now you know why.
Stocks rarely hang around in the extreme zones forever.
The other extreme zone to be aware of is the overbought zone. We pierced it this morning with the BMI clocking 80.9%.
On a 5-week basis, 81% of our buy and sell signals have been green…that’s extreme. Here’s a look at the past 4 red zones since 2022. You’ll notice we tend to see a pullback soon after:

Now, you may assume I’ve turned into some big bad bear overnight.
That’s hardly the case.
I just respect data. And after being in business for 10-years, we’ve learned a thing or 2 about the rare overbought zone.
First, back to 2014 the BMI stays overbought for an average of 21.88 days. That’s right about a month.
So don’t be surprised if the market’s enthusiasm hangs around for a while!
Second and most important, once the BMI falls out of overbought, stocks struggle. It’s when the tide goes out that we see falling equity prices.
Check out this chart.
When the BMI breaks below 80% after being overbought, large and small-cap stocks are negative on average 1-week to 2-months out.
Once the BMI falls out of overbought:
- A week later, the S&P 500 falls .9% and the S&P Small Cap 600 dips 1.3%
- A month later, the S&P 500 slips 1.6% and small caps crack 2.7%
- 2-months after, the S&P 500 drops 2.1% and the S&P Small Cap 600 falls 4.3%
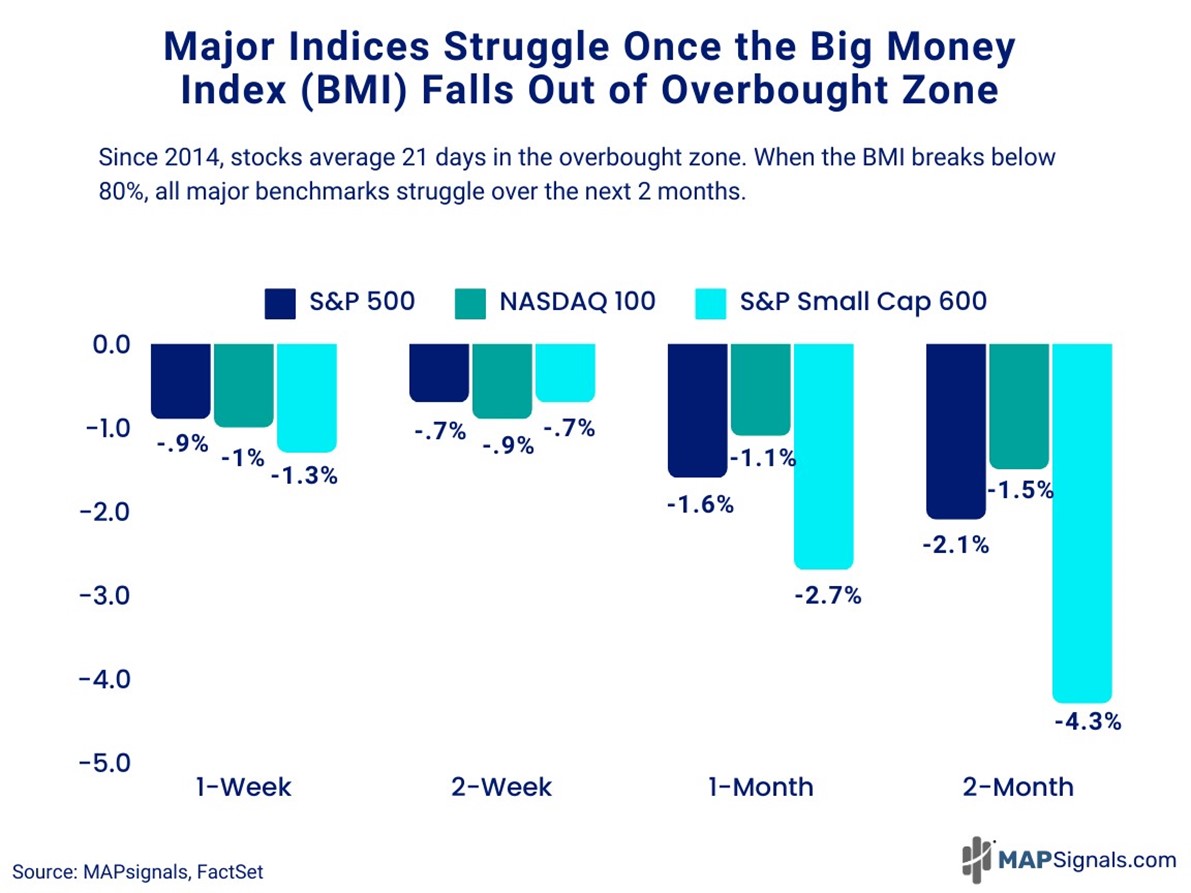
Do yourself a favor and stick this graphic on your refrigerator. It’ll come in handy once the BMI signals the bid for stocks is fading.
It’s when the tide goes out of stocks that you’ll be glad you have MAPsignals.
BUT don’t lose sight of the bigger opportunity. It’s during painful drops when opportunity arises. This forecasted stumble is simply a minor blip in a massive bull market.
If you’re new to the MAPsignals process and missed out on the outstanding gains the last year…don’t fret – historical evidence says your buy-the-dip opportunity is around the corner.
You just need a map to see it!
Let’s wrap up.
Here’s the bottom line: Congratulations if you stuck with stocks the past year. Extreme oversold readings ignite monster rallies.
On the flip side, our Big Money Index (BMI) alerts us once equity conditions flash the red light.
From time to time, stocks finally reach the rare overbought zone. This isn’t a time to be fearful…it’s a time to start focusing on lightening up risk ahead of a healthy pullback.
Let the BMI be your guide.
Ride the wave until it crests.
That’s the power of following the market map!
To quote Jon Kabat-Zinn, “You can’t stop the waves, but you can learn to surf.”
If you’re a serious investor, RIA, or money manager get started with a MAP PRO subscription to help you navigate extreme conditions.