

Stock Market Dump Before the Pump
by Lucas Downey All, Big Money Insights Weekly, StocksMarkets stall before they fall.
Planning ahead is the key.
Here’s how to play the likely stock market dump before the pump.
Consider this: The Red Car Theory, believed to have originated with Charles Cooley, suggests that opportunities are around us but only once we have a conscious awareness.
A common example is noticing red cars. How many red cars did you spot the last time you went to the grocery store? Maybe 1 or 2?
Chances are there were more.
How about the next time you go shopping, for each red car you notice, you’ll receive $250? Where there’s opportunity involved, you’re likely to recognize many more red cars at the store.
This is because when you are incentivized to spot red cars, suddenly they appear all over the place…
Opportunity is everywhere when you’re focused.
The stock market offers these easily missed red car moments too… where a healthy pullback is likely ahead. Most won’t notice it because the market appears to keep chugging higher week after week.
However, once you analyze the data, and focus on historical evidence, suddenly this assumed market challenge transforms into a buying opportunity into yearend.
Stock Market Dump Before the Pump
You need to have a well-rounded approach to investing. That means, understanding macro drivers and market mechanics.
Just 2 short weeks ago, Alec Young, laid out the fundamental case for stock market choppiness before a pop. It’s a great macro playbook on why you’ll want to buy the dip.
Today we’re going to echo that message with our proprietary Big Money data. Last week, we noted how stocks sputter once the Big Money Index (BMI) falls out of overbought and sinks below 75%.
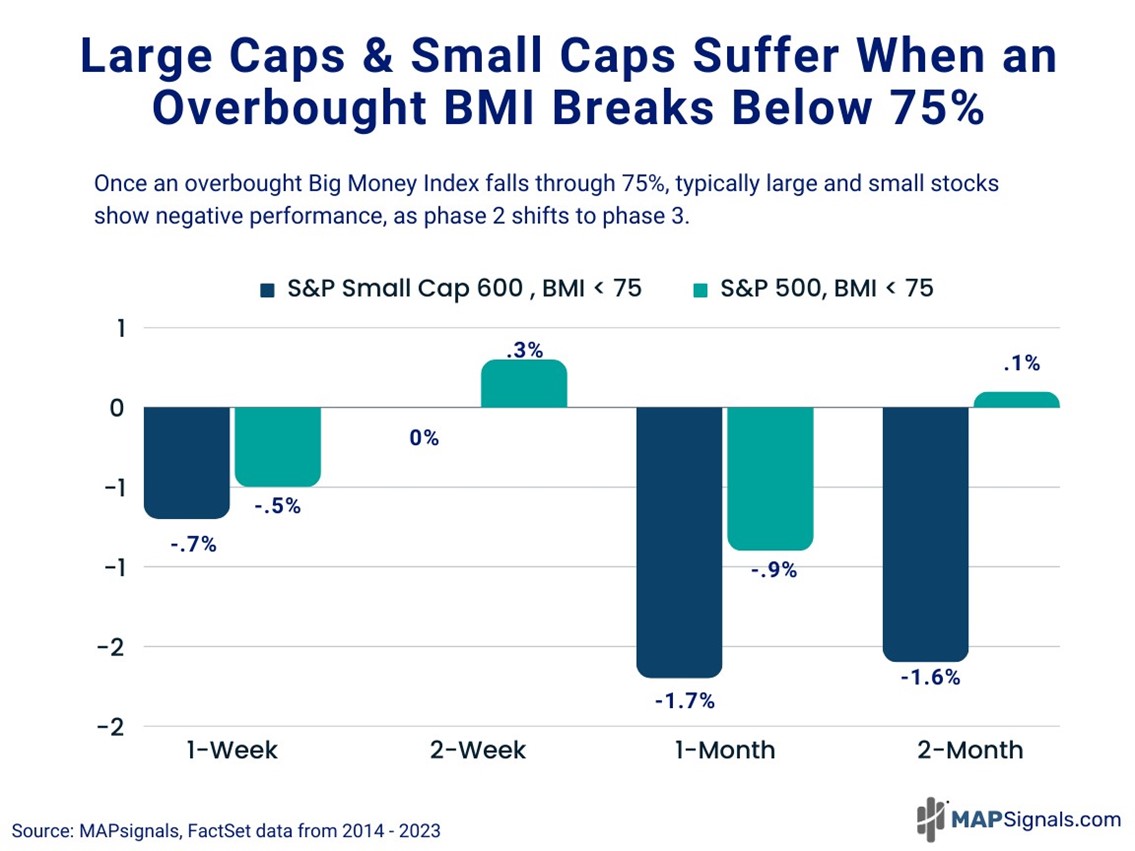
Here’s a recap of that revealing study. Since 2014, both small and large caps offer lackluster returns in the 2-months following a break below 75%:
At first glance, this could make the hairs on your neck stand up. Seeing potential market declines ahead isn’t usually a welcoming feeling.
That is until you shift your focus. You see, there’s a red car driving by… you just need to be aware of it.
There’s evidence that you’ll want to buy the stock market dump before the pump.
Let me show you what I mean.
2024 is off to a sizzling start for equities. The S&P 500 is about to end the month of February with a year-to-date gain of 6.29%.
I went back in history and singled out all instances from 1979 where the S&P 500 gained 5%+ or more through the first 2 months of the year.
There were 15 prior instances.
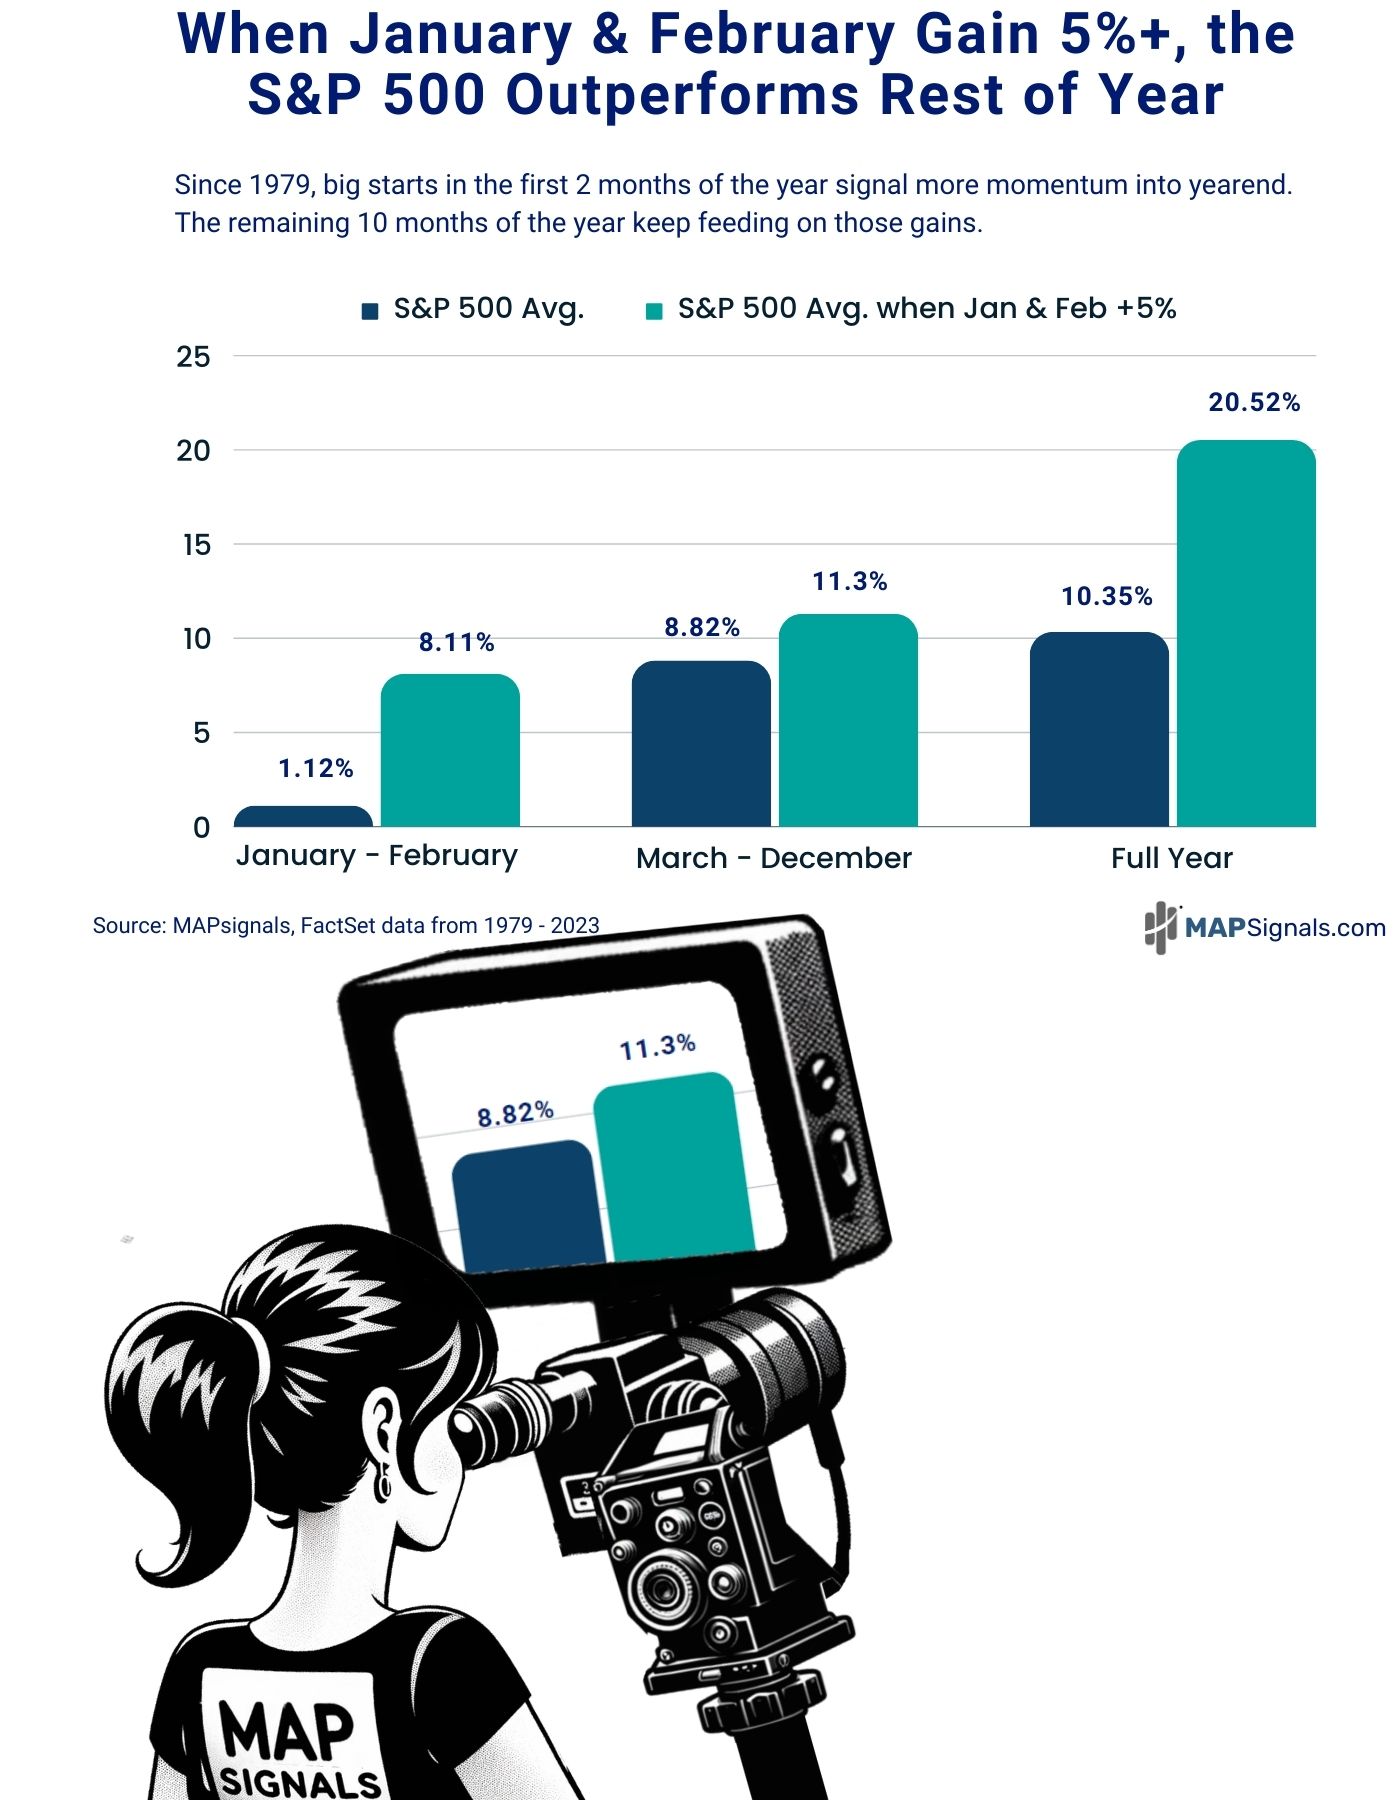
Here’s the red car situation. Whenever stocks are up 5% or more in the months of January – February, the remainder of the year sports market-beating returns.
Below compares the average forward performance of the S&P 500 in the months of March – December vs. years when the first 2 months are up 5%+.
In average years, the remaining 10 months show an average lift of 8.82%. But when the year starts off with a bang, those average returns pump to 11.3%.
Our very own Maria Maple, is laser focused on the market red car zooming by:
Our bullish stance back in mid-October, when we yelled that a massive rally was coming soon, was grounded in this same data-driven approach.
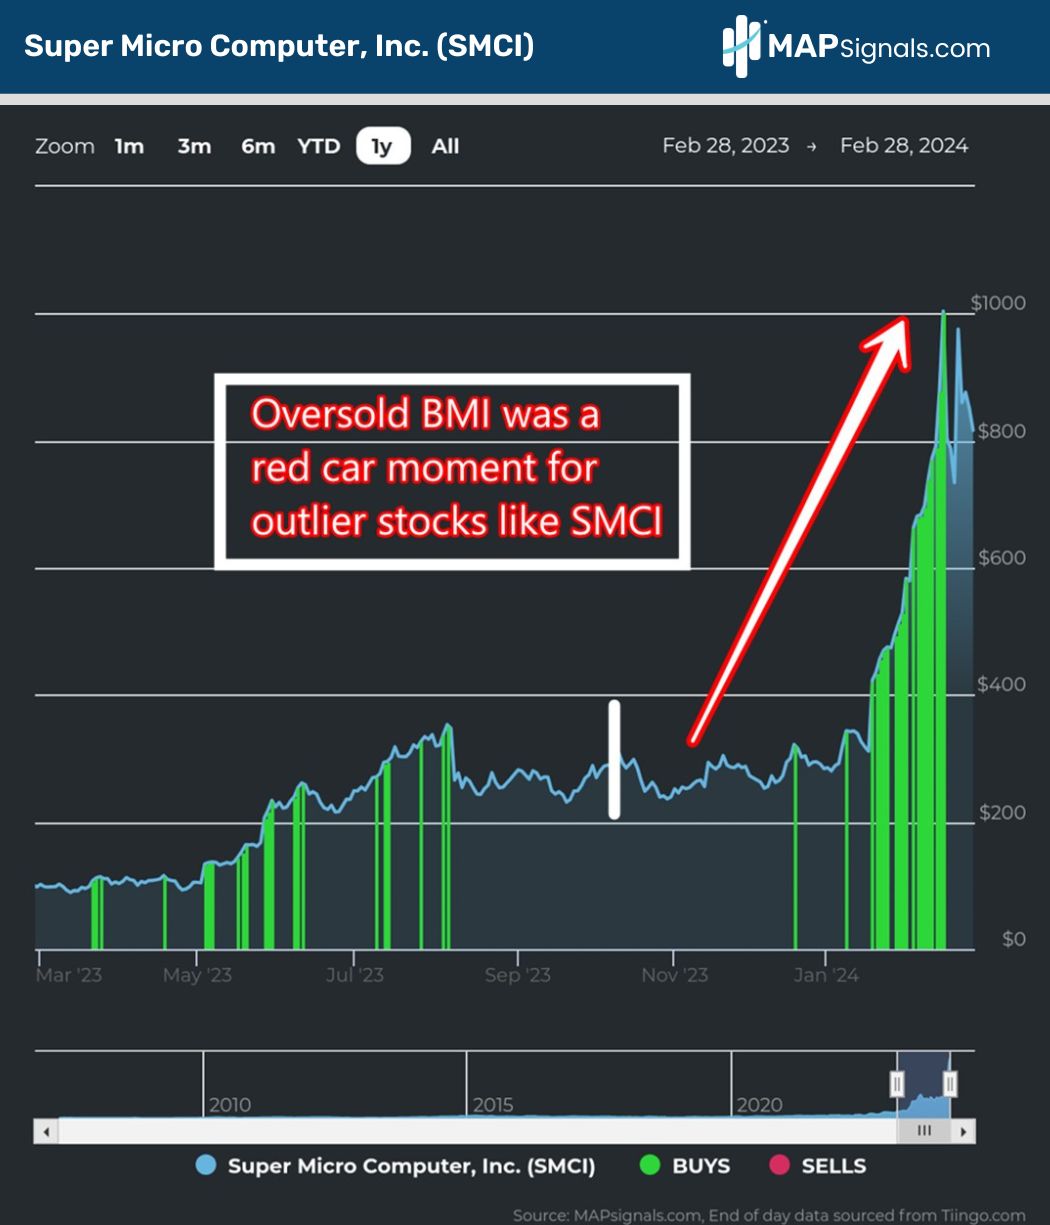
Back then we highlighted 10 single stocks for subscribers to own including NVIDIA Corp. (NVDA) and Super Micro Computer (SMCI).
Here’s how the latter performed afterwards. The white line signifies when we outlined SMCI as an oversold stock to own in October:
If your portfolio is idling by, jumpstart it today.
There are opportunities when you tune out the noise…big opportunities.
Let’s wrap up.
Here’s the bottom line: A falling BMI spells near-term pain. A juicy start to the year spells longer-term gain.
The S&P 500 should be up 5% or more through February. Based on history, that indicates a market-beating gain for the remainder of the year.
Don’t miss the stock market dump before the pump.
There’s a red car zooming by…
If you’re a serious investor looking for market-beating insights, join many Registered Investment Advisors (RIAs) that enjoy our cutting-edge research.
Get started with a MAP PRO subscription, which will give you access to all our proprietary indicators and prized Top 20 list.