
Shaking Out the Weak Hands
by Lucas Downey All, Big Money Insights WeeklyInvesting isn’t always balloons and buttercups. Sometimes it’s outright painful.
Many stocks are down massively. Mr. Market has a way of shaking out the weak hands.
Look, we are in the midst of a nasty selloff. Many stocks are down well over 50%. It’s one of the deepest growth pullbacks I’ve ever sat through. And I’ve been through plenty!
Last week I laid out my game plan for an oversold market. In it, I showed how selling of this magnitude has a bullish setup literally across the board. Guys and gals, this is not the time to throw in the towel.
So, while waiting for a true oversold market can take time to play out – being proactive is the best strategy. Because let me be clear: Markets won’t always be in free-fall. Eventually they’ll settle down and a bullish catalyst will stop the red.
As my favorite investor of all-time, Peter Lynch put it, the real key to making money in stocks is not to get scared out of them. And he’s right. The best stock investments of all-time required perseverance and conviction.
Drawdowns are part of the game.
And while the data suggests that Mr. Market isn’t done shaking out the weak hands, today I’ll show you why you want to be proactive in this type of environment.
But, first let’s look at the data.
Big Money Index Did Not Rise Last Week
Over the past 5 trading days, the S&P 500 (SPY ETF) rose 6%. Normally, that’s very bullish. But, when the data doesn’t confirm it, I take notice.
Look how the latest bounce did not lift the Big Money Index.
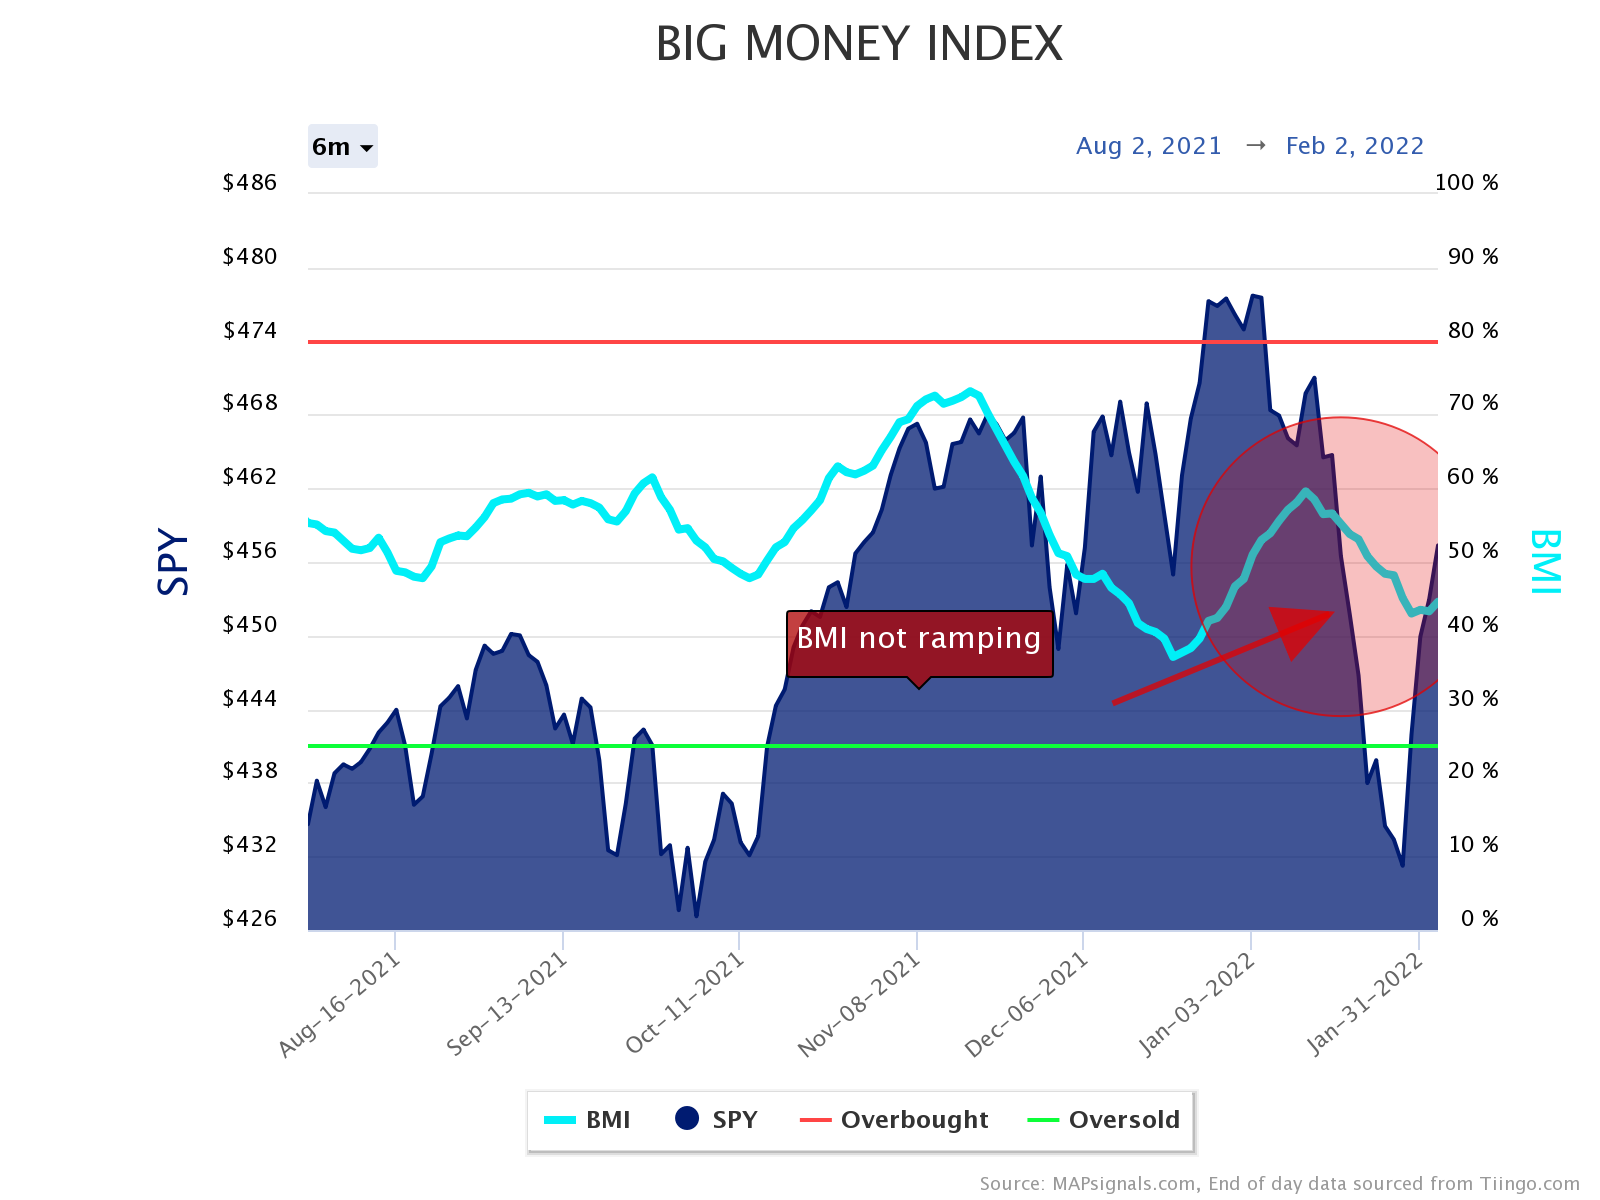
And you may be wondering why it didn’t lift. Well, it’s because the latest ramp in stocks is due to selling slowing…not because buyers stepped in. Let me show you what I mean.
Below are the daily buys and sells. The main takeaway is that selling vanished:
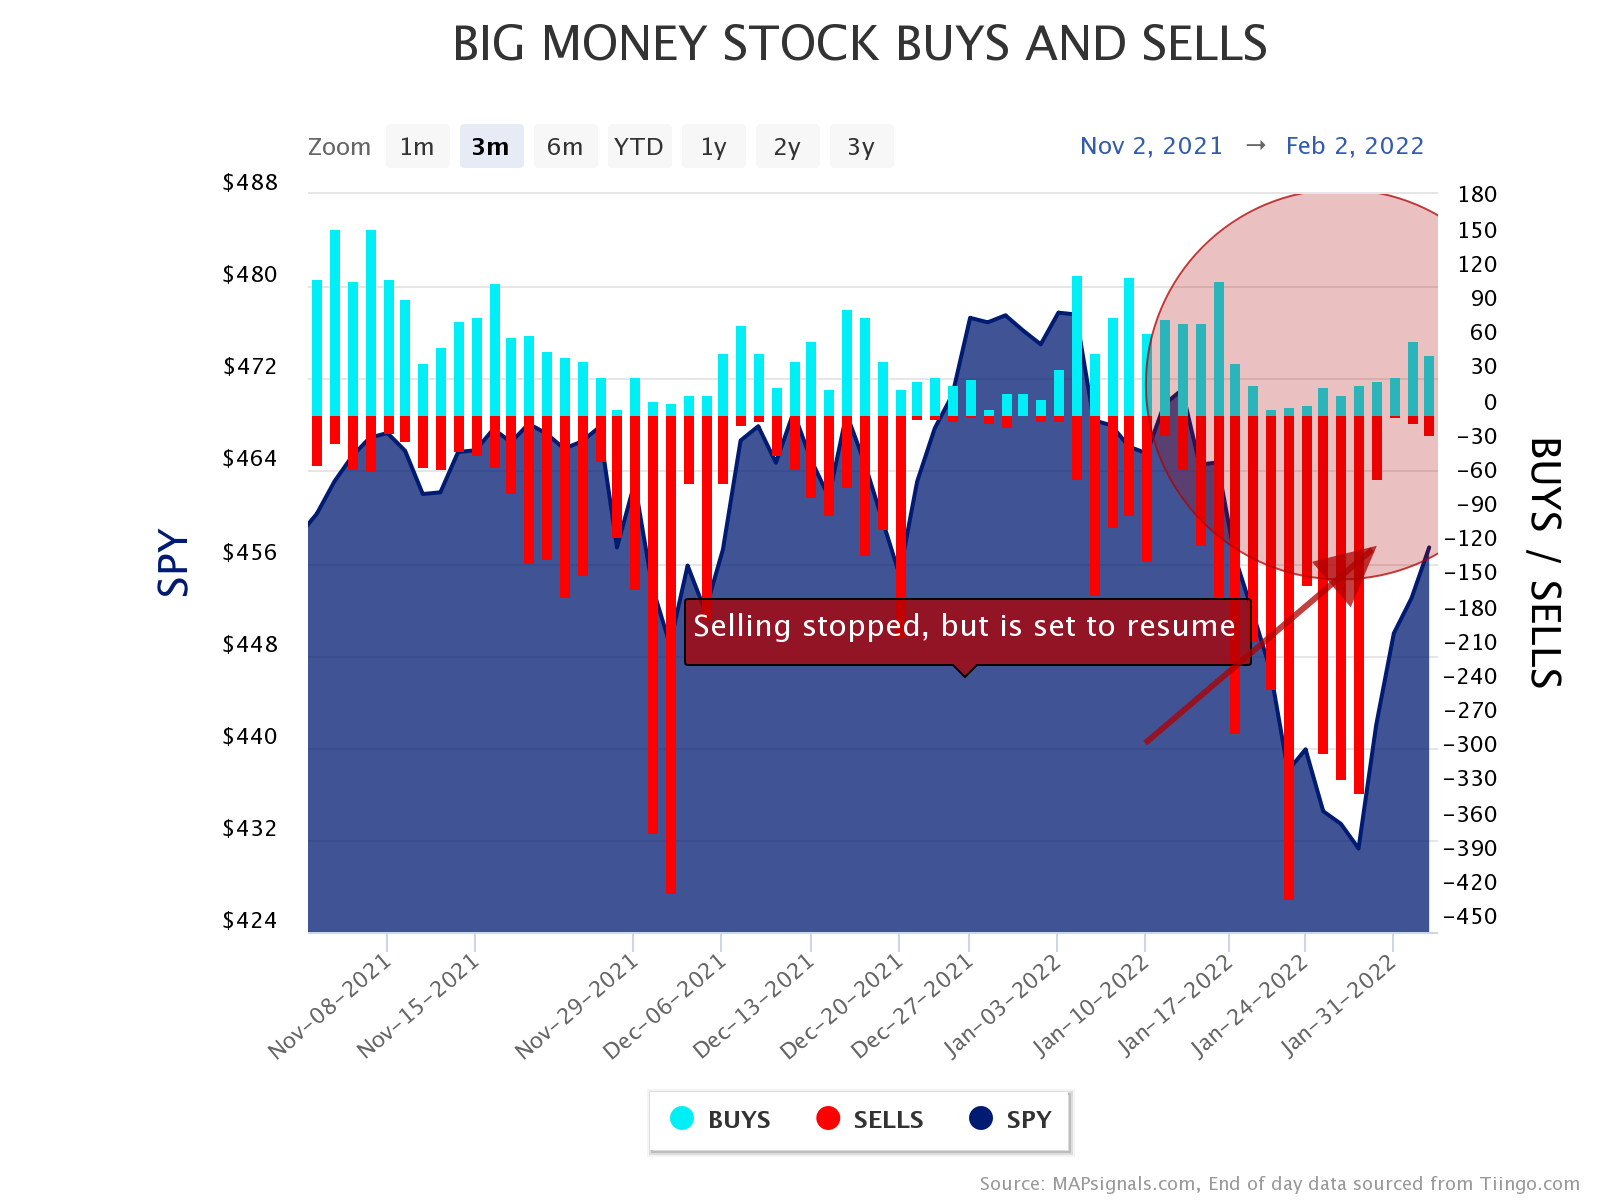
Normally I’d be jumping for joy. But, we’re missing one key ingredient for a real rally to take hold: buyers.
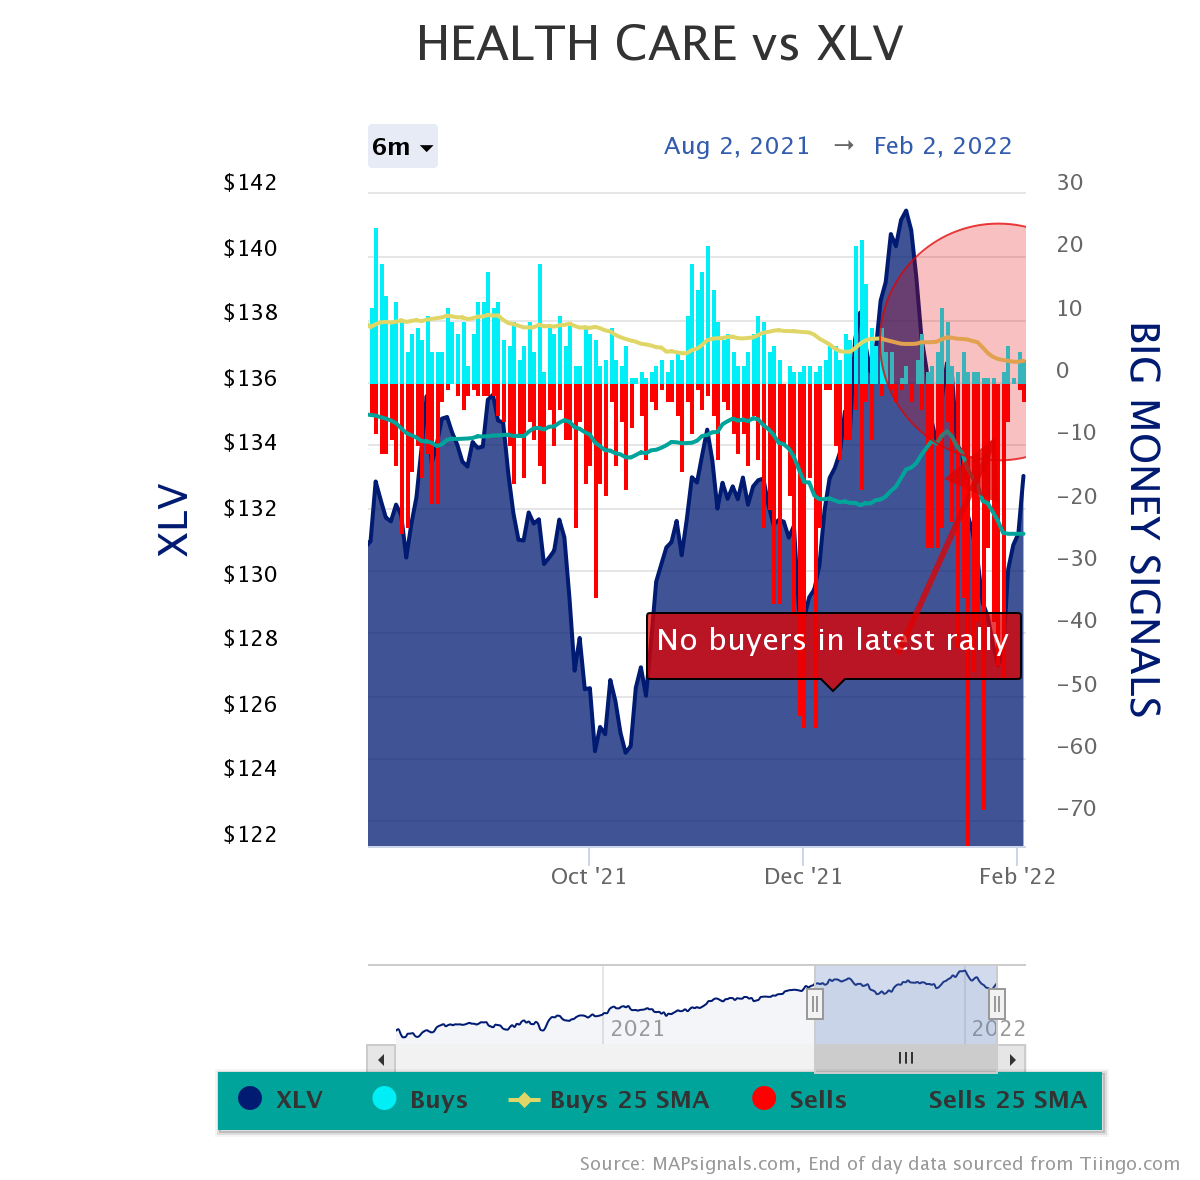
And looking at sectors tells the story. Technology, Healthcare, and Discretionary stocks bounced hard last week. But notice how there’s no buyers to speak of.
Up first is Technology: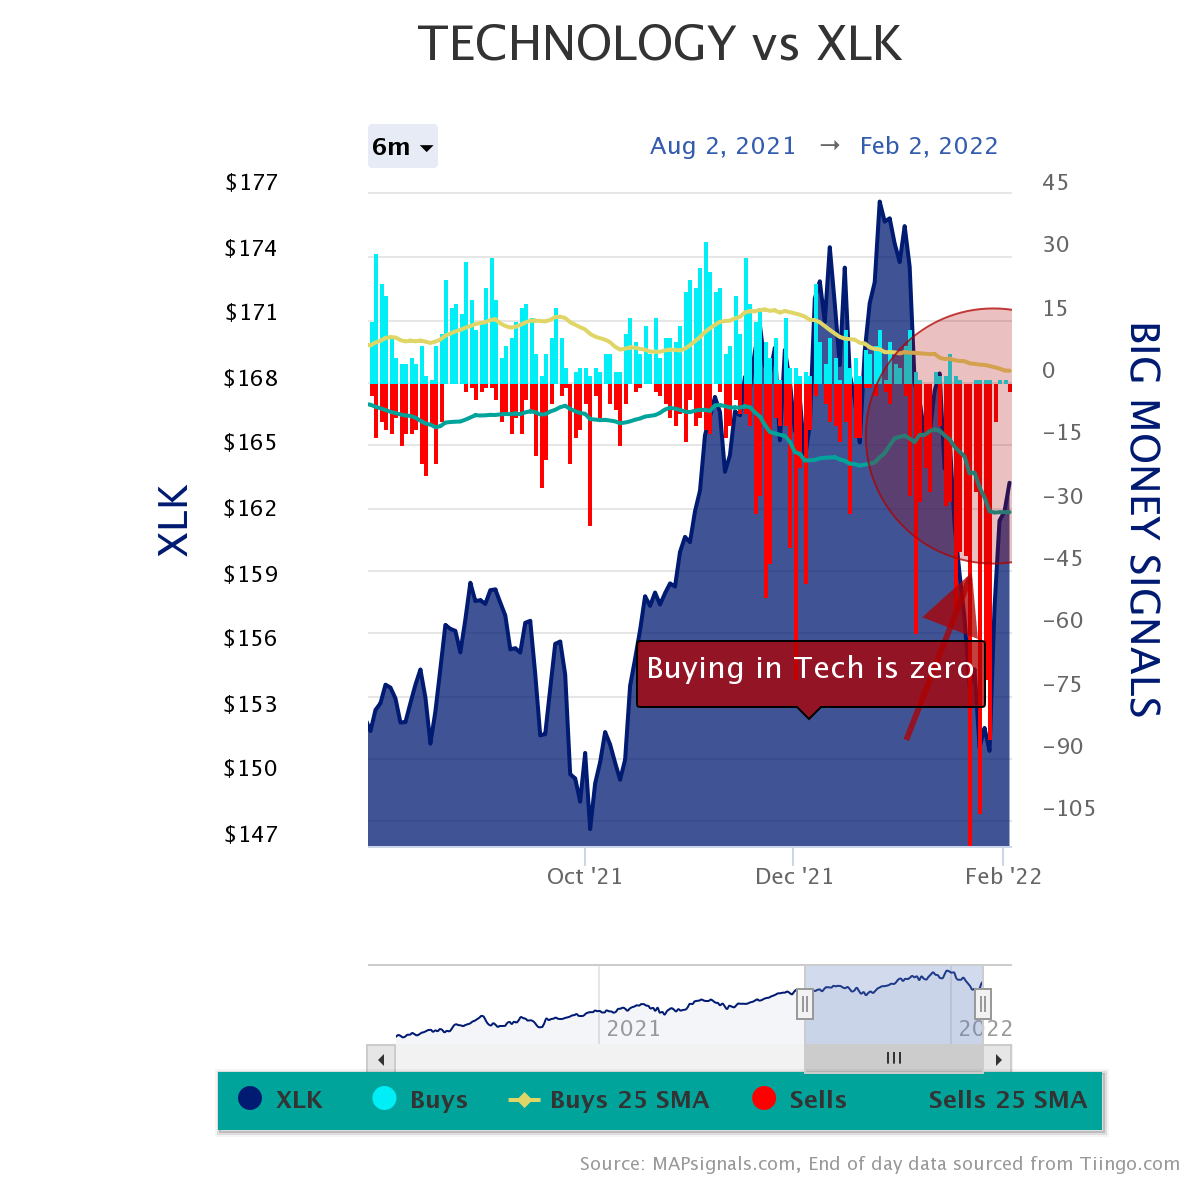
And the same happened in Healthcare too:
And the same action happened in Discretionary stocks:
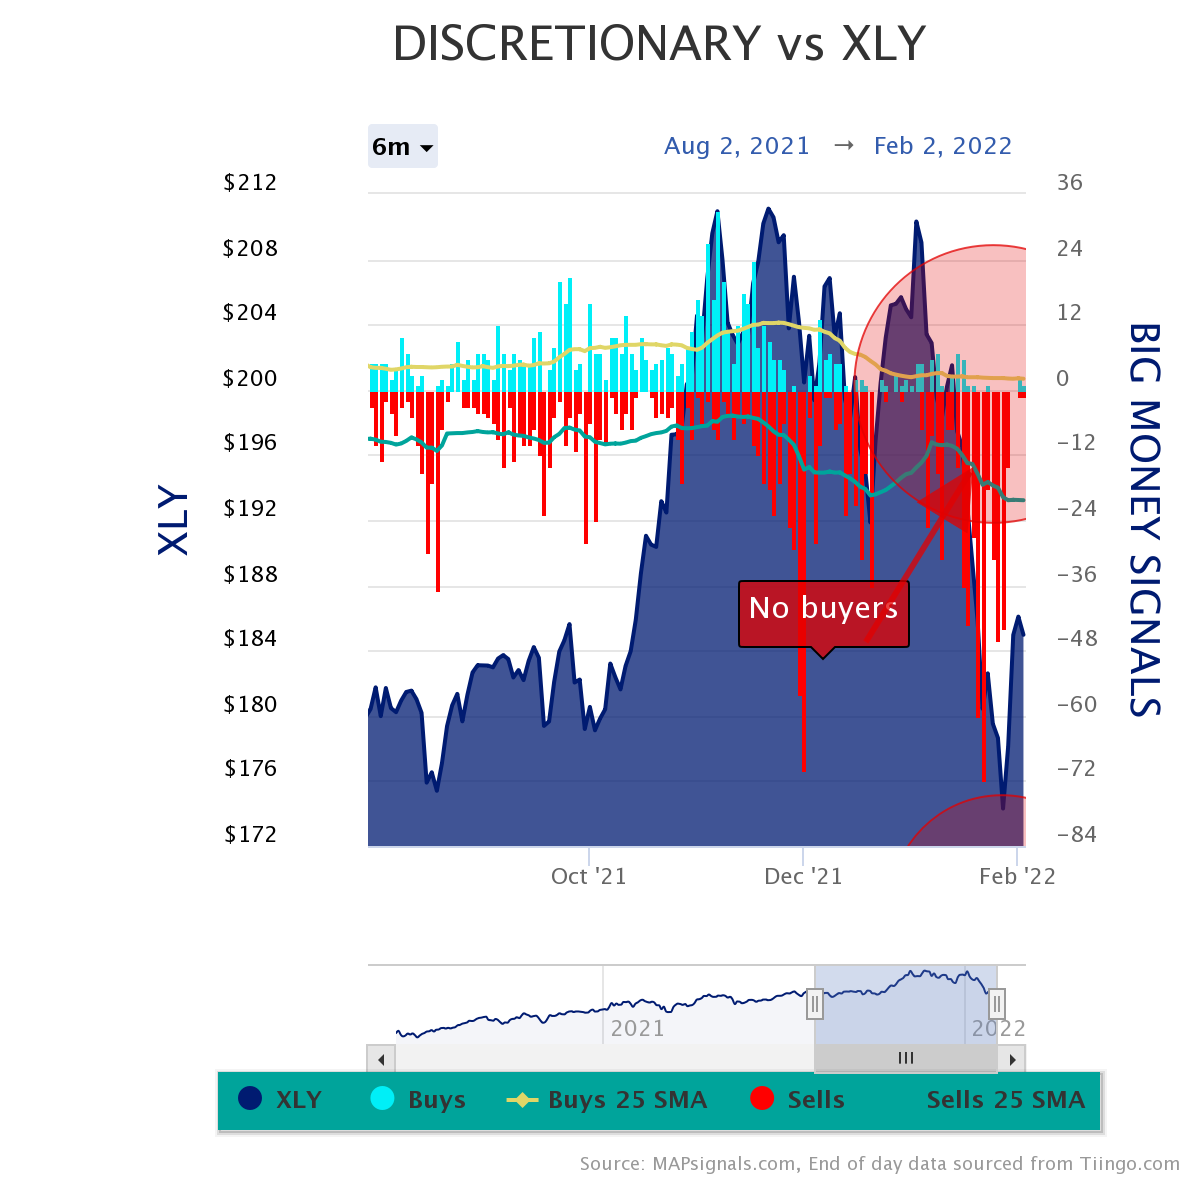
I’ve circled areas in red for a reason. If the rally was real, we’d be seeing green bars in these troubled areas.
To me, the coast isn’t clear. The data suggests Mr. Market isn’t done shaking out the weak hands.
But now let’s turn our frown upside down. I want to remind you of why you don’t want to give up on outlier stocks.
Shaking Out The Weak Hands
Now, I’m going to drive home the long-term bullish message. We’re all about 2 things at MAPsignals: first, we look for outlier stocks and second, we love following the Big Money.
Below is a basket of our Top 20 stocks from the second half of 2019 and the bottom ranked stocks. I picked this area to showcase for 2 reasons. First, many of the stock in this basket are down big right now and second I want to show how the basket performed heading into and out of the pandemic…the nastiest selloff in recent memory.
The electric blue line is the outlier portfolio, the dark blue is the S&P 500 (SPY ETF), and the red line is the bottom ranked stocks portfolio.
The left circle shows how no stocks were spared during the March 2020 pullback. This is important because I want you to see that we’ve seen nasty pullbacks before.
But also notice once the market sprung back, outliers resumed their dominance while the red portfolio sagged:
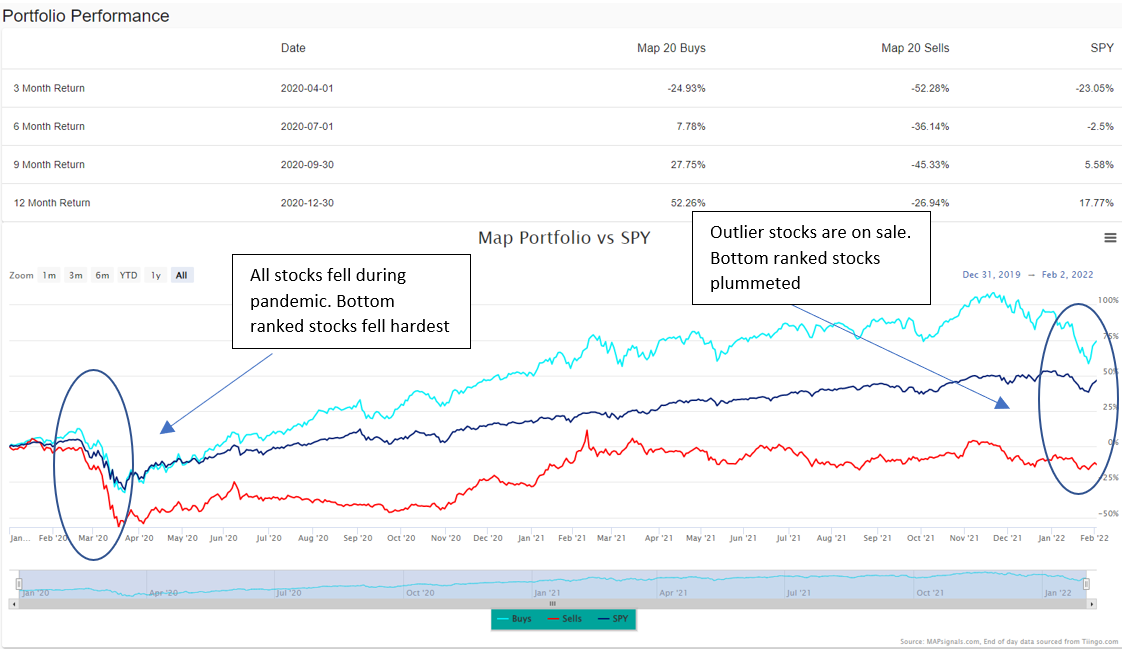
And off to the right is another circle. Clearly outlier stocks have pulled back massively recently. And herein lies the opportunity.
Mr. Market is still shaking out the weak hands. But, don’t let him shake you out of great stocks!
Last week I dropped in my game plan for an oversold market. I’m going to add it here today as a reminder of why we’re setting up for a monster leg higher once the bottom is formed:
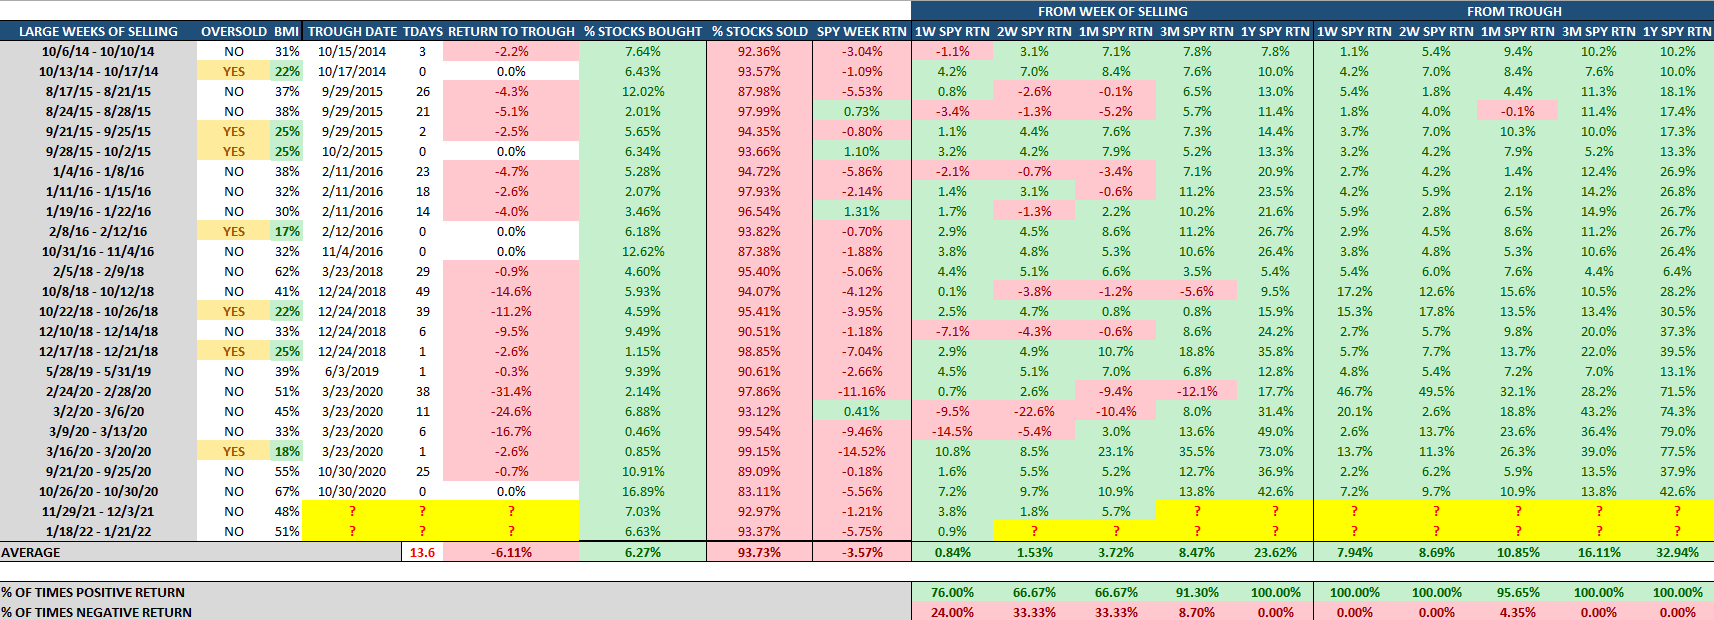
You can see that after selling of this magnitude hits, it’s uber bullish across the board.
Man, that’s a lot of green.
Let’s wrap up.
Here’s the bottom line: The latest rally in the market doesn’t have me convinced the selling is over. My bet is that Mr. Market will be shaking out the weak hands in the coming weeks. That’s the bad news.
The good news is that times like now are incredible opportunities. Great stocks will fly again!
If and when we reach oversold (25% in the BMI), it’s like being dealt pocket aces. I’ve learned to bet big when it triggers.
The last 2 times we went oversold were March 19th, 2020 and December 24th 2018. The markets then were ugly. Those were not times for weak hands.
And neither is now.
***And here’s our latest video: Best Oversold Stocks to Buy for February 2022. These are the times to focus on best of breed companies. Eventually the selloff will pass.
Make sure to follow our YouTube channel here so you never miss any of our videos.
Also, you can find our other videos here.