

Overbought Stock Market Playbook
by Lucas Downey All, Big Money Insights WeeklyMarkets flow like waves in the ocean, rarely in a constant state. The rhythm is cyclical, reaching crests and troughs.
Stocks are approaching the red zone. Here’s your overbought stock market playbook.
Most would agree that stocks are elevated. A year-to-date 16% rip in the S&P 500 has stunned the crowd. Even more impressive is the NASDAQ 100’s 39% climb.
Those that bought the dip in October are sitting on juicy gains, riding a tidal wave of inflows.
The question I hear a lot now is: When is this rally going to let off steam? The answer lies in data. The market is approaching its next mechanical hurdle: an overbought Big Money Index.
Today we’ll size up the current investing landscape. Then we’ll swim through history, gauging prior overbought periods and what it means for stocks going forward.
Let’s jump in.
Overbought Stock Market Playbook
The stock market is continuously ebbing and flowing. Money rushes from one extreme to the other, reaching peaks and valleys.
The past year has been a rollercoaster for investors, setting in motion 4 extreme pivot points. Below is our trusty Big Money Index (BMI) which plots institutional buying and selling.
I’ve circled the major overbought and oversold inflections over the past year. You’ll notice a handful of observations:
- 1. The past year has been very volatile, triggering 2 oversold signals and 2 overbought signals.
- 2. Each oversold signal prefaced a monster rally in stocks.
- 3. Each overbought signal prefaced a healthy pullback in markets.
- 4. We’re nearing an overbought reading, with the BMI sitting at 75% (80%+ is overbought):
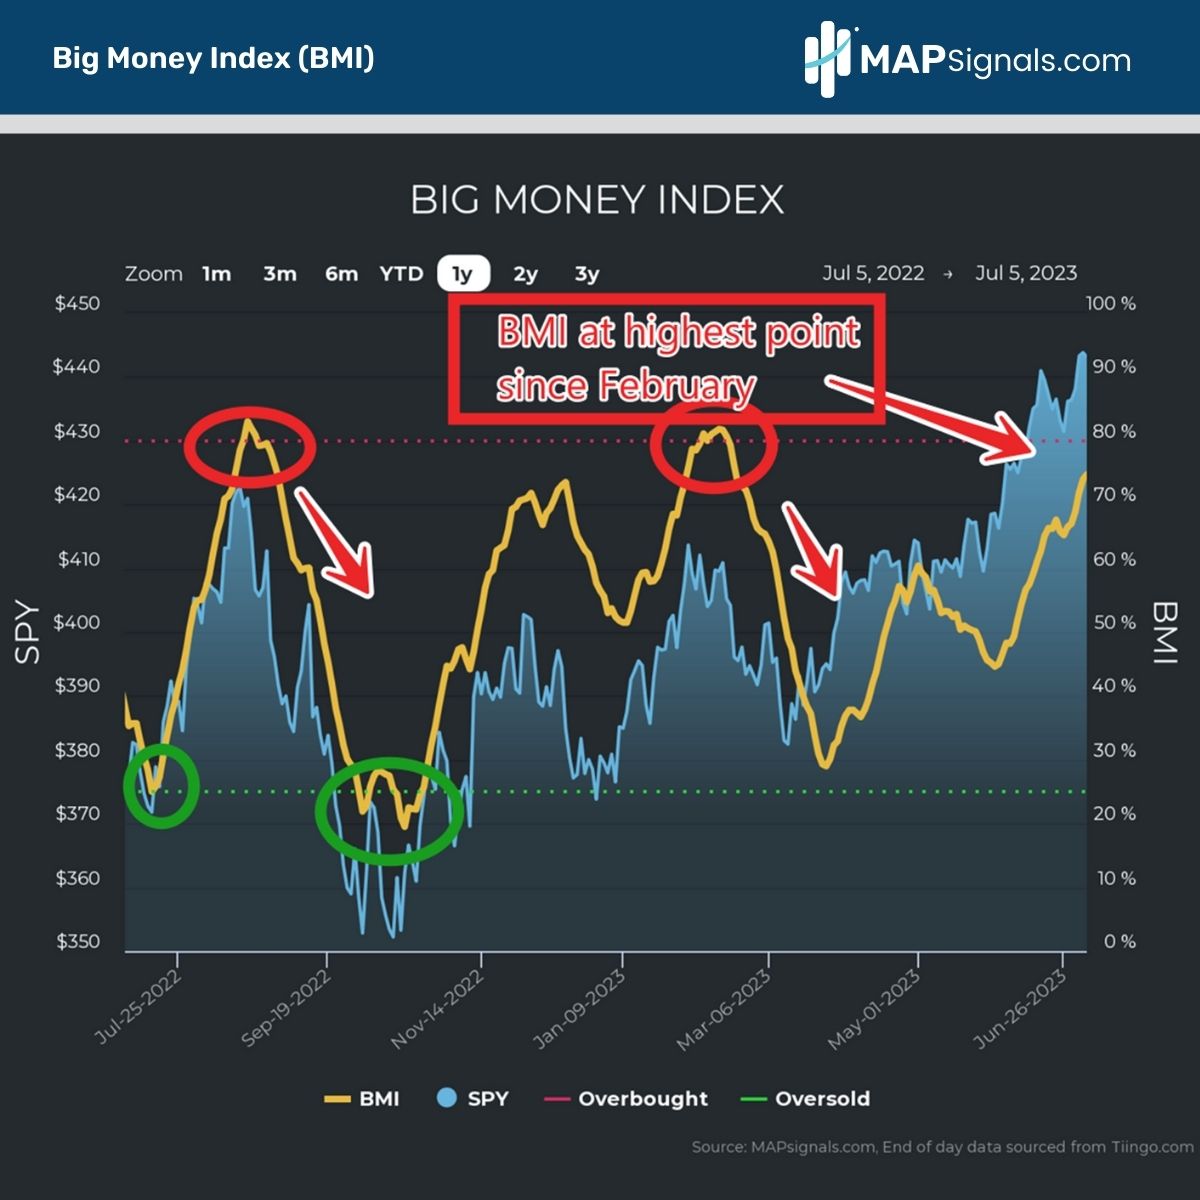
At first glance, these red zones appear to be death zones for stocks. As a reminder, back in August your sell signal to take profits worked like a charm. Stocks soon fell double digits.
So, is now the time to start fearing an incoming meltdown?
I think not. Last year was mired with high-inflation, ramping interest rates, and multiple capitulation days. Today’s backdrop is more of a tailwind for stocks: inflation has peaked, rising rates are nearing the end, and earnings are holding up better than feared.
Hey, we might even dodge the most telegraphed recession in history!
But I can’t rely on my feelings and thoughts when it comes to the market. You shouldn’t either. This is where data comes in to give us a solid framework.
Below is a historical study of all overbought periods since 2009. Of the 28 instances, history doesn’t paint a doomsday scenario. Once we break into the red zone, we should expect the following:
- The BMI tends to stay overbought for 25 days.
- A month later, the S&P 500 is muted with a gain of .2%.
- 12-months later, the market ramps +13.1%:
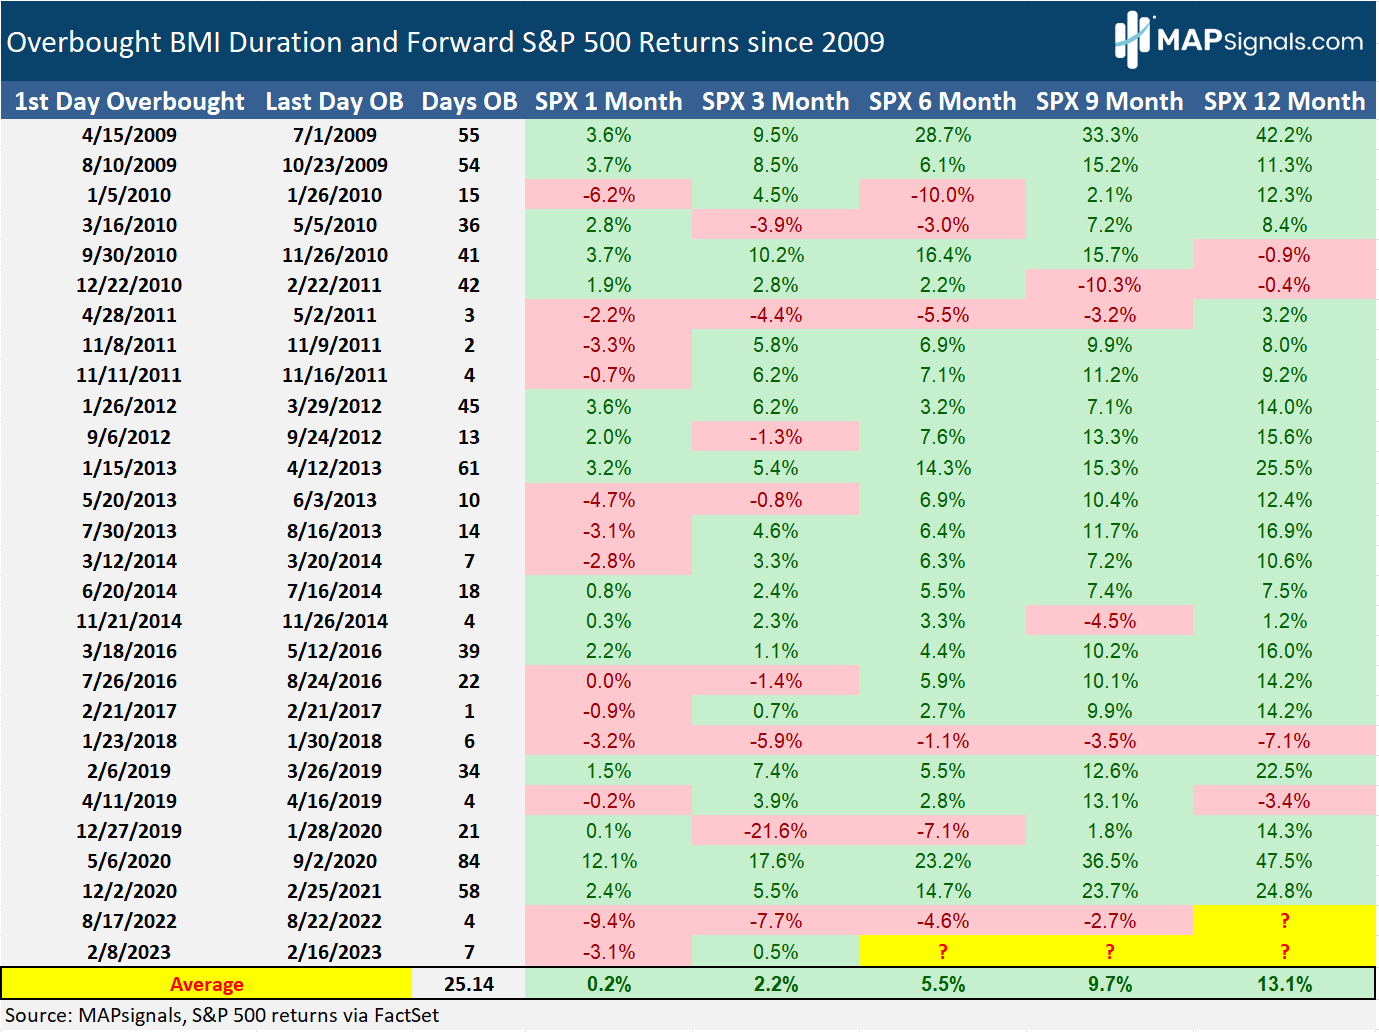
Based on my calculations, we could reach overbought as soon as 1-2 weeks. Only time will tell. But don’t fret, history doesn’t tell us to run for the hills. On average, stocks are green 1-12 months out.
The overbought stock market playbook is simple. Use any weakness as a great buying opportunity. New highs will be here before you know it.
More importantly, focus on the highest-quality stocks under massive accumulation. The sea-change since last summer has many small-cap companies surging higher week after week.
Don’t let an overbought market shake you out of amazing companies.
Let’s wrap up.
Here’s the bottom line: Stocks are overheating. The Big Money Index (BMI) is slowly approaching overbought levels. On average, you can expect stocks to remain in the red zone for 3-4 weeks.
Additionally, assume modest to flat returns in the 4-weeks post an overbought breach.
Don’t fear an overbought market. Welcome it! A healthy market breather is normal and warranted!
Become a MAPsignals subscriber and follow the waves of money in real-time. If you’re a serious investor or manage money, it’ll provide insights you won’t get anywhere else.
Have a great week, everyone!