Market Flows: Midterm History Points to October
by Jason Bodner All, Big Money Insights Weekly, StocksThere Are Indexes and There Are Markets
Some of the biggest waves on Earth never reach the surface.
In the Luzon Strait, between Taiwan and the Philippines, tides push cold, heavy water over two seafloor ridges. That sets off waves deep inside the ocean that can grow 550 feet tall. That’s higher than the Washington Monument.
Ships sailing overhead barely notice because on the surface, these giant waves lift the water by less than an inch. Scientists learned to track them using years of satellite data. An MIT researcher pointed out how you can filter out the noise with enough data.
That’s the stock market right now. The surface looks calm. Underneath, giant waves are rolling.
The Index Is Not the Market
The S&P 500 closed Friday at 7,743. That’s less than 1% from its all-time high. The Nasdaq composite set back-to-back records on Monday and Tuesday.
But of the 5,220 stocks we track at MoneyFlows, 2,638 of them sit 20% or more below their 52-week highs. That’s 50.5% of stocks in bear market territory. In tech, it’s 69%.
There are indexes and there are markets. The index is led by a handful of mega-cap stocks. The market is thousands of stocks. Right now, they’re telling two different stories.
And it is under the surface where you can read flows data. That shows us which stories big institutional players are betting on and where they’re moving their money.
Money Is Leaving Anything That Pays a Yield
This week, bond yields surged. The 10-year Treasury hit 5.2%, its highest level since 2007. The 30-year topped 5.5%, which was last seen in 2004.
When safe bonds pay that much, anything that pays a yield must compete. So, investors sold whatever looked like a bond.
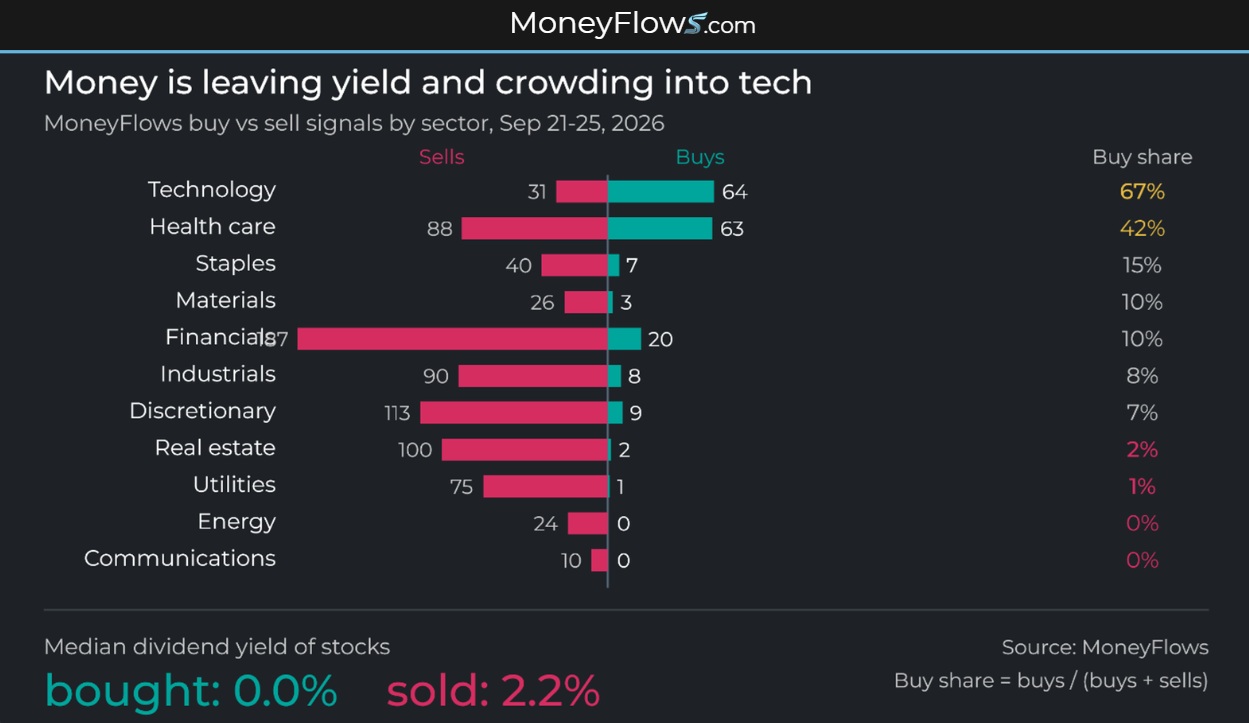
Exchange-traded funds focused on bonds saw 173 outflows and just 2 inflows. Real estate equities saw 92 outflows and zero inflows. Utilities had 74 outflows and 1 inflow. Banks had 73 outflows. Insurers had 46.
One stat says it all: the median stock bought this week paid no dividend. The median stock sold yielded 2.2%.
Where did the money go? Technology was the only sector with more buying than selling – 64 inflows to 31 outflows. The buying centered on AI chips and software as AMD crossed $1 trillion in market value on Monday.
But dig deeper within tech and we see a split market. “Only” 34% of mega-cap tech stocks are in a bear market whereas for micro-cap tech, it’s 88%. Big Money is picking winners, not buying the whole sector.
Health care shows a similar split. Diagnostics and lab tools drew 43 inflows and zero outflows. Drug developers took 68 outflows against 9 inflows.
The financials sector is the strangest story. It has the healthiest breadth of any sector, with only 21% of constituents in a bear market. Yet it had 187 outflows, more than any other sector. The market’s safest shelter is being sold, which could indicate a broadening of outflows.
Hotels, restaurants, and leisure stocks had 67 outflows and no inflows. Gas near $4.50 and mortgage rates at 7.37% will do that.
Energy got zero inflows, even with oil near $100. Big Money seems to be betting the Strait of Hormuz reopens.
Headlines Are Loud. Flows Are Clear.
This was a noisy week. Prediction markets gave Democrats 66% odds to win the Senate. Iran offered to reopen Hormuz within a week, with conditions. The U.S. and China extended their trade truce, but only to Jan. 10. Traders now see a 64% chance of interest rate hikes again in October.
But the flows tracked the bond market almost day by day. Selling spiked Wednesday and Thursday as yields jumped. It eased Friday when oil fell.
Friday also broke a streak of nine straight sessions with 100 or more outflows. It ties for the fifth-longest streak since 1990. In the 10 prior streaks of eight sessions or more, the S&P 500 fell every time. This time it rose. That’s the index hiding the market.
The Market Underneath Is Washing Out
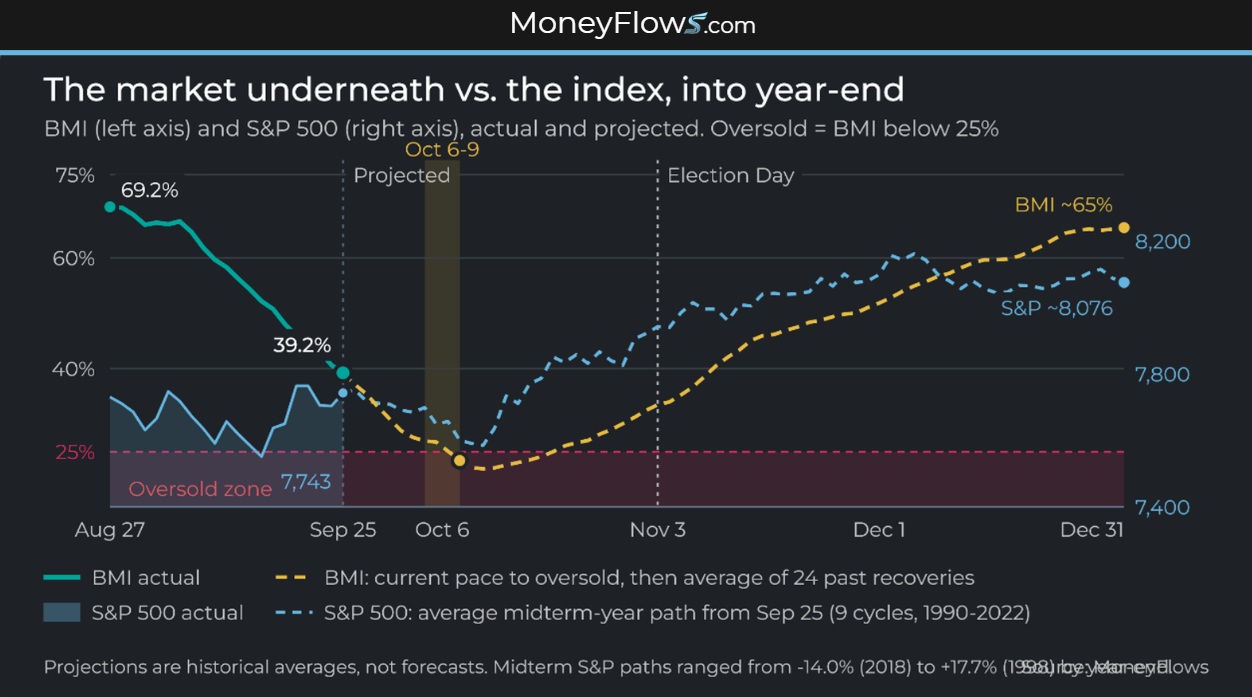
Our Big Money Index (BMI) tracks buying versus selling. Above 80% is overbought. Below 25% is oversold.
The BMI fell from 69.2% in late August to 39.2% on Friday. At this pace, it reaches oversold around Oct. 9.
Some of that drop is baked in. Strong buying days from late August are rolling out of the average. Even if buying and selling balanced out next week, the BMI would still slip to about 35%.
There’s no guarantee it reaches oversold. If selling eases, it could bottom in the high 20s. In 24 oversold readings since 1990, the S&P 500 was never within 5% of its high. If it happens now, it would be a first.
Market Flows: Midterm History Points to October
Midterm-year Septembers and Octobers are usually rough. Since 1990, seven of nine midterm market troughs landed between Oct. 2 and Oct. 15. That’s why Oct. 6 is my projected low for the market underneath the indexes.
What came after was strong. From each midterm year’s BMI low, the S&P 500 averaged a rally of 15% six months later and 21.2% a year later. It rose every time. Four out of nine years never even reached oversold.
One year did deviate, though. In late September 2018, the S&P also sat near a record, the Federal Reserve was hiking interest rates, and a China trade fight was raging. Stocks fell 14% by the end of the year.
But the difference is timing. Back then, the BMI was still 64.9%. The selling hadn’t started yet. Today the BMI is at 39.2%, and half of all stocks are already in a bear market. These waves have been rolling for weeks.
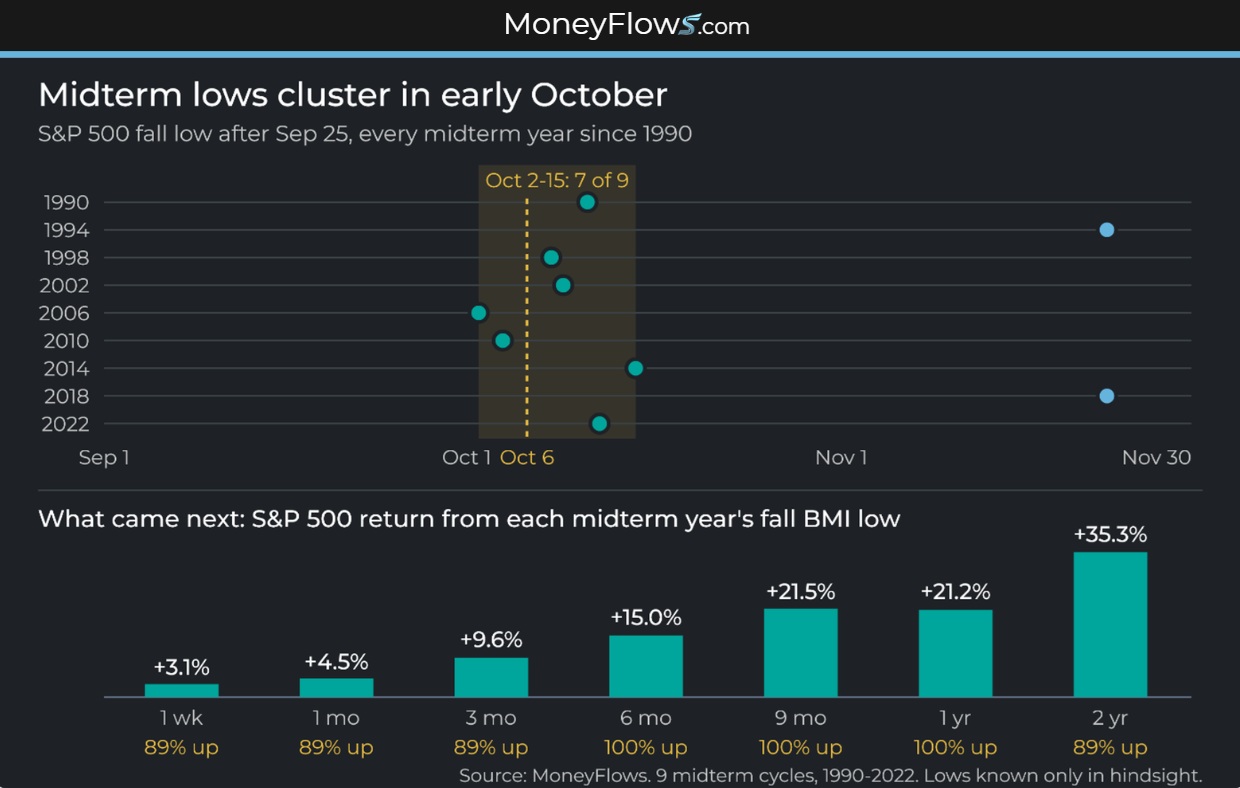
Again, the index looks calm, but the market underneath sustained real damage. The data says, however, that damage is closer to its end than its beginning. When the underlying market finishes washing out, history says the index and the market tend to rise together.
While indexes look great, your brokerage statement may not. History says hang in there.
As Philosopher Lao Tzu said, “Who can make the muddy water clear? Let it be still, and it will gradually become clear.”
MoneyFlows finds the winners early…bringing them to you.
If you’re a serious investor or money manager, get started NOW.
Our PRO subscription allows you to spot daily flows and access our weekly Outlier 20 report.
This is the report that has found EVERY SINGLE ONE of our Outlier stocks.
Enjoy a click-through experience unlike anything out there.
Professional money managers and RIAs looking for additional portfolio solutions including ETF flows & ranks and your own Portfolio Tracking tools, please reach out about our Advisor Solution and Emerging Advisor Program.
Have a great week!
***Lastly, join me LIVE, October 5-7, 2026, at the MoneyShow TradersEXPO in Orlando.
You don’t want to miss this! Click the image below to reserve your spot.