

Industrial Sector Capitulation is a Buy Signal
by Lucas Downey All, Big Money Insights Weekly, Stocks2025 is turning out to be choppier than the last 2 years.
DeepSeek fears saw equities plunge…now the latest economic worries hit real world sectors.
Heavy rotations were spotted the last 3 days. And that’s good news.
Industrial sector capitulation is a buy signal.
I’ve said it before and I’ll say it again. Money rarely leaves markets…it rotates.
While cap-weighted indices were flogged the last few days, under the surface told a different, more constructive narrative.
Capitulation was spotted in 2 areas as money shifted to “safer” defensive groups. Today, we’ll highlight the biggest pain point for equities: Industrial stocks.
These market gyrations, while unsettling, offer a unique window into a strong oversold signal.
Money flows help you spot it.
Forced Selling Hits Markets
If your portfolio is hurting right now, odds are you’re holding industrial and growth stocks. Those pockets have felt much of the brunt lately.
Below shows what’s happening under the surface.
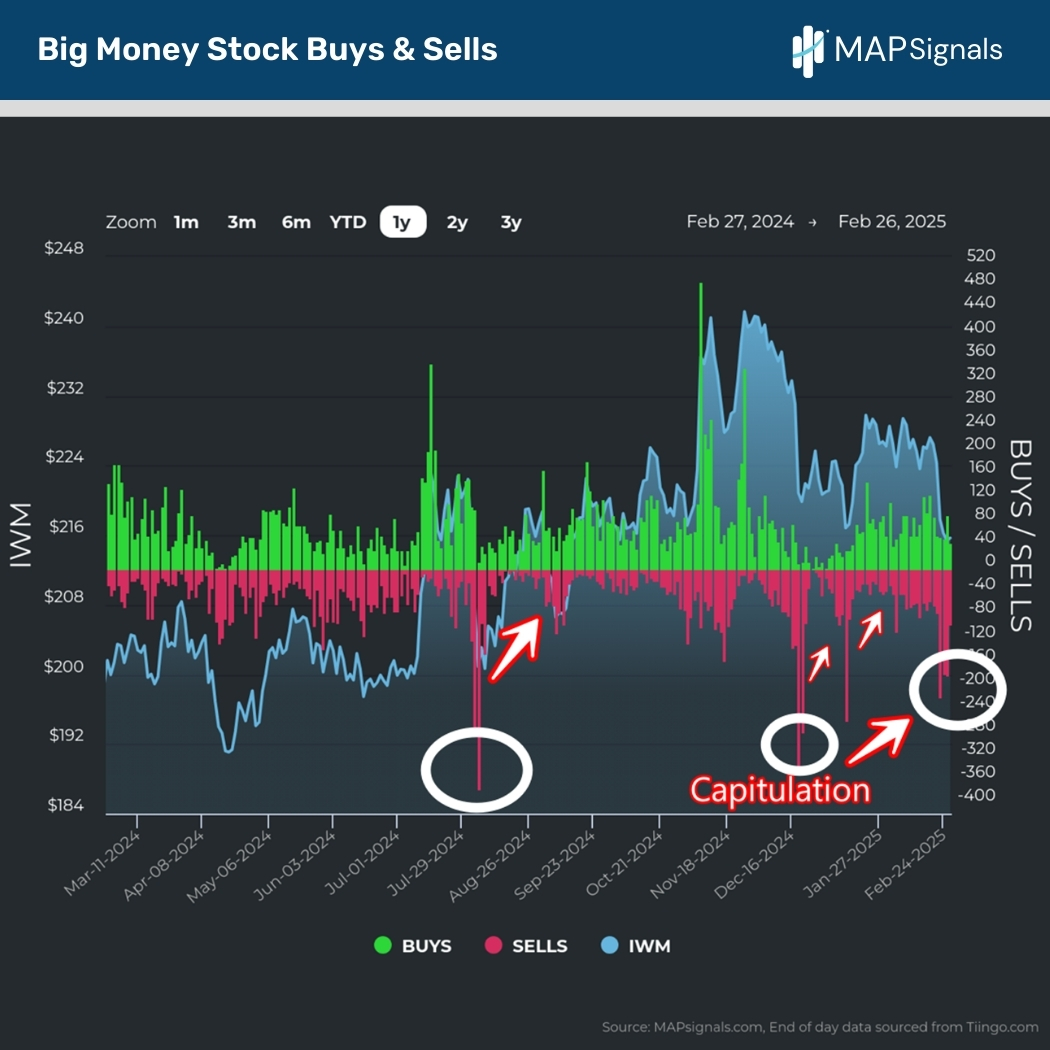
Over the last 3 trading sessions, outflows outnumbered inflows by a ratio of nearly 3:1 with 648 equities liquidated and 232 accumulated.
I’ve circled that action and prior similar risk-off moments:
When we dive deeper, we see where the sector pain resides.
Below unveils the 3-day sell signals broken down by sector. Nearly 40% of the outflow pie is focused on industrial and tech stocks:
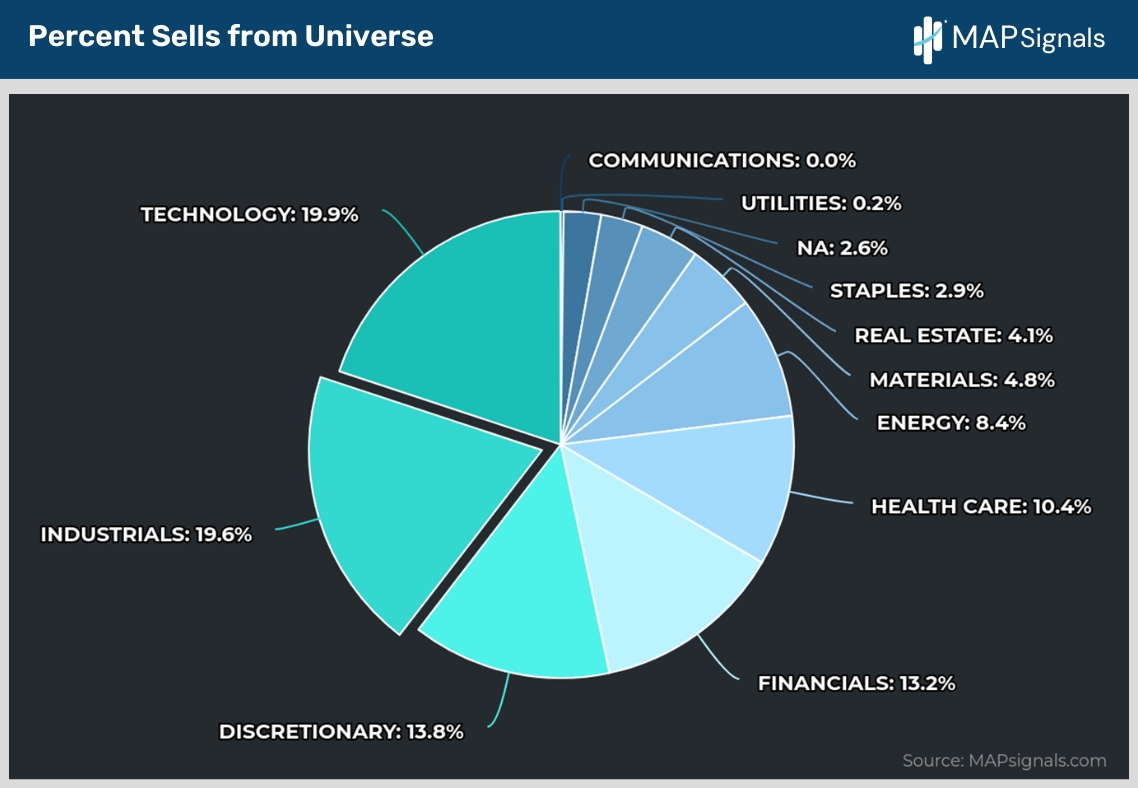
But it’s important to note that the industrial sector is a bit smaller in count than tech. What that means is the level of selling is actually more concentrated there when you normalize the flows.
This is where the opportunity arises.
Industrial Sector Capitulation is a Buy Signal
Friday and Monday were big sell days for the industrial patch. In fact, those 2 days accounted for the highest 2-day outflow count in over a year.
Note the recent large red bars circled in white and the prior similar capitulation event circled on the left:
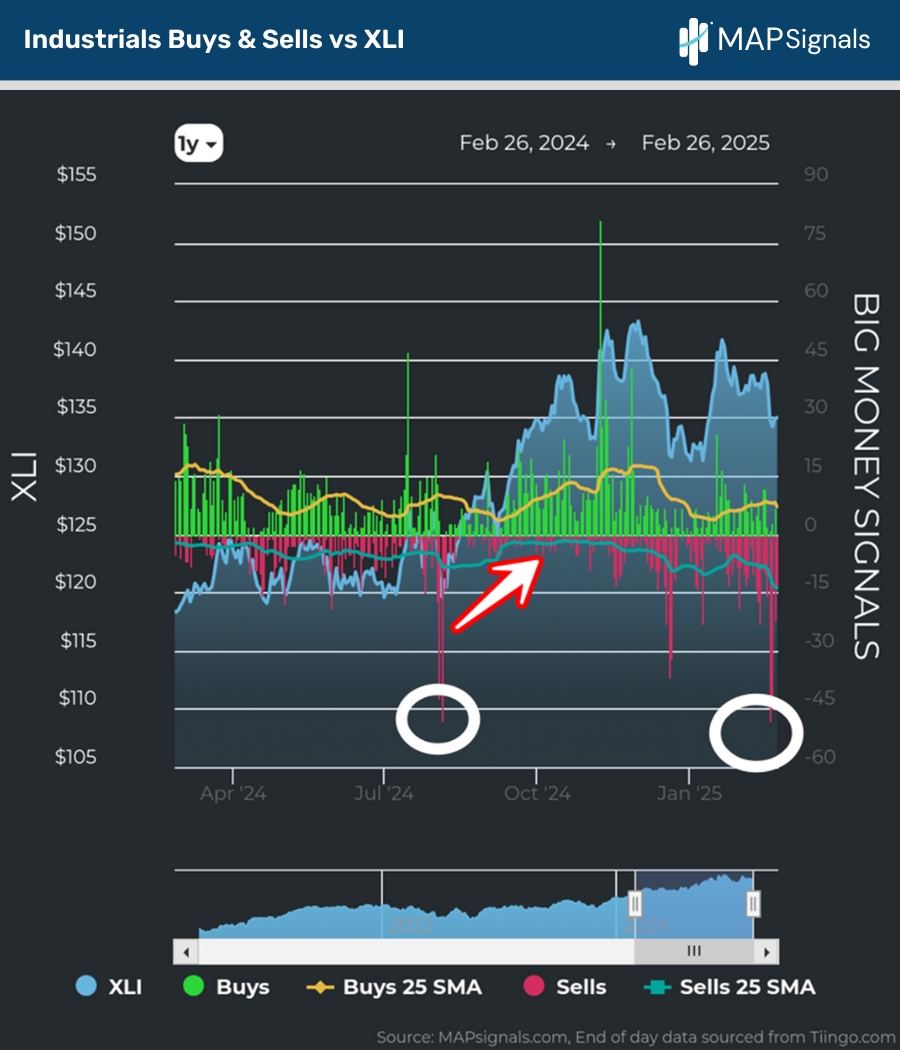
If you’re feeling anxious about this level of destruction – stop. Using the eyeball test, it appears that these big forced-selling events are bullish.
At MAPsignals, we don’t rely on our eyes for signals. We look at cold hard data and facts.
Here’s where you’ll want to hug your bearish buddies.
On Monday, we reached out to our members with a powerful signal study on what comes after these rare sell days…over the past 10 years, it’s been a wonderful time to pick away at all-star stocks getting unfairly punished.
For PRO members, check out that study below. Importantly, today we are including 6 high-ranking industrial stocks that actually say institutional inflows during the sell-off.
Owning leaders in a sector that is primed for a reversion is a great strategy.