
Big Money Index (BMI) Hits Oversold: Market Outlook
by Jason Bodner All, Big Money Insights Weekly, StocksNear Manaus, Brazil, two giant rivers meet but don’t mix.
The Rio Negro is dark as coffee, warm, and slow. The Solimões River is sandy, cool, and moves two or three times faster. For about four miles, they flow side by side in the same channel, one black and one tan, with a line between them you can see from space. They don’t fully blend until about 38 miles downstream.
That’s the stock market right now: two rivers in one channel.
The indexes are one river. On Oct. 6, the S&P 500 closed at a record 7,818.93, and the Nasdaq composite hit a record too. The market underneath is the other river. It’s been running cold and heavy for a month.
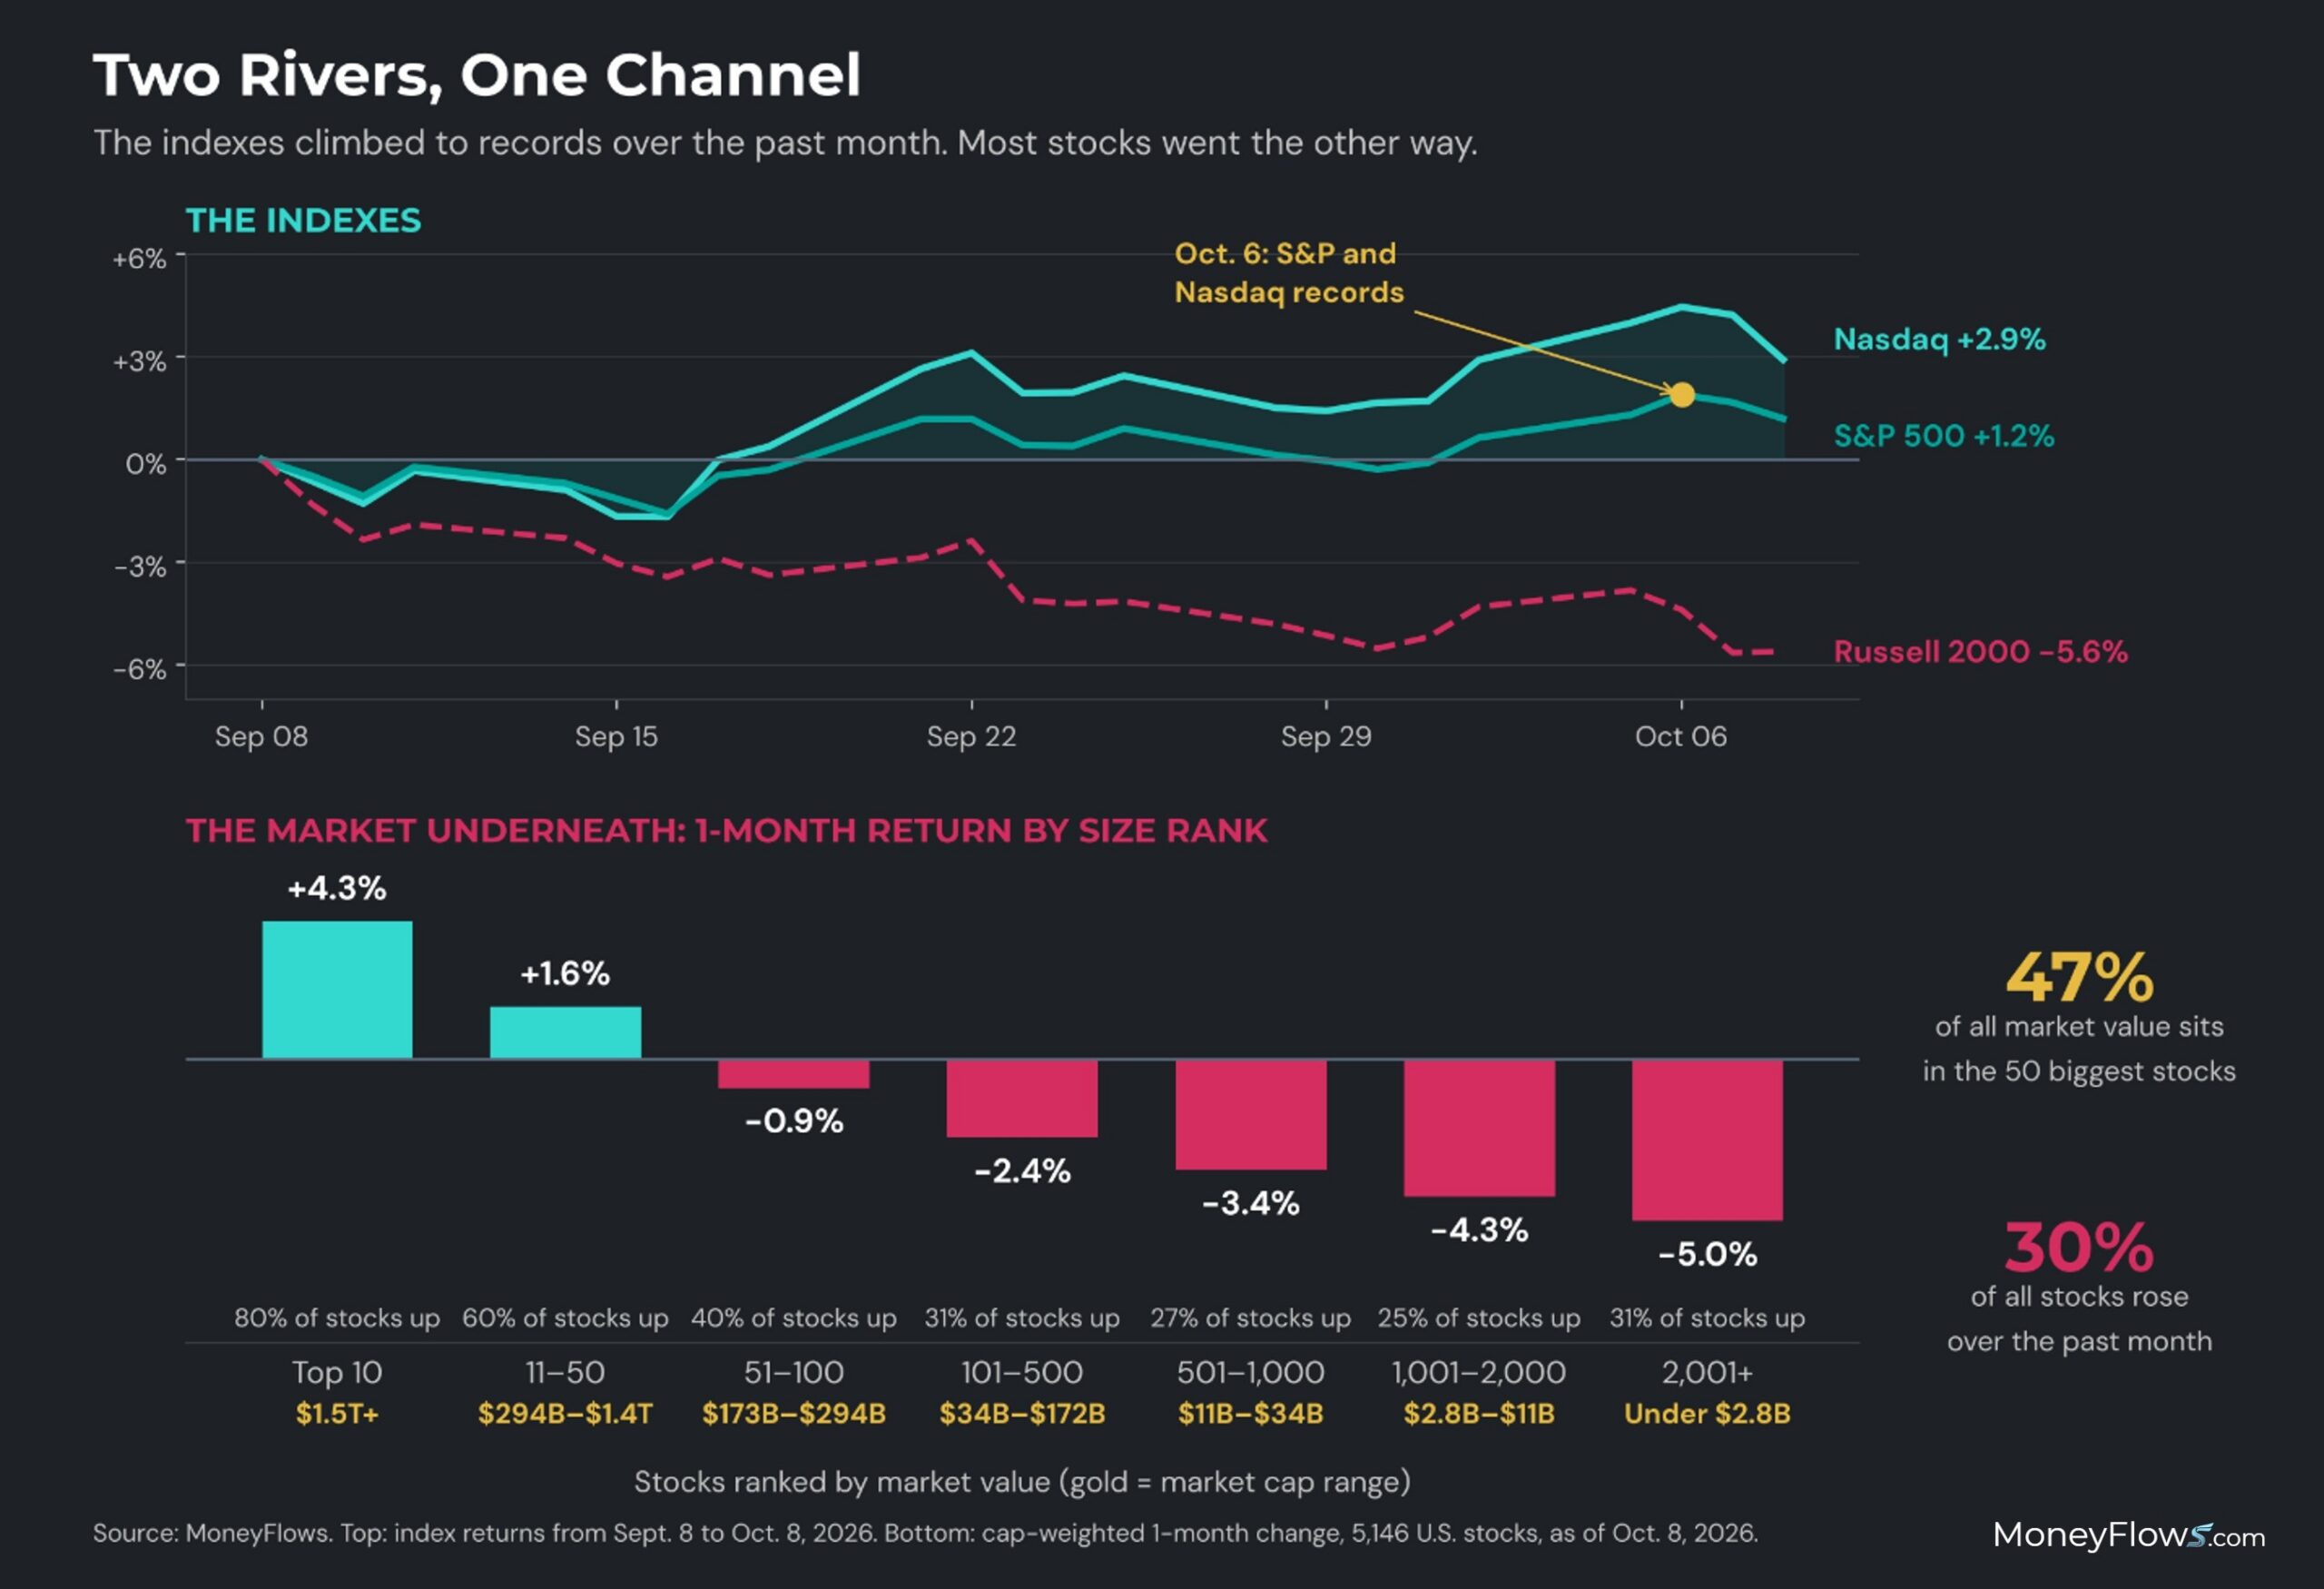
Oct. 6 was also the best day for the market underneath in weeks. We flagged Oct. 6-14 as the likely low window for the market under the indexes, and Oct. 6 fit the script. Outflows dropped to 78, the lightest day since the selling began on Sept. 9. Outflows from exchange-traded funds nearly vanished, with just three. Stocks were climbing out of bear territory from the top of the cap ladder down.
Then the bond market spoke up.
On Oct. 7, the 10-year Treasury yield touched 5.35%, its highest level since 2002. The 30-year hit 5.70%. The next day, a report questioning OpenAI’s revenue numbers spanked chip stocks, and the Nasdaq fell 1.25%. Oil jumped 3.6% on new attacks on shipping near the Strait of Hormuz.
Outflows ensued, spiking back to 186 on Wednesday. By Oct. 8, 253 stocks hit new 52-week lows. But 154 stocks hit new 52-week highs too. The equal-weight S&P 500 rose 0.6% while the Nasdaq fell. That’s not a market panicking. That’s two rivers moving at different speeds.
So, was Oct. 6 the low? I think it was the turn, and this week is the retest. Small-cap stocks never got the repair, and everything else gave some back. Lows rarely happen on one clean day.
Big Money Index (BMI) Hits Oversold: Market Outlook
Our Big Money Index (BMI) closed at 25.1%, essentially at the 25% oversold line. Here’s what makes this moment rare. The BMI has never been this low with the S&P 500 within 2% of its high. Since 1990, the closest an oversold reading came was in April 1997, with the S&P 500 5.3% below its high. A year later, the S&P 500 was up 40%.
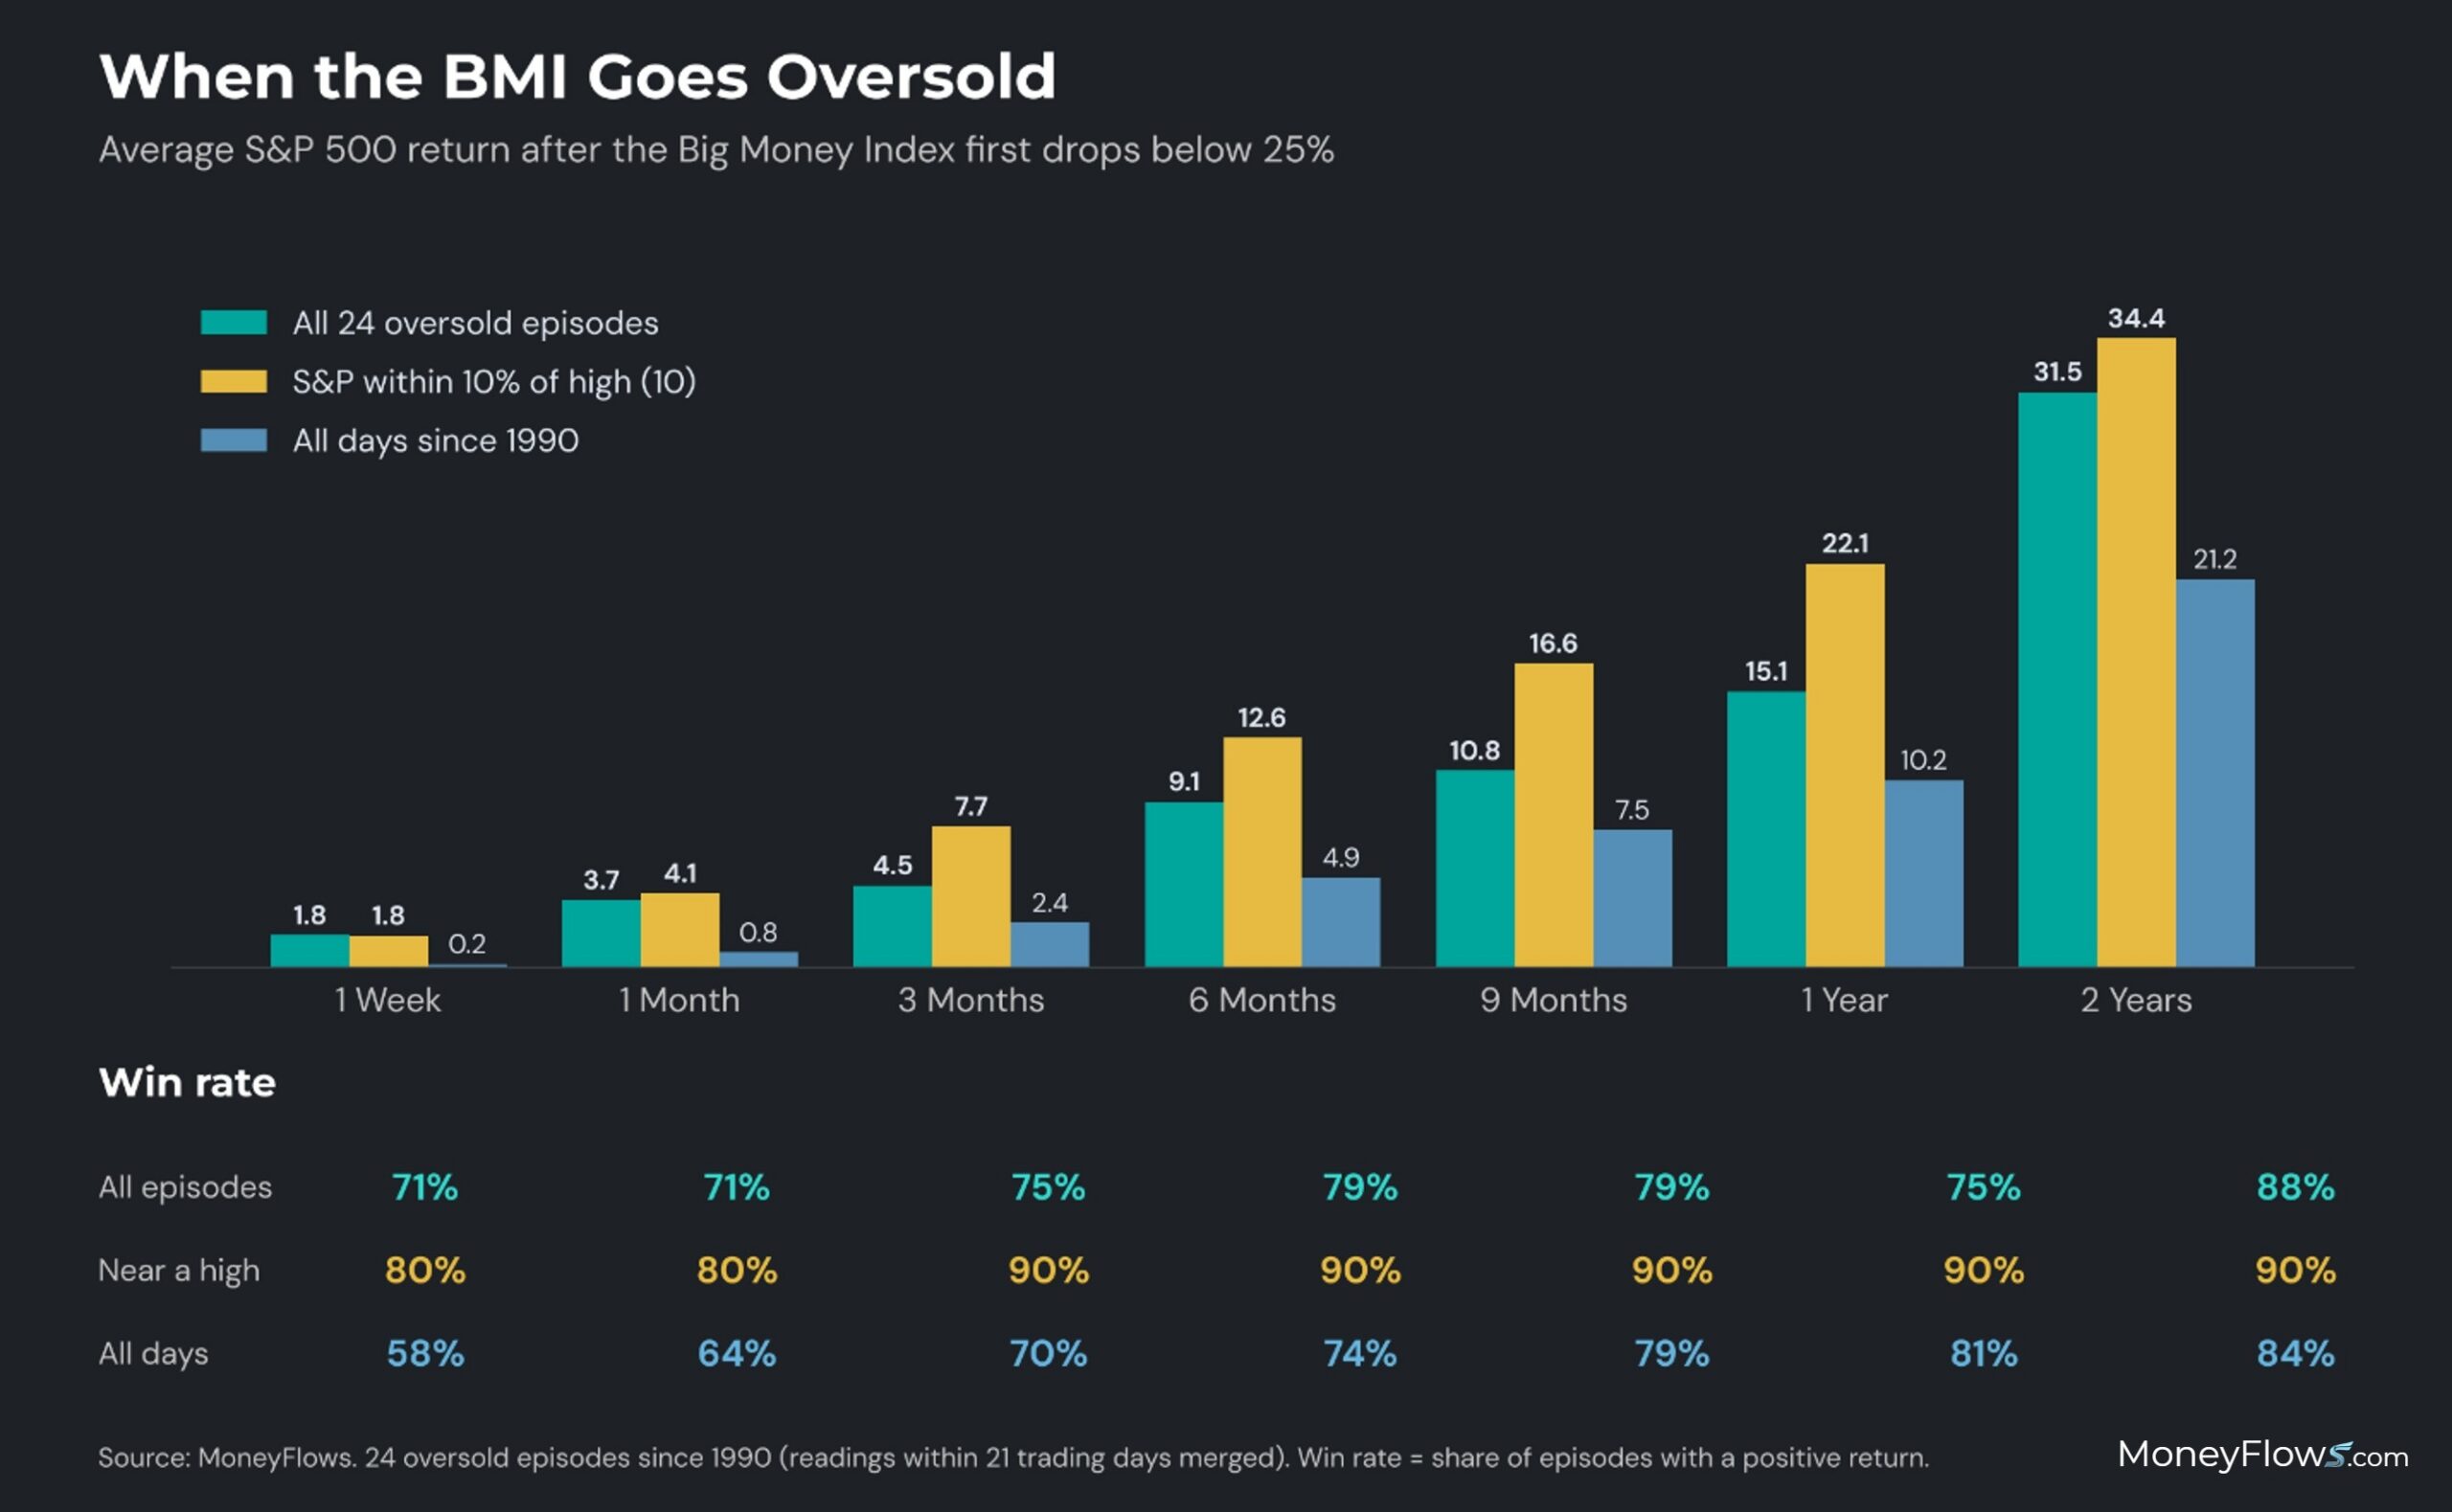
Oversold itself is uncommon. Since 1990, the BMI has gone oversold just 24 times, about once every year and a half. The last time was October 2023, three years ago. So, what happens next? Across all 24 episodes, the S&P 500 was higher a year later 75% of the time, averaging a 15.1% gain. When the S&P 500 was within 10% of its high, like now, it was higher a year later nine out of 10 times, averaging a jump of 22.1%.
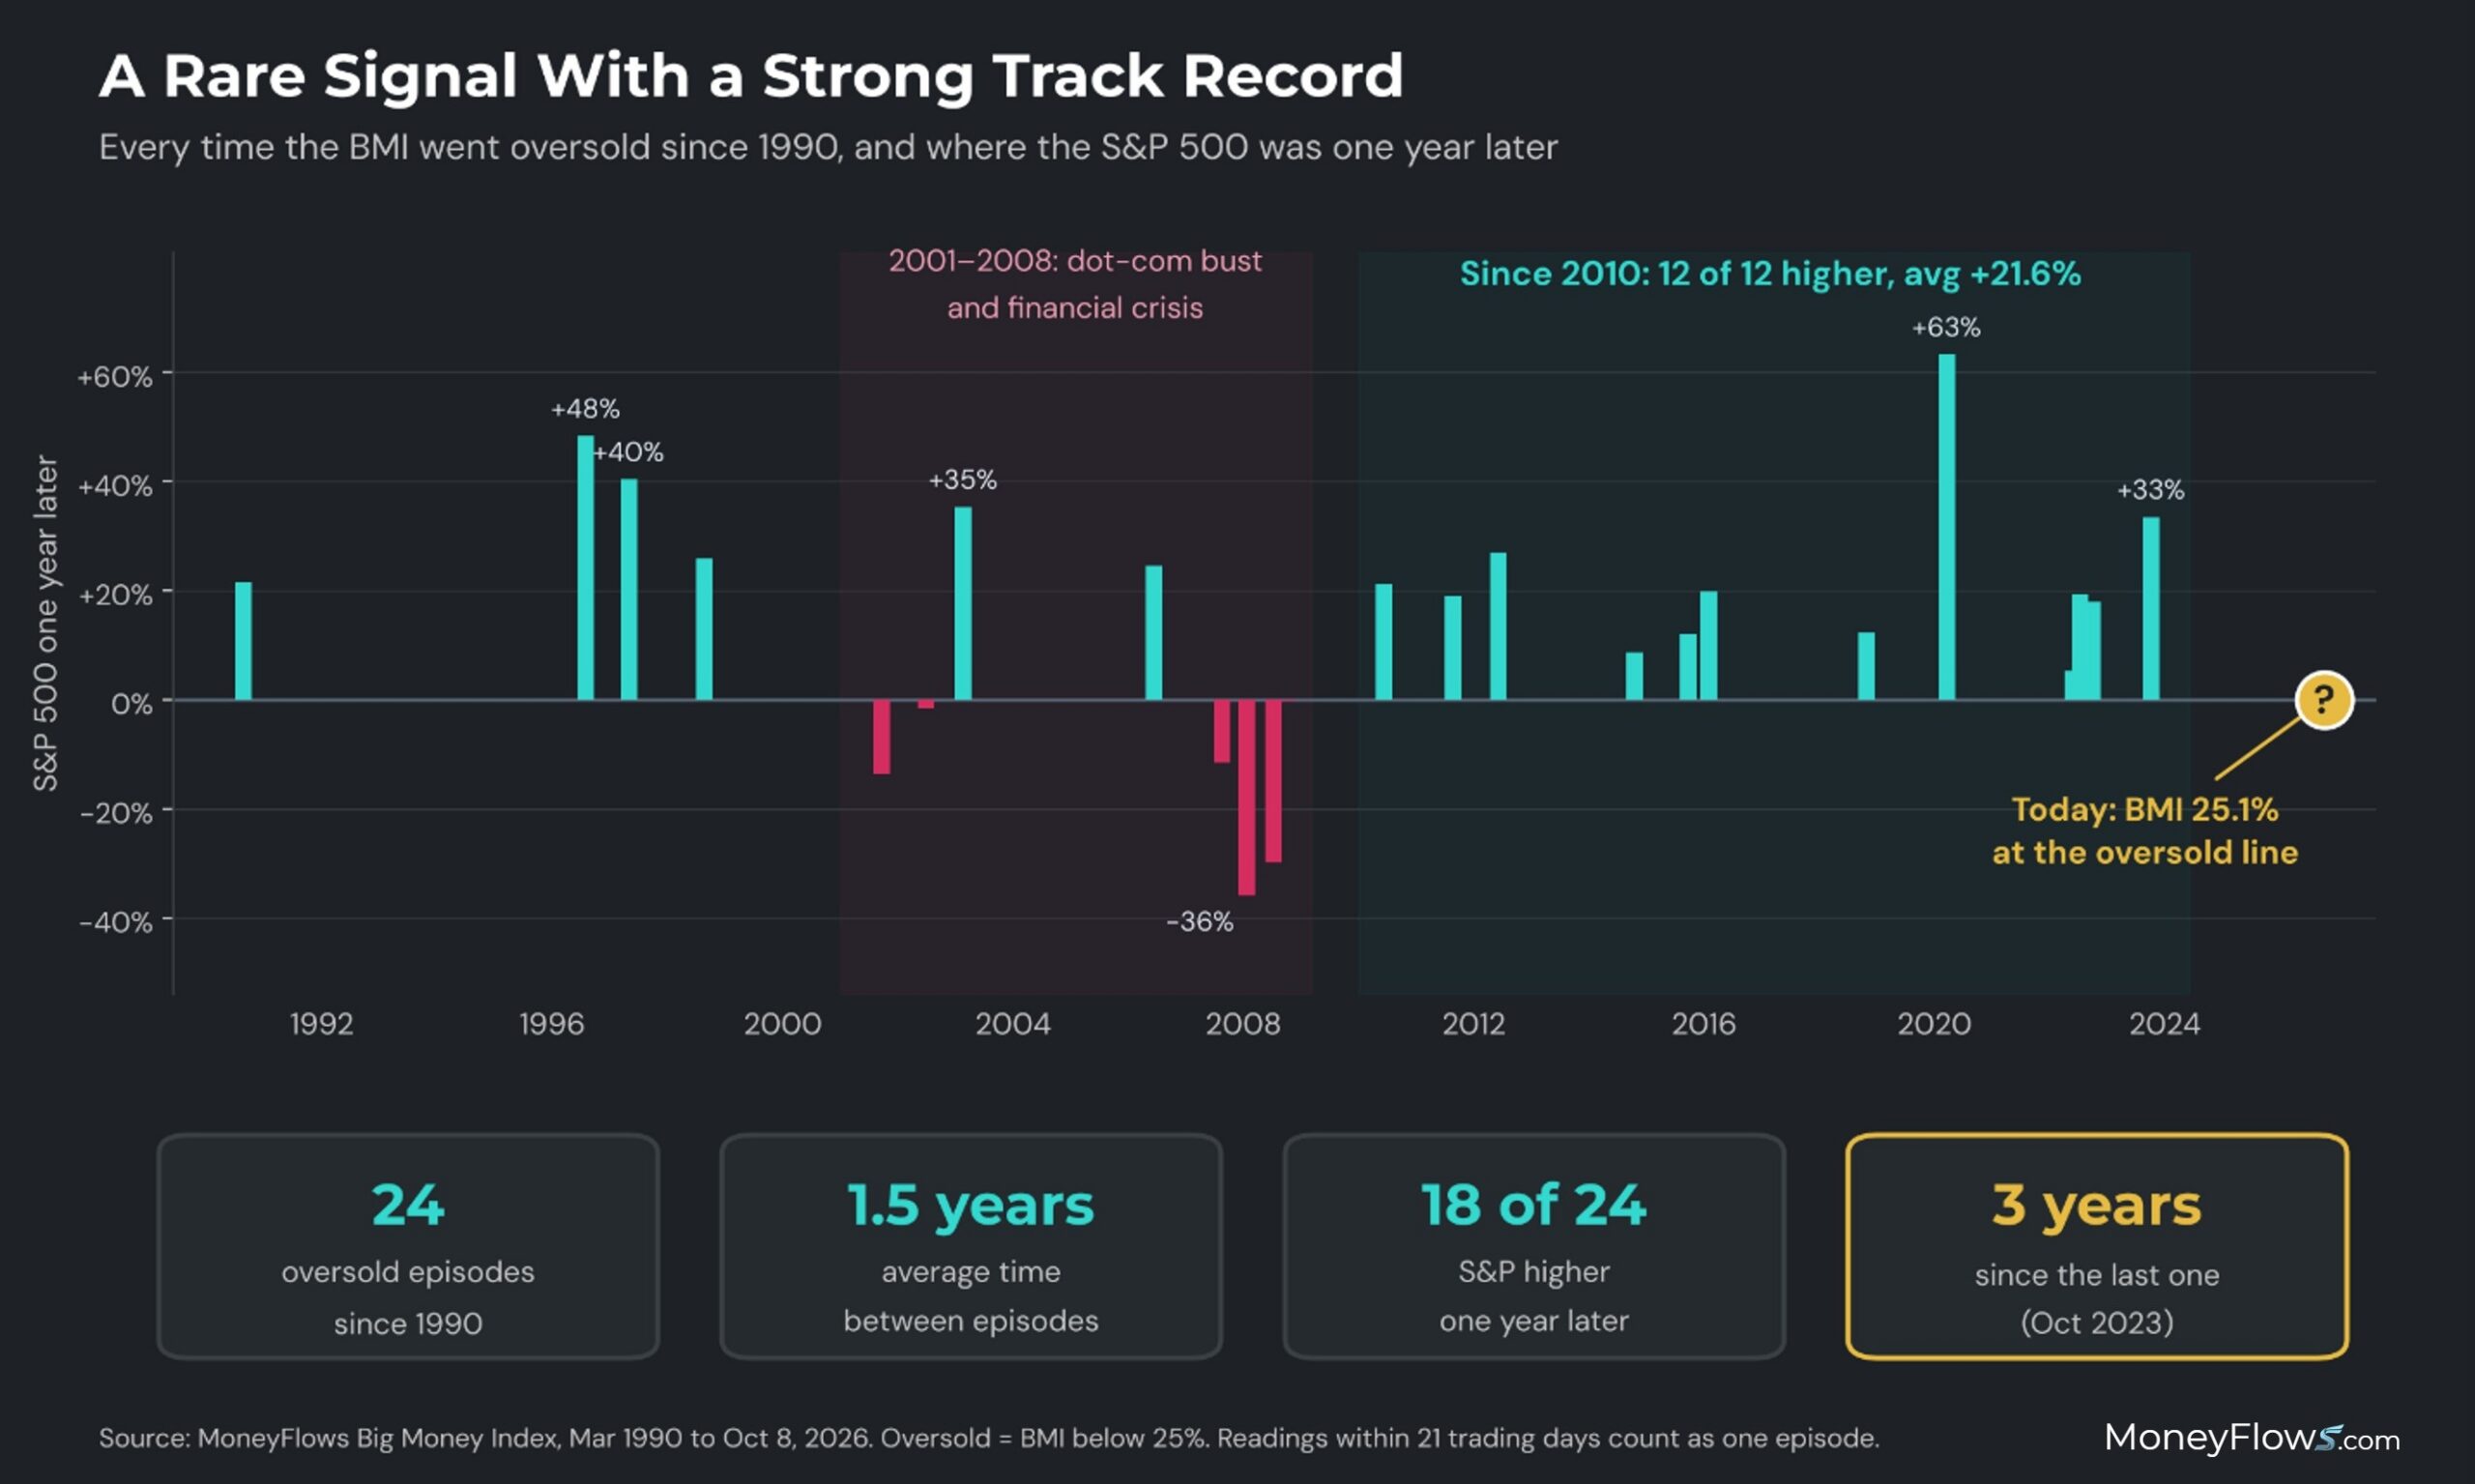
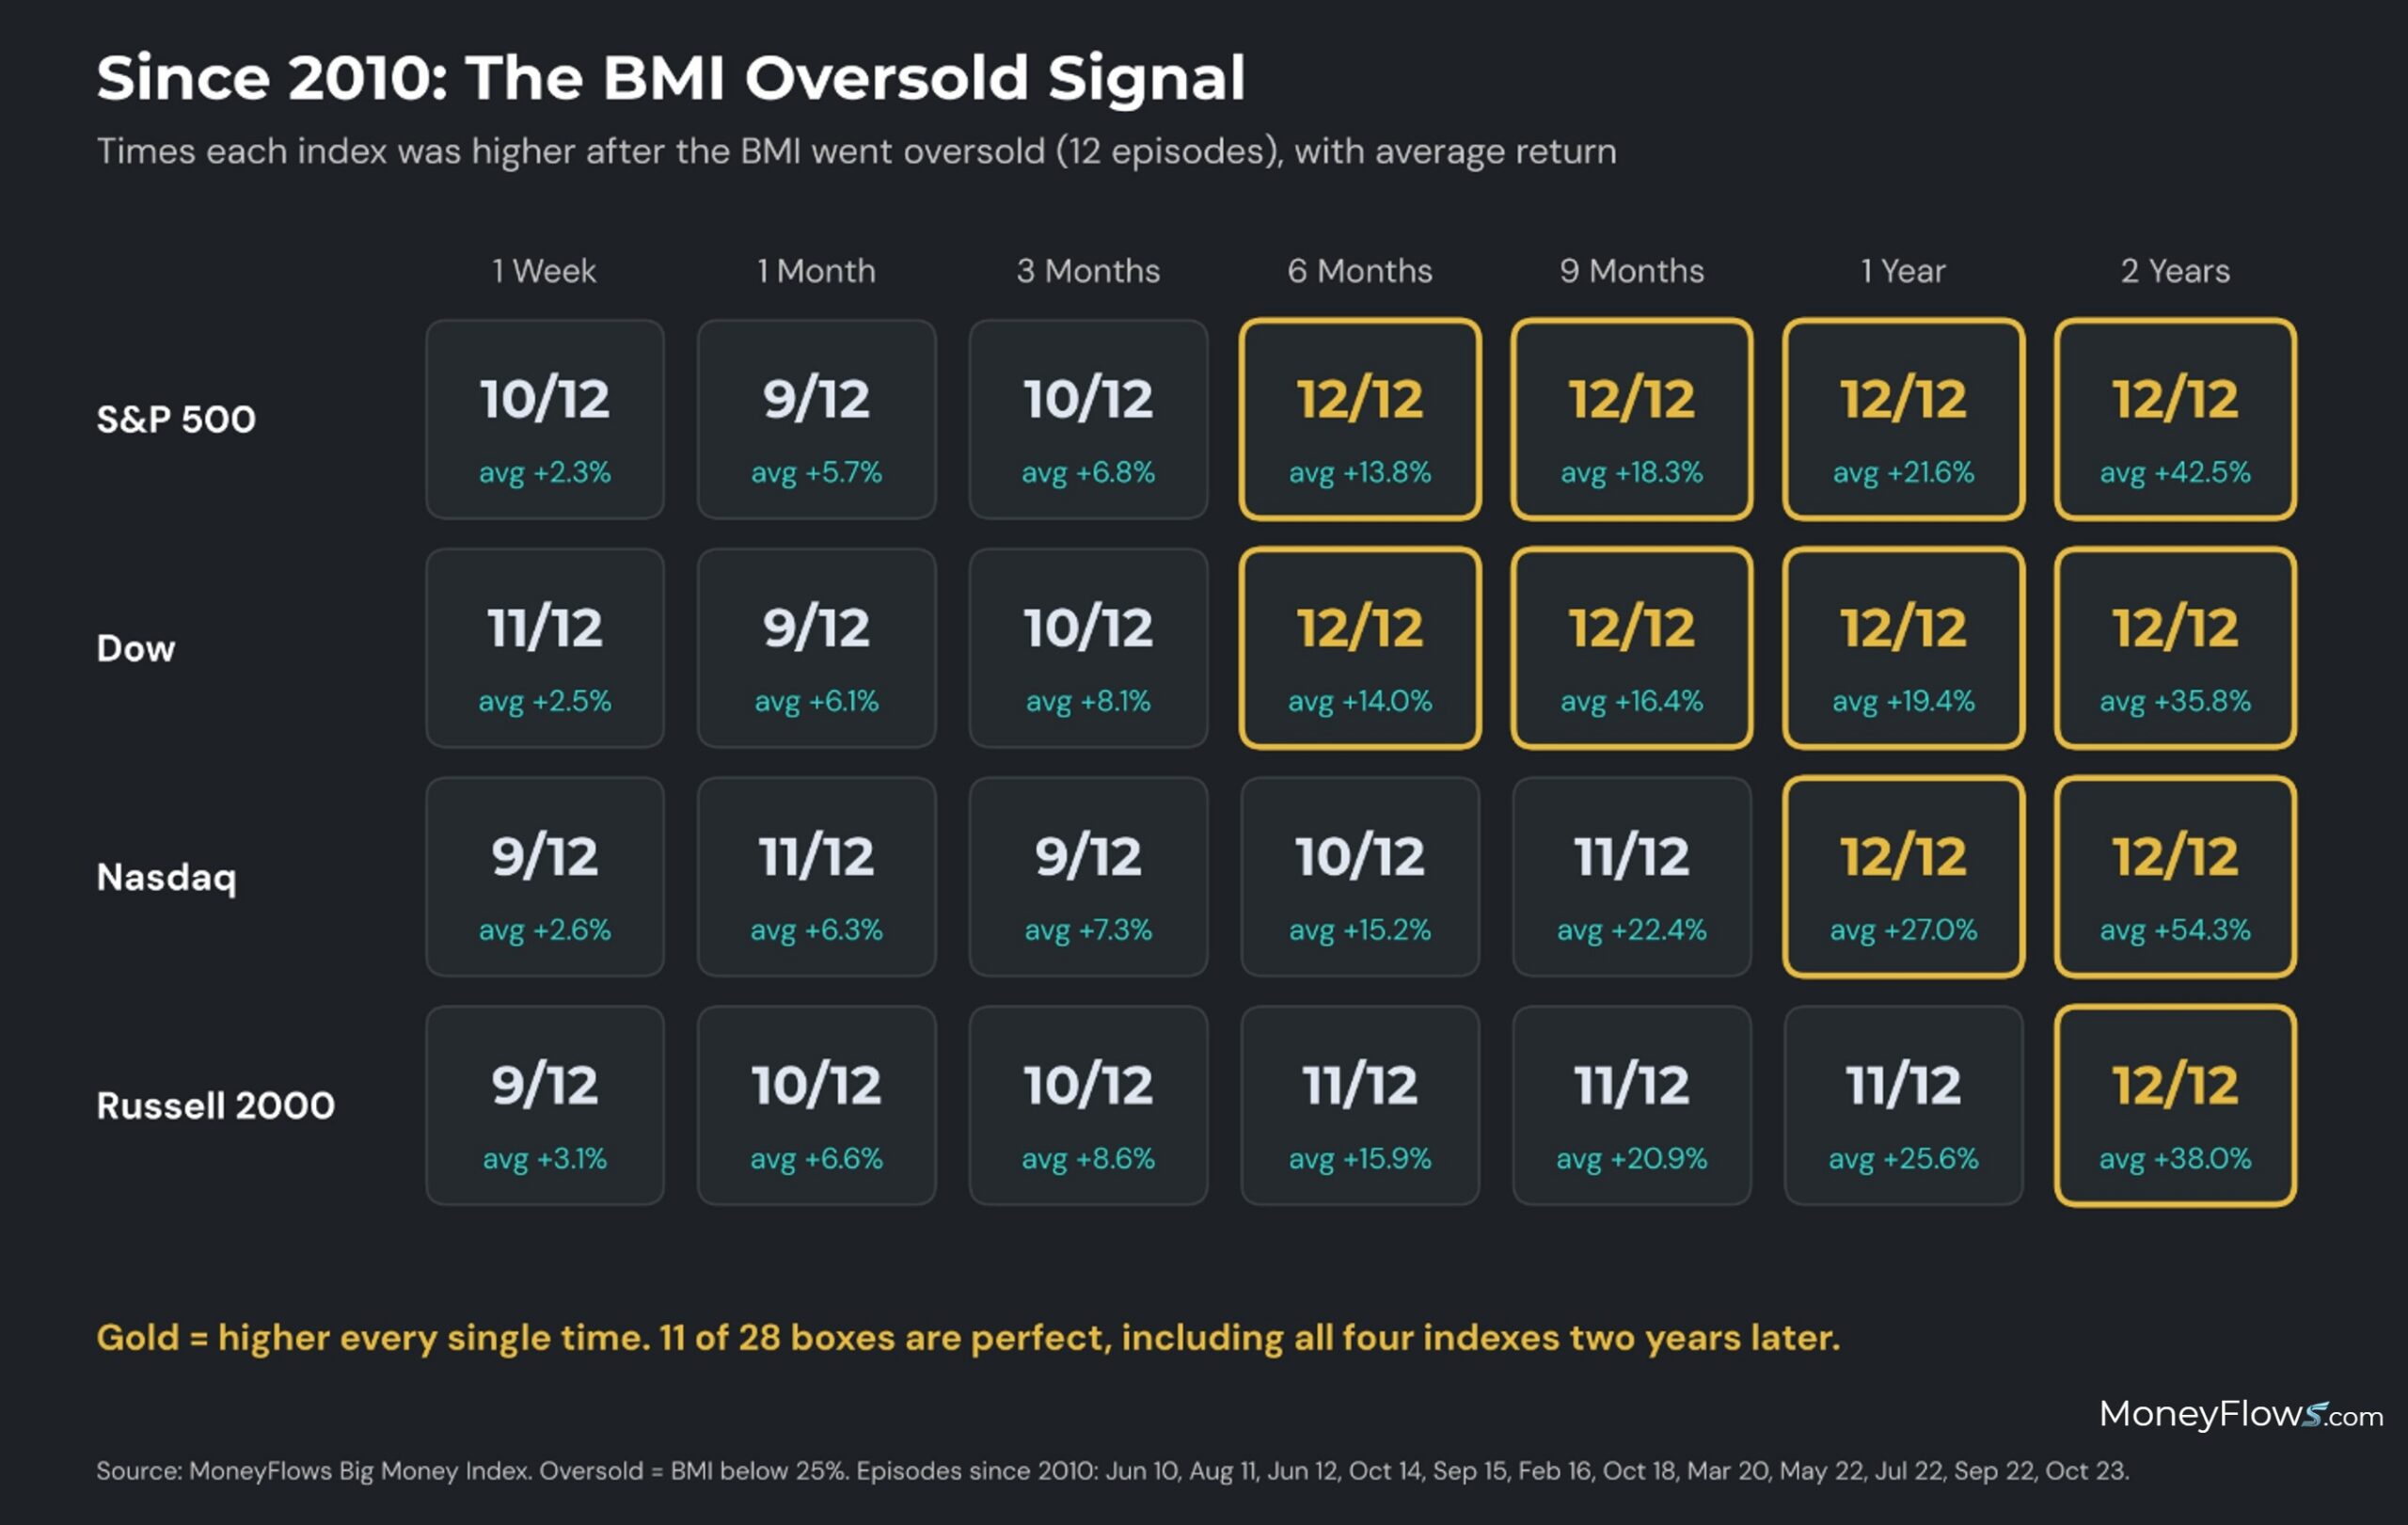
Since 2010, it’s even cleaner. In 12 episodes, the S&P 500 and Dow Jones Industrial Average were higher six months, nine months, one year, and two years later every single time. The Nasdaq averaged a 27% rise a year later. Almost every loss came from 2001 to 2008, during real bear markets.
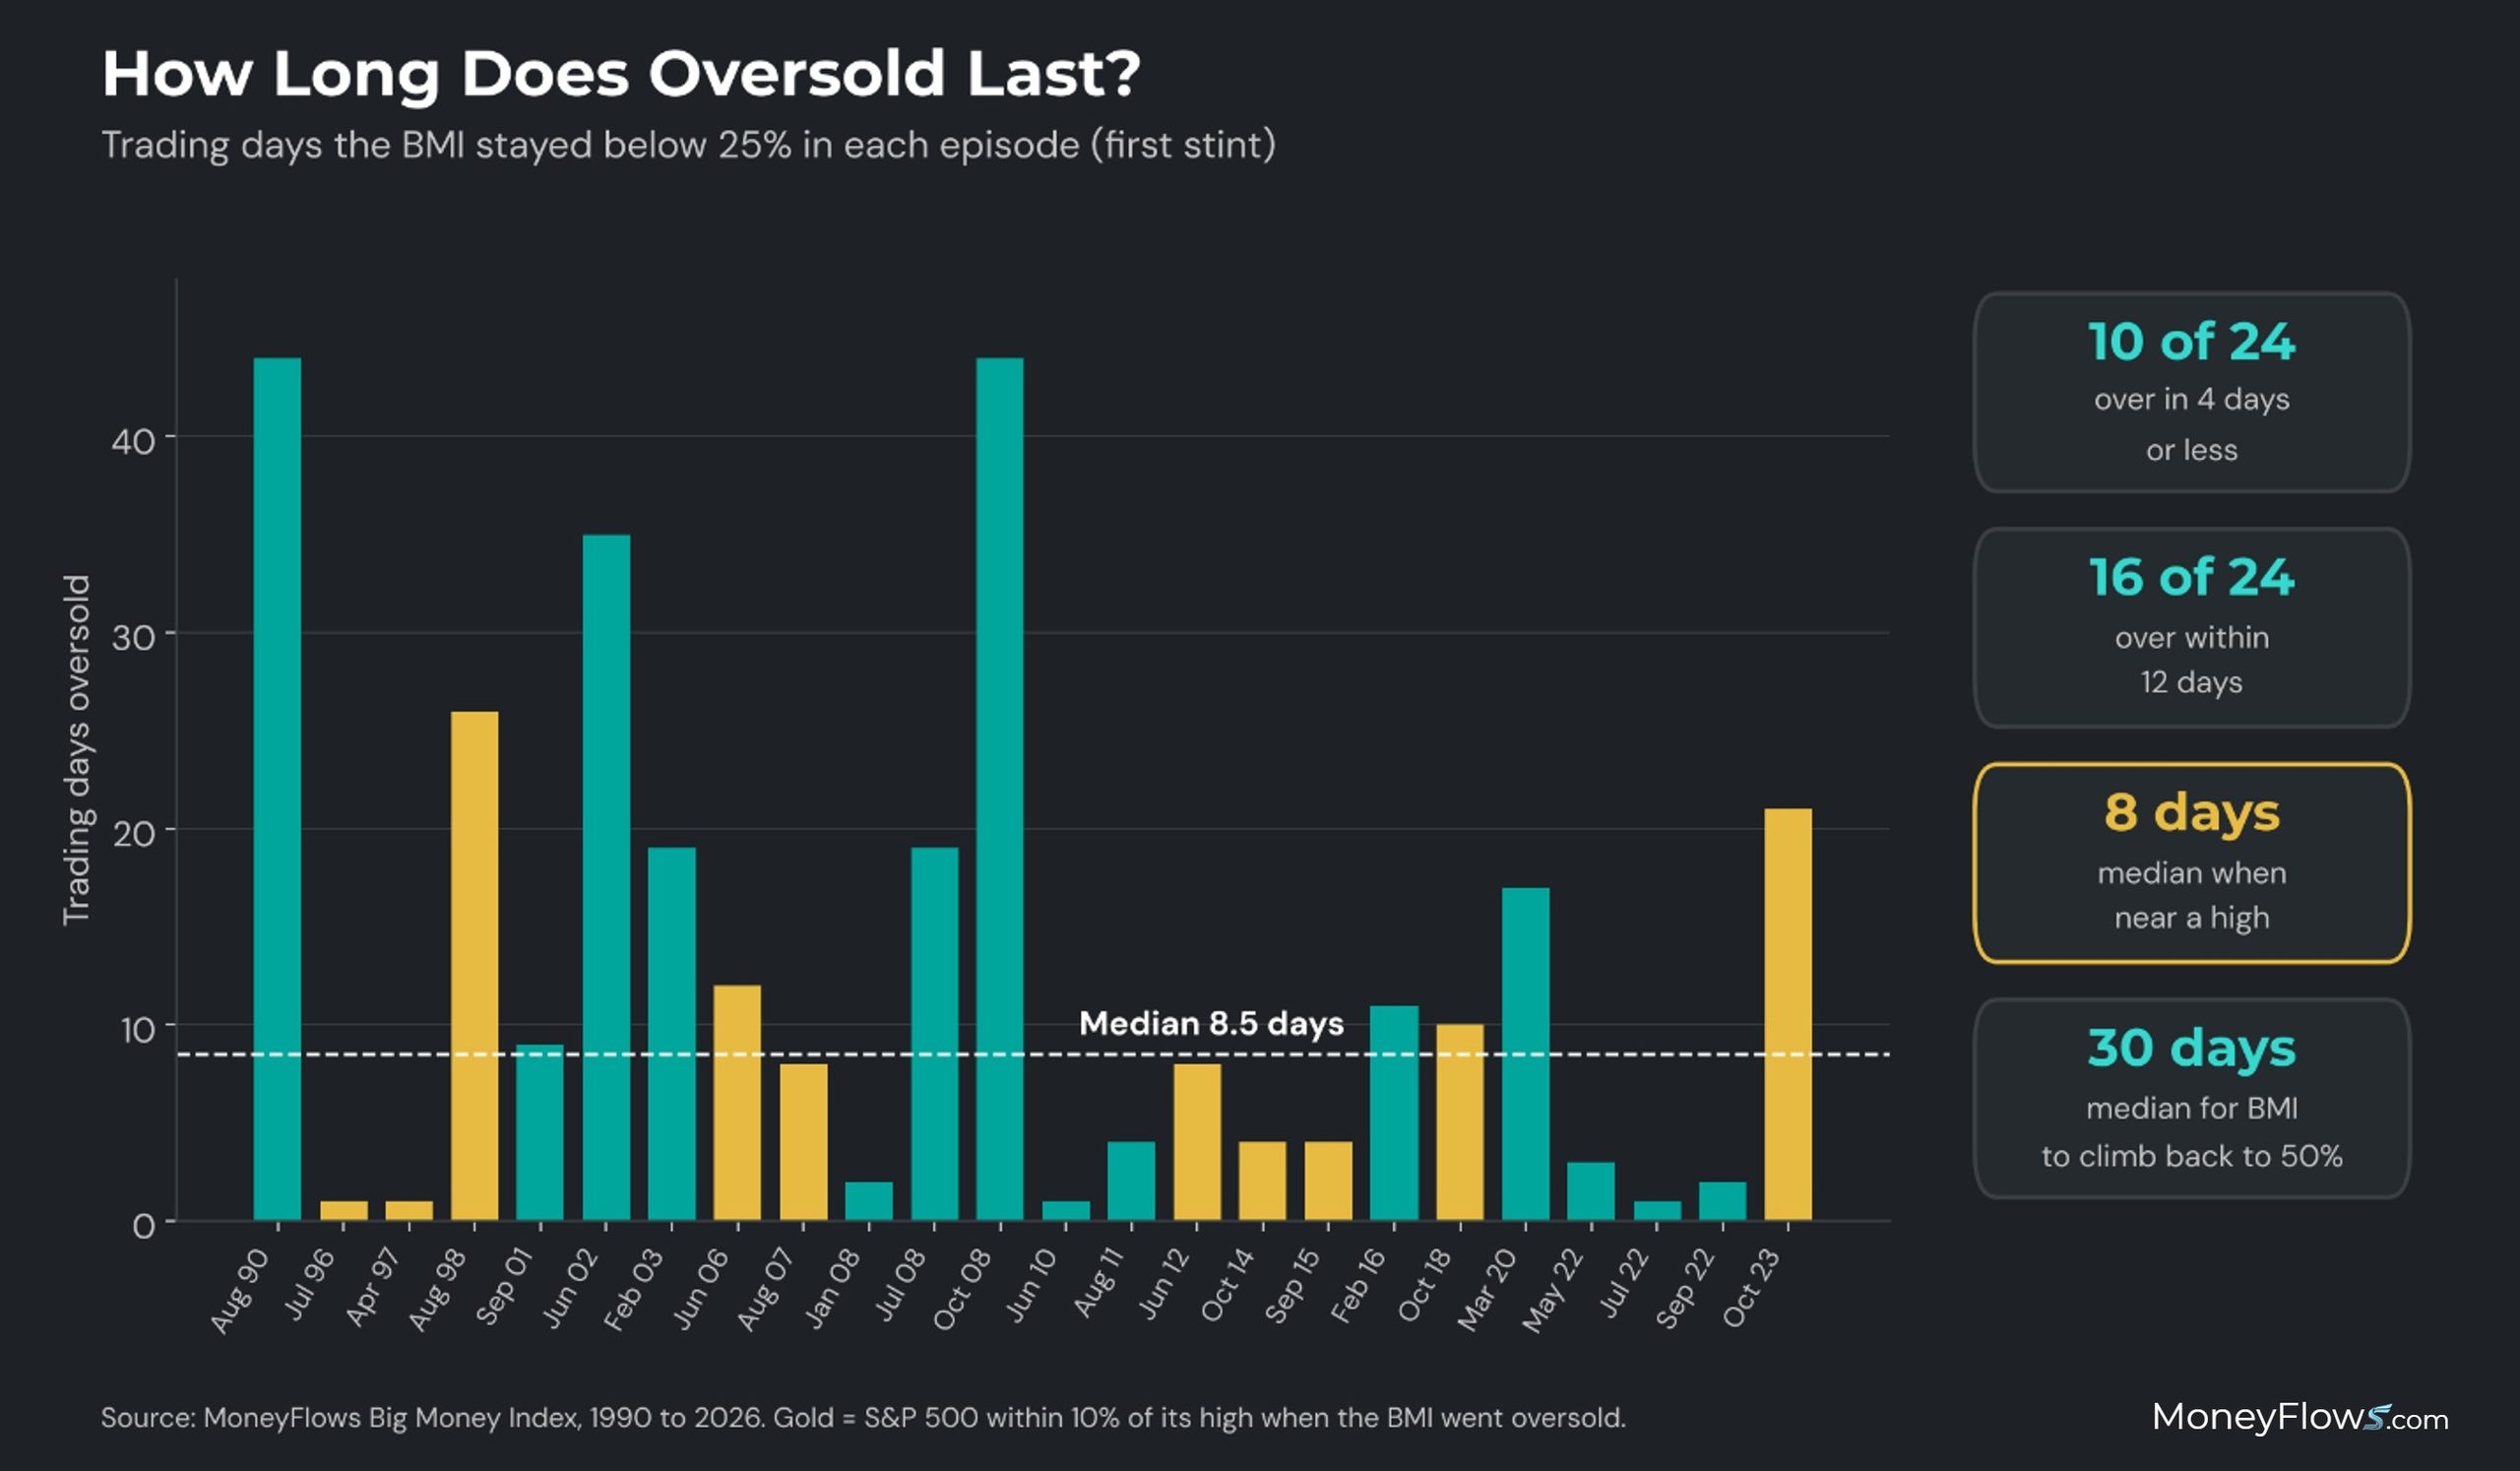
It doesn’t usually last long, either. The median stay in oversold territory is about eight trading days, and the S&P 500 usually bottoms first. If history holds, the BMI climbs out around Oct. 20, right as the strongest seasonal stretch begins.
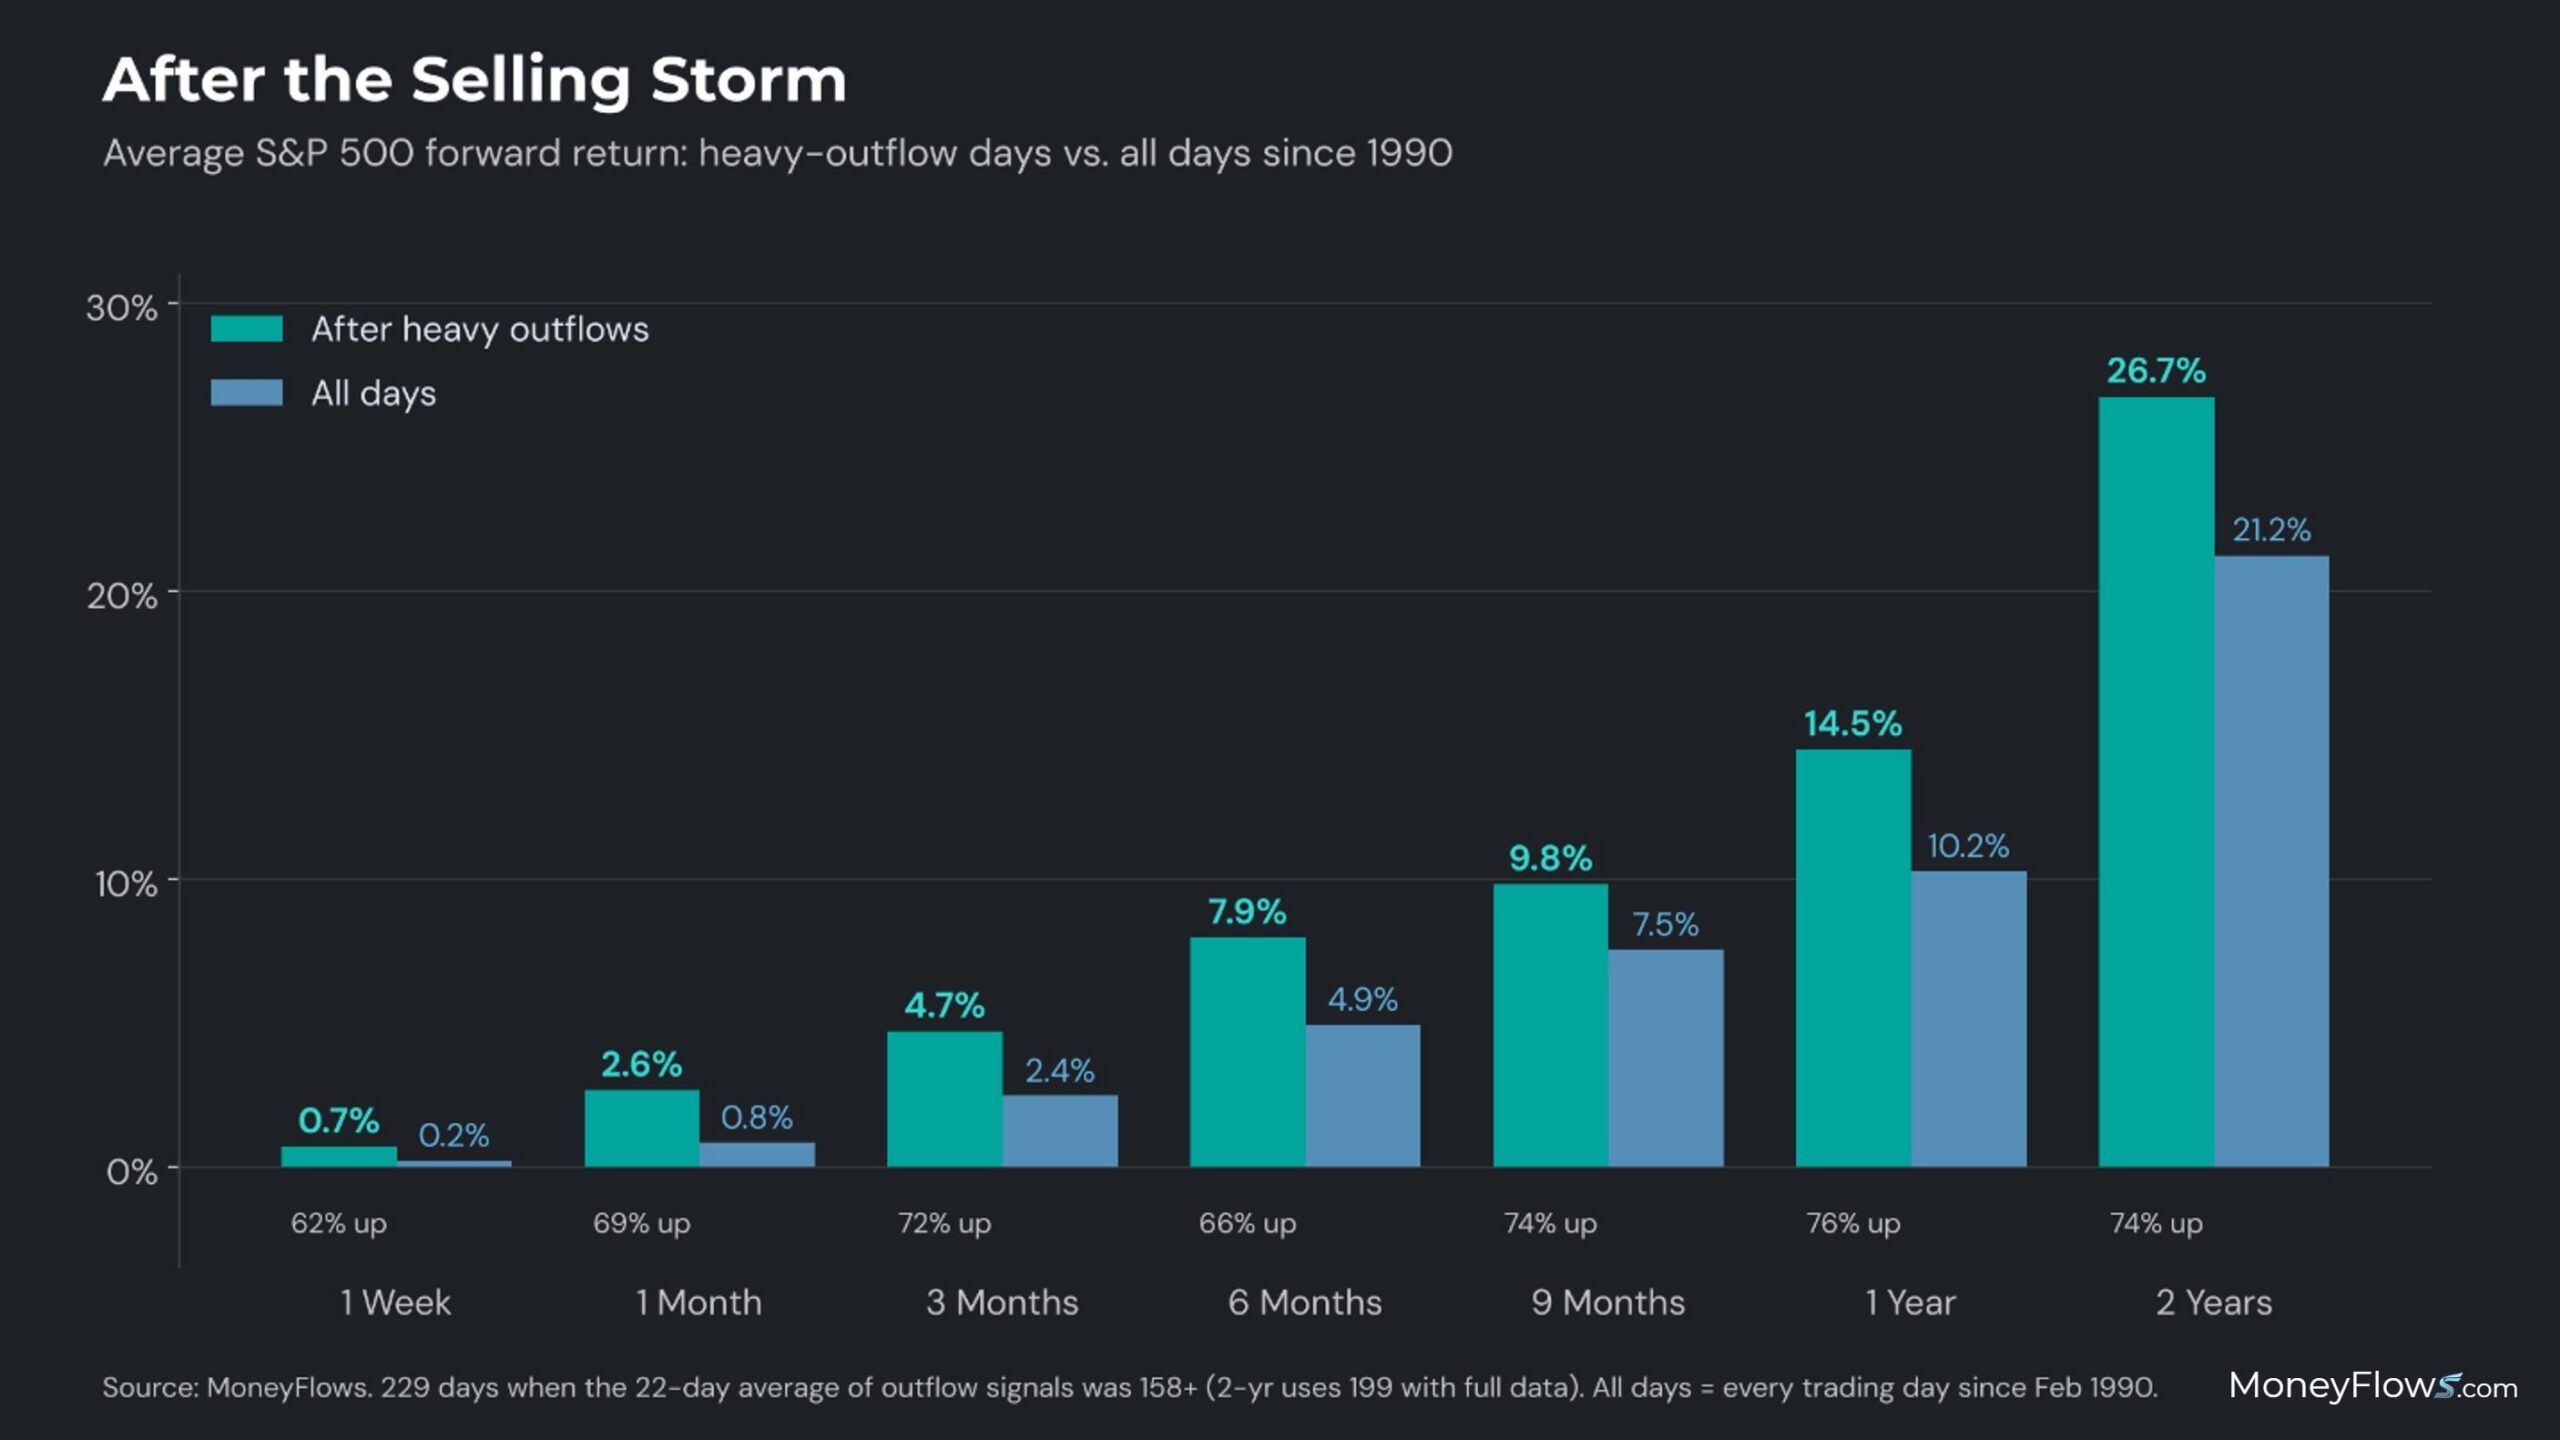
Now look at the selling itself. Since Sept. 9, there has been an average of 158 outflows per day. That’s a storm.
Since 1990, there have been 229 days with selling that heavy, grouped into 16 separate episodes. The S&P 500 forward returns were strongly positive out the curve from one week to two years out.
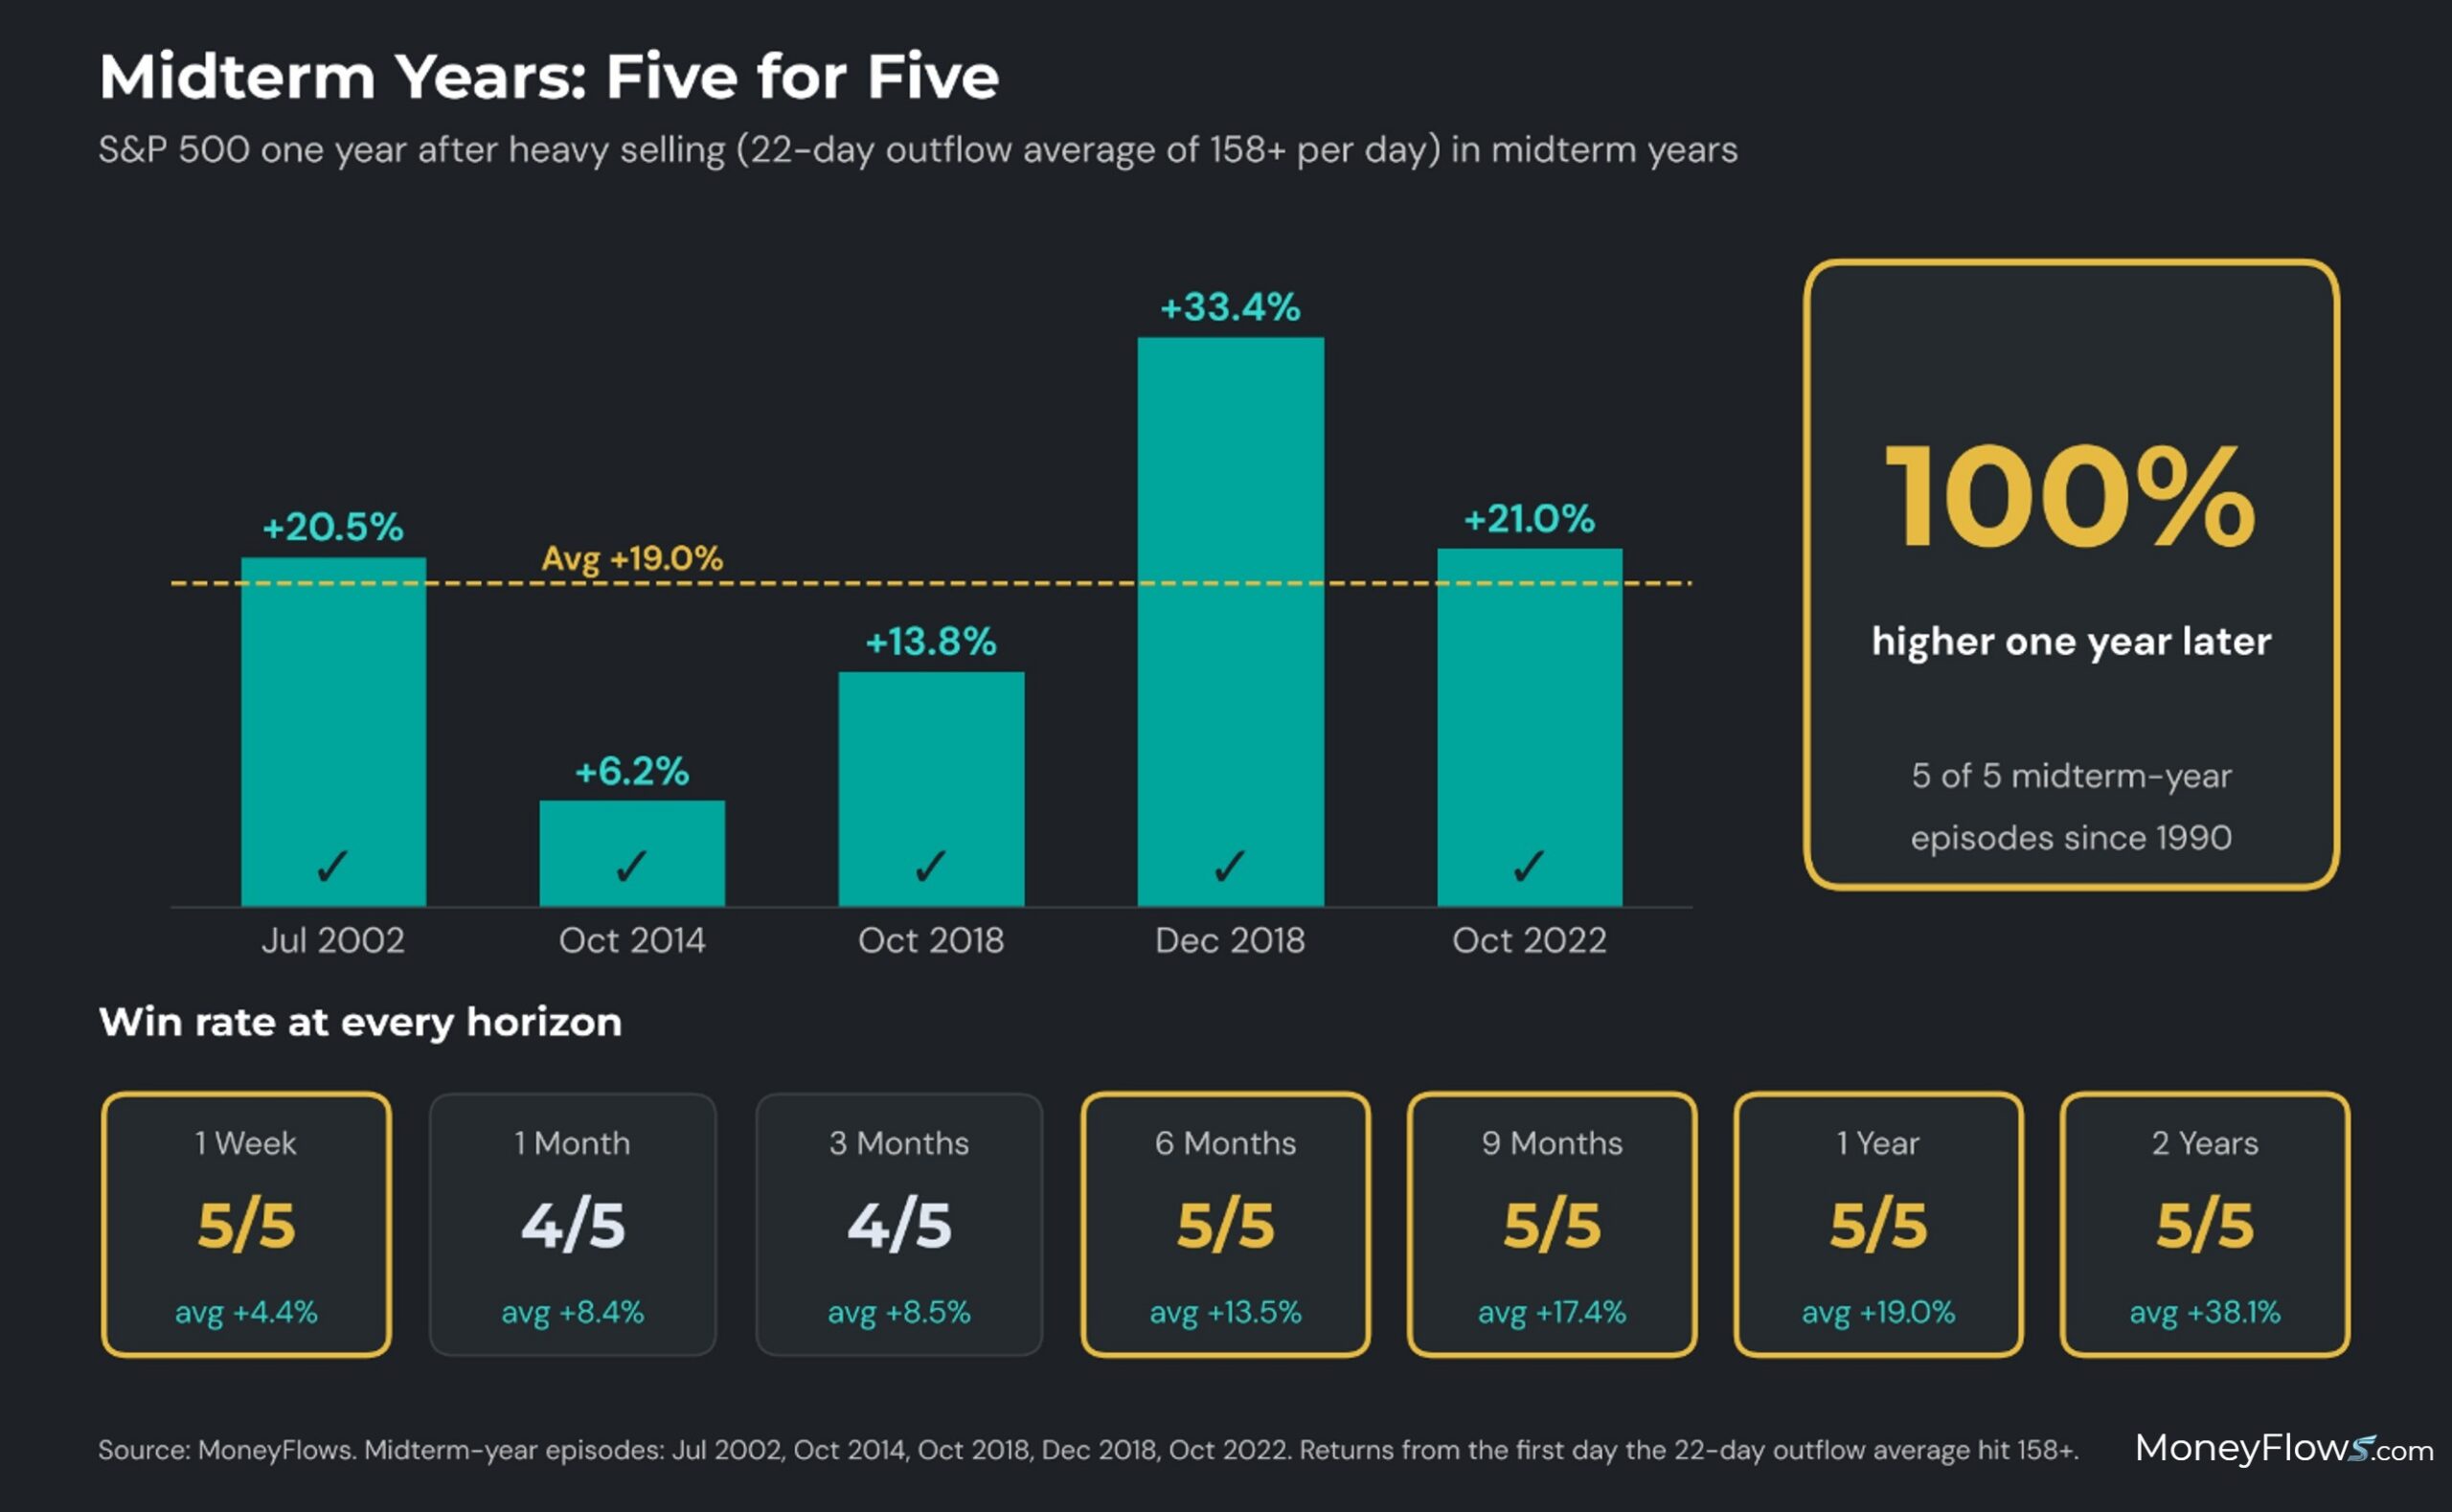
And here’s the midterm kicker. Five of these episodes happened in midterm years: 2002, 2014, 2018 (twice), and 2022. The S&P 500 was higher a year later in all five instances by an average of 19%. Two years later, it was still five for five.
Now let’s look at sectors. Selling was clearly targeted on anything that hates higher rates.
Financials took the heaviest hit, with 112 outflows against just nine inflows. This wasn’t small-town banks. Big Wall Street banks, Canadian banks, and private credit managers all showed up on the sell side. Higher long-term rates squeeze lending and raise worries about bad loans.
Health care was next with 108 outflows, led by big drugmakers. Real estate saw 70 outflows and zero inflows. REITs borrow heavily and compete with bonds for income buyers, so a 5% 10-year yield is a direct threat. Discretionary saw 58 outflows, mostly homebuilders and restaurants. With 30-year mortgages near 7.5%, homebuilders feel every rate move.
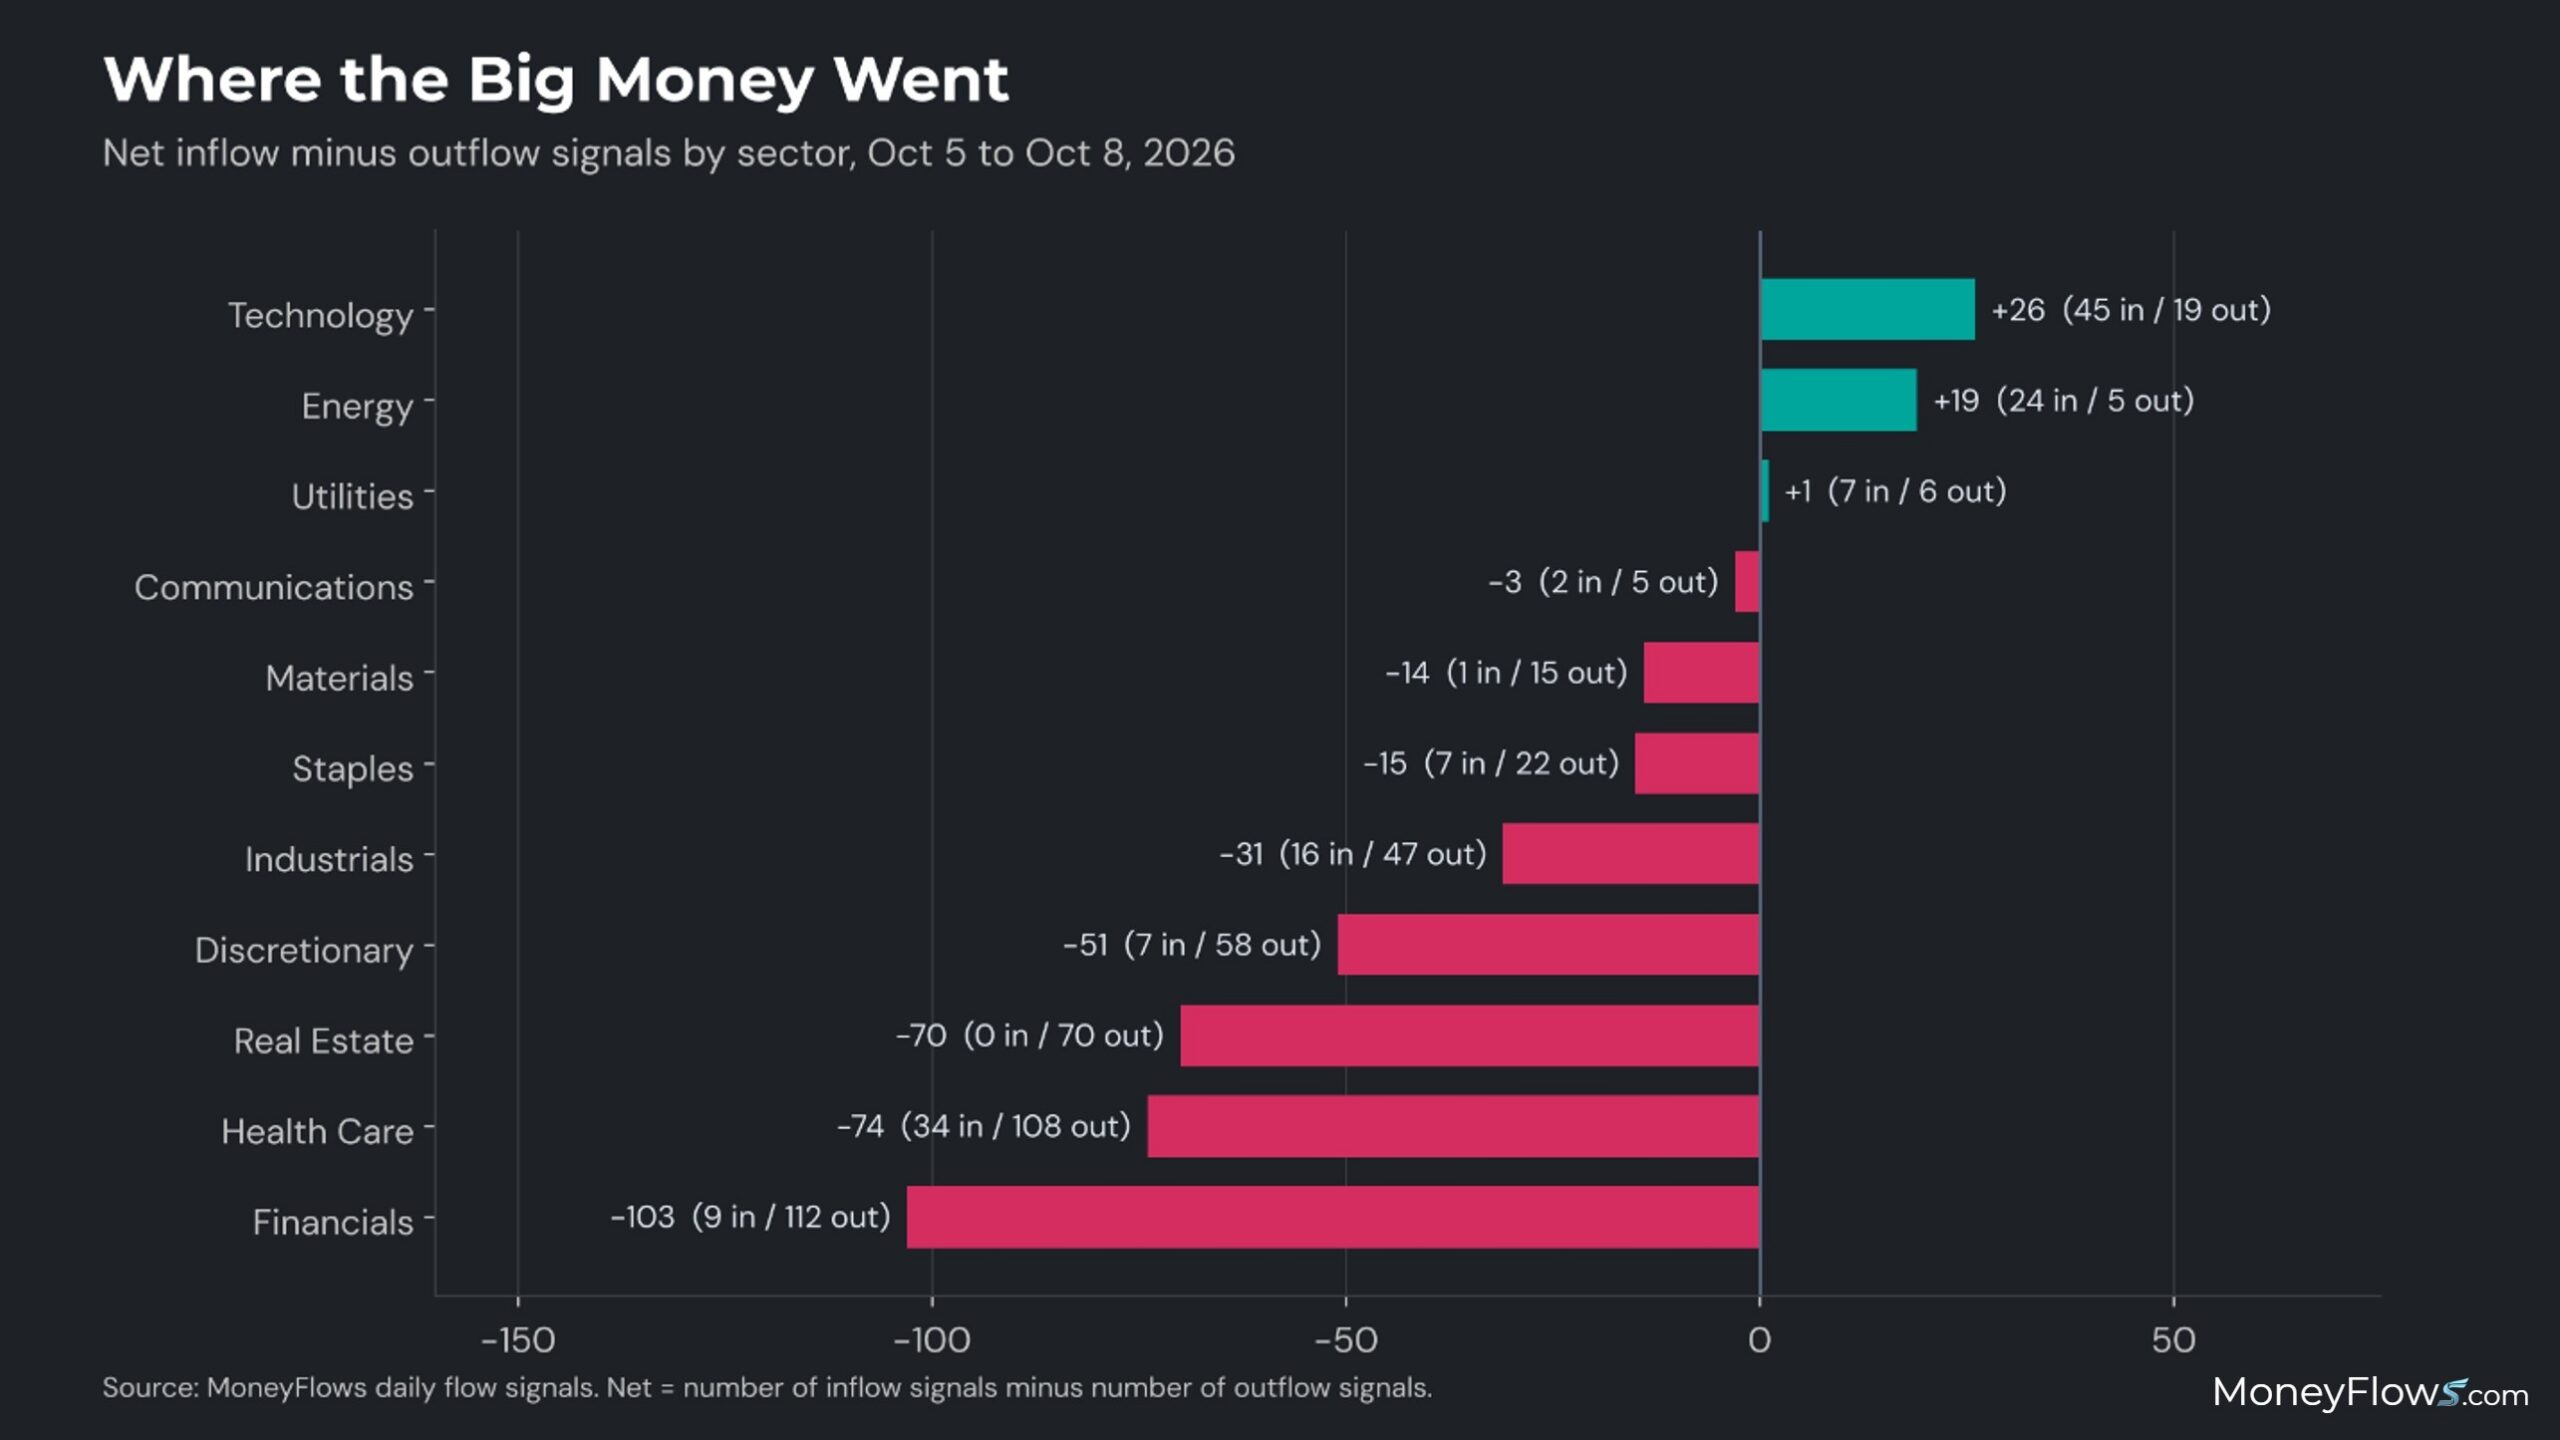
Alternatively, technology saw 45 inflows and energy drew 24. Quality tech was bought: Nvidia, Microsoft, Arista Networks, and cybersecurity leaders. Of the 35 tech names with inflows, 20 sat within 5% of their highs.
Big Money isn’t fleeing stocks. It’s trading weaker balance sheets for stronger ones.
This fits what my colleague Alec Young wrote this week in “Buy Stocks into Rate Hikes.” He says rate-hike reasons matter more than the hikes. Today, the Federal Reserve is leaning against strong growth and record earnings. He also notes the Magnificent 7 stocks earn 31.9 times their interest costs, while small-cap shares earn just 1.4 times. Rising rates barely dent one group while squeezing another.
Here’s where I land. The indexes and the market underneath are flowing side by side and not mixing yet. Rates are the wall between them. Oct. 6 looks like the turn under the surface, and this week is the test. The BMI is about to go oversold with the S&P 500 near a record, which has never happened. History says that’s one of the strongest buy signals in our data, especially in midterm years.
The rivers always mix eventually. Downstream, it all becomes the Amazon.
As Heraclitus said, “No man ever steps in the same river twice.”
(I, Jason Bodner, hold long positions in personal and/or managed accounts in NVDA, ANET, and MSFT.)
MoneyFlows finds the winners early…bringing them to you.
If you’re a serious investor or money manager, get started NOW.
Our PRO subscription allows you to spot daily flows and access our weekly Outlier 20 report.
This is the report that has found EVERY SINGLE ONE of our Outlier stocks.
Enjoy a click-through experience unlike anything out there.
Professional money managers and RIAs looking for additional portfolio solutions including ETF flows & ranks and your own Portfolio Tracking tools, please reach out about our Advisor Solution and Emerging Advisor Program.
Have a great week!
***Lastly, join me LIVE, Nov. 30 – Dec. 2, at the MoneyShow Masters Symposium Sarasota, FL. I’ll be presenting: Why the Midterm Election Historically Brings Epic Rallies – And What to Buy Now.
You don’t want to miss this! Click the image below to reserve your spot.