

3 Reasons We’re Gearing Up for a Summertime Rally
by Lucas Downey All, Big Money Insights WeeklyMarkets have been quiet lately, effectively trading flat the last 2 months.
Investors are looking for the next catalyst to lift equities higher.
We’ve got you covered as we see a very positive forward picture unfolding.
Today we’ll share 3 reasons we’re gearing up for a summertime rally.
Coming into 2024, our stance was simple: We expected big gains for stocks. Between depressed investor participation, re-accelerating earnings growth, and narrow market leadership – the data pointed to strong upside.
Our message has not changed. The bull market is not over.
And while stocks have stammered lately, we view this as temporary and healthy after the S&P 500 staged an awe-inspiring 28% rip from the market lows in October.
Today we are going to dive into our data and look at some hard-hitting evidence pointing to better days ahead.
Whether you’re a market technician or macro enthusiast, the backdrop for stocks is overwhelmingly constructive.
3 Reasons We’re Gearing Up for a Summertime Rally
Let’s take the temperature of the market. The supply and demand picture has shown plenty of weakness the last few months.
The Big Money Index (BMI), a real-time gauge of institutional positioning, has been declining from a red-hot overbought reading (80%+) to the low 40s as of late.
This downtrend reveals how the rally in markets has not been broad-based. Anytime the BMI is under pressure, it signals that more individual stocks are being sold compared to those under accumulation:
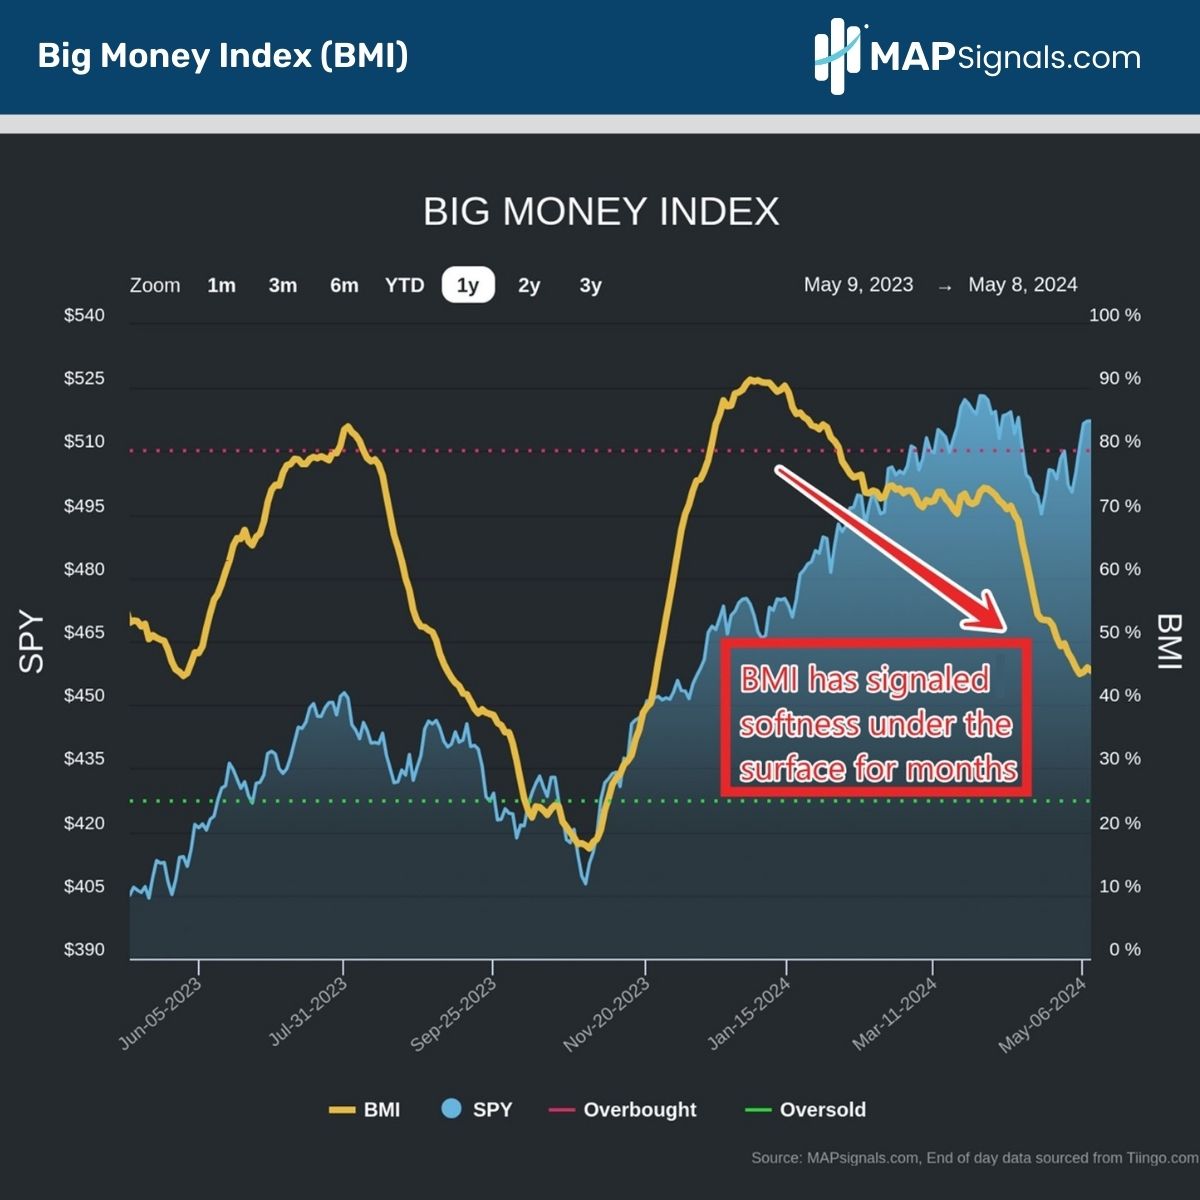
One look at this chart could have you second guessing buying equities. Afterall, who wants to call the BMI low?
Turns out, magnitude matters. A free-falling BMI tends to signal near-term chop before a mega pop.
Reason number 1 to prepare for a summertime rally is due to the study from last week. If you recall, we went back in our data and reviewed all instances when the BMI dropped 40+ points in a 4-month time period.
What it foretells is that we are edging closer to a powerful rally. When you study all 303 instances, the S&P 500 averages a 2.2% lift a month later, a 5% rip 3-months out, and a market-beating 14.8% gain 12-months later.
It’s important to note that anytime the BMI 40+ points from a red-hot overbought period like now, it’s ultra rare. Those handful of instances resulted in near-term weakness before a huge pop months later.
In either case, now is the time to be picking spots on high-quality stocks under pressure:
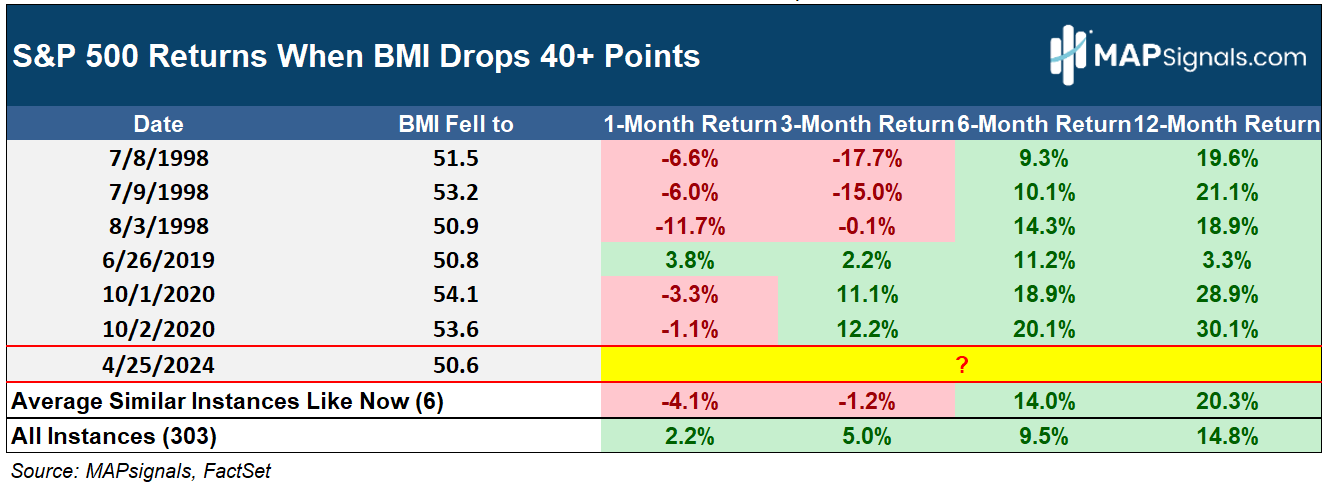
That is a lot of green…anyone who’s been following us knows that when the BMI starts to trend higher, stocks bounce hard and fast.
It’s not a matter of if, but when.
But we can’t stop here. History proves that we are weeks away from a positive technical catalyst.
Reason number 2 to prepare for a summertime rally is due to a very powerful seasonal tailwind beginning in late May.
The old Wall Street adage to sell in May should be revised to include but remember to buy in the summer months.
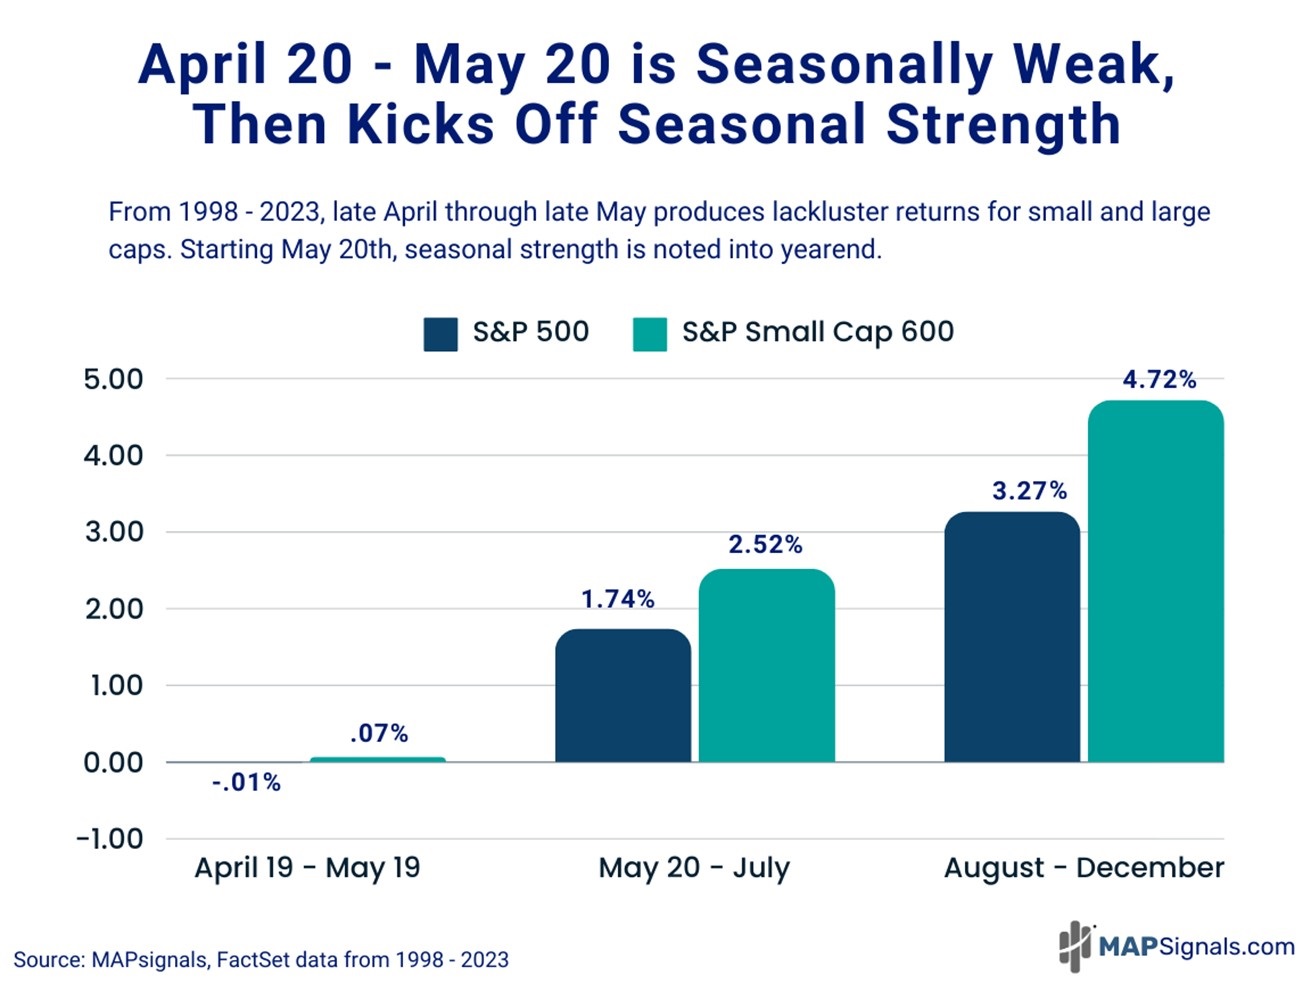
While I can’t deny that stocks sputter in late April through early May since 1998, this chop fest bleeds into a humongous multi-month rally.
Below shows this beautifully. Since 1998, May 20th – July kicks off a powerful market thrust. The S&P 500 gains an average of 1.74% in this multi-month period.
Even more promising is the +2.52% rip in the S&P Small Cap 600… this is important given the lagging performance for the group in 2024:
This point on small-caps is a focus for us at MAPsignals. Rising interest rates have been the noose around their neck ever since the Fed began lifting interest rates to battle out-of-control inflation.
Higher interest rates penalize smaller less capitalized firms more given higher debt levels. But that headwind is soon to unwind as we get closer to the next policy move from the Fed: interest rate cuts.
It’s not a matter of if the Fed is going to cut rates, it’s when.
Reason number 3 we’re preparing for a summertime rally is due to the fact that small-caps in particular soar when the Fed cuts interest rates and the economy dodges a recession.
We’ve noted the broadening out of the market since March. Prior unloved areas like Energy, Financials, and Industrials began to see a massive rotation of inflows at the expense of overweight Technology positioning.
I believe this rising tide under the surface of the market is due to savvy investors positioning ahead of a coming rate cut in 2024.
Probabilities for the first rate cut is now pegged at September. If this holds true, you can bet that institutions will be positioned well ahead of it.
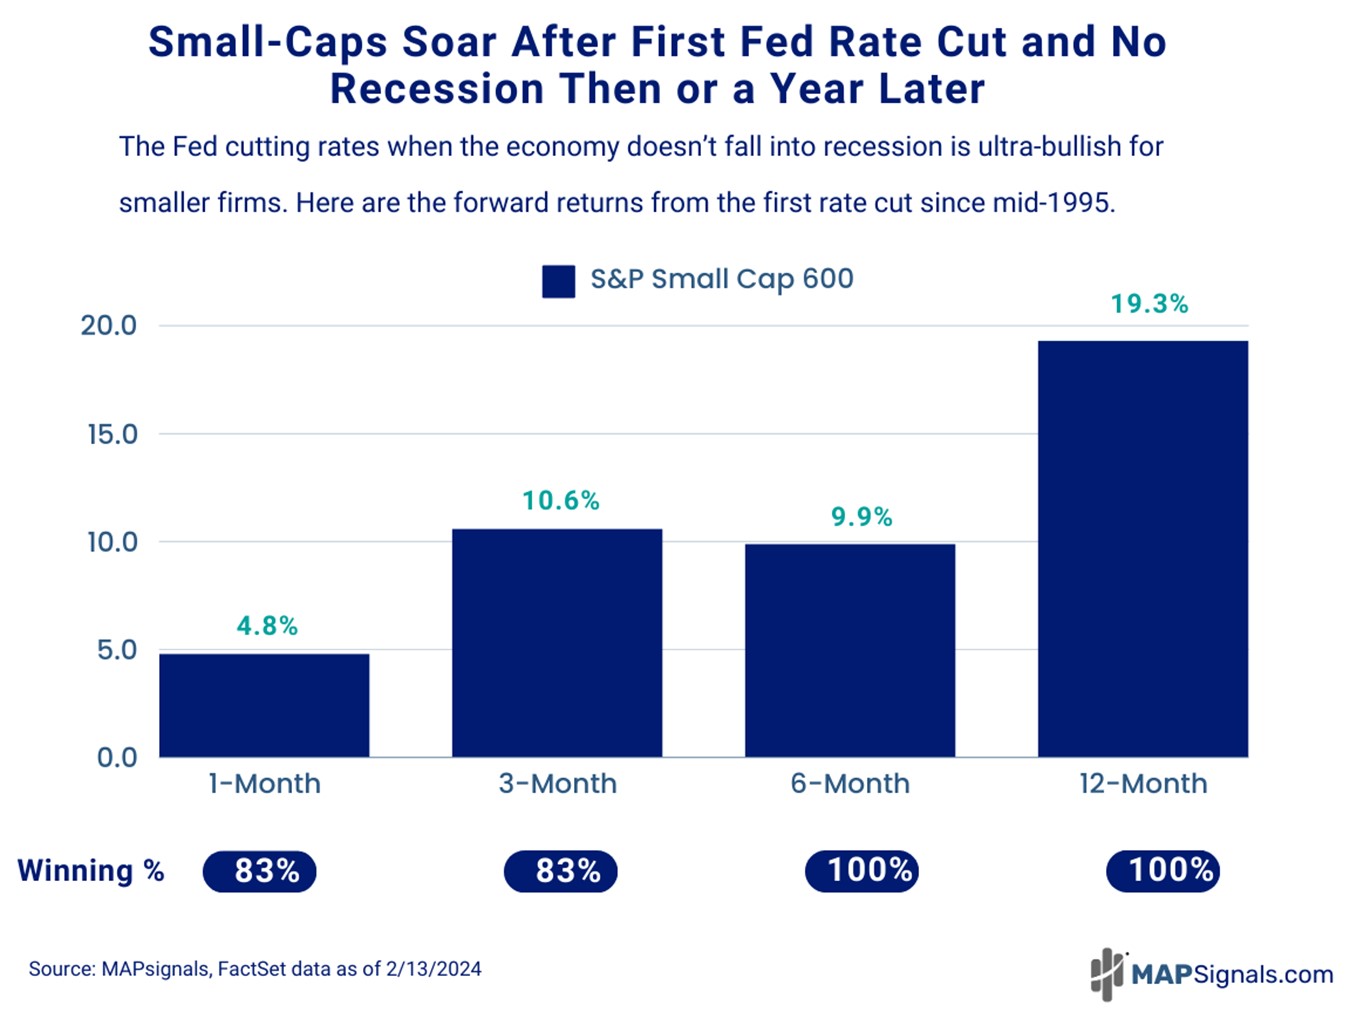
And history shines a mega bright green light on small caps once the first Fed rate cut hits and there’s no recession.
Since mid-1995, when the Fed makes the first interest rate cut and the economy is not in recession and doesn’t fall into a recession a year later:
- Small caps rip 4.8% a month later
- They vault 10.6% 3-months after
- And they soar 19.3% 12-months later
Ladies and gentlemen, the stage is set for better days ahead.
The free-falling BMI is a time to grab high-quality companies on sale. Marry this with a very intense seasonal tailwind beginning in a couple of weeks…and the setup makes a ton of tactical sense.
Should the macro data also strengthen the case for a rate cut this year, you’re looking at an extremely favorable situation for stocks…especially down-and-out small caps.
Use the drop to position for the pop.
Let’s wrap up.
Here’s the bottom line: Our cautious stance the last couple of months is drawing to a close. Our market North Star, the BMI, is telling us to prepare for healthier participation from institutional investors.
Not only that, tis the season to prepare for a strong equity tailwind. Late May kicks off a powerful 2-month rally for both small and large caps.
Round it all out with possibly the biggest macro tailwind around the corner, the start of interest rate cuts, and you’re looking at a powerful summertime rally cocktail.
Don’t miss the boat.
Use a map to navigate your portfolio now.
Don’t wait for the media to get bullish…by then it’ll be too late.
The next leg higher is approaching.
If you’re a serious investor, money manager, or Registered Investment Advisor (RIA), looking to take your research to the next level, now’s a wonderful time to see the power of money flows on individual stocks.
Get started with a MAP PRO subscription and find tomorrow’s top stocks…today.