

2023 Bull Market is Just Getting Started
by Lucas Downey All, Big Money Insights WeeklyIf you wait for the all-clear signal in stocks, you’ll miss the boat.
Markets continue to surge higher, stunning the crowd.
The 2023 bull market is just getting started.
Wow, what a difference a year makes. A year ago, headlines read of S&P 500 enters bear market, awaking the loudest bear roar in years. The most widely telegraphed recession simply never arrived.
Fast forward to today and what did a arrive? A monster rally that’s proving to be incredibly resilient. And get this, there’s likely more to go.
Today, we’re going to do 2 things. First, we’ll put on our x-ray goggles and see why stocks continue marching higher. Then we’ll rewind the tape. You’ll want to see where our research stood this time last year.
Back then our data wasn’t predicting doom and gloom. Nah, it was boom and zoom!
Let’s hop to it.
2023 Bull Market is Just Getting Started
There’s one force that drives stocks, supply, and demand. When demand is in control, stocks ramp. There’s no better way to measure market appetite than with the Big Money Index (BMI).
It’s the real-time gauge for institutional trading flows.
When its vaulting north, stocks have no choice but to melt higher. Today’s reading is at 61%, the highest level since March:
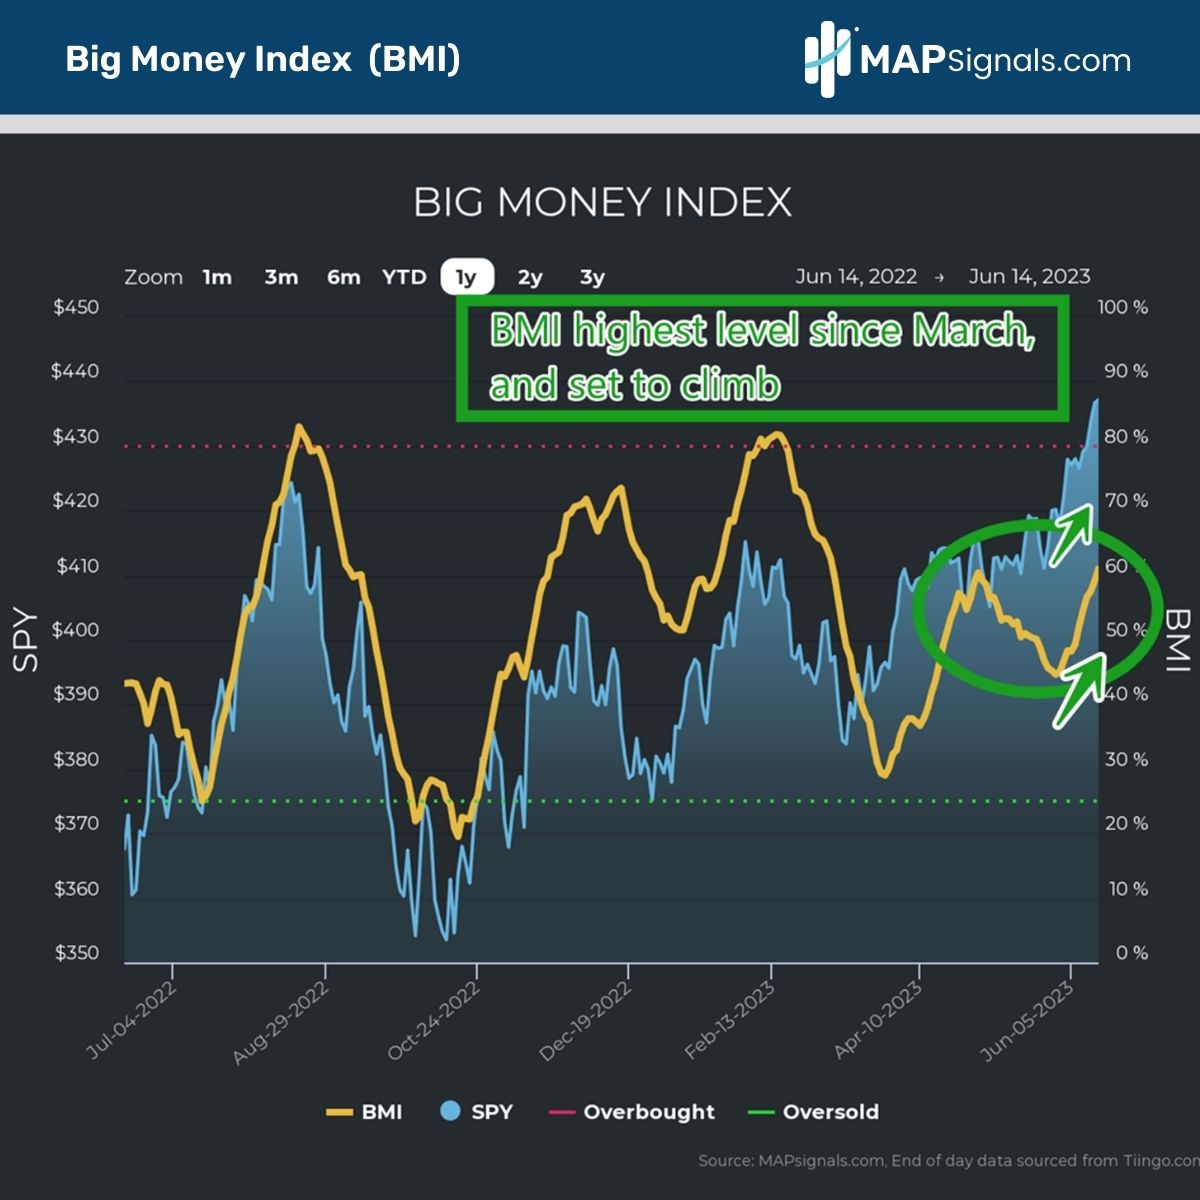
This is our top-level view. Drilling down further we see more data suggestive of more upside.
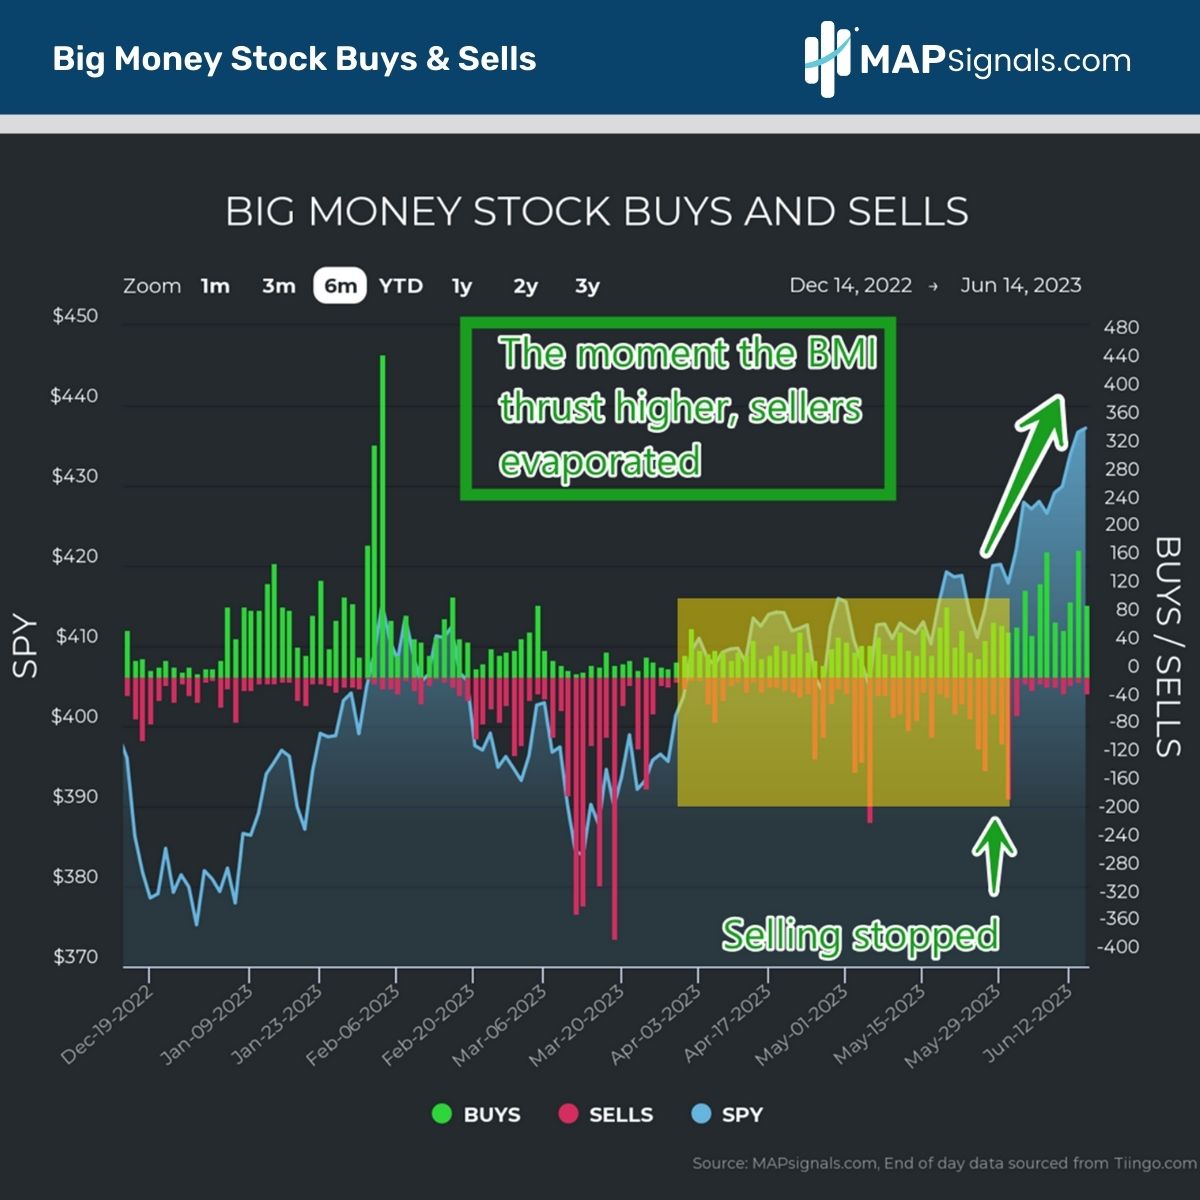
While many technicians solely focus on positive price action, they can easily miss the bigger narrative. Stock selling has ground to a halt, paving the way for prices to fly higher.
Below shows this beautifully in our daily buys and sells chart. The green bars below show how breadth is expanding:
Telling you what’s already happened is great and all, but the true alpha is buried in our historical messages. As a reminder, we were front and center late last year about why stocks can be a good bet in 2023.
Later we kept at it, suggesting you don’t rule out new highs. BUT there’s more! One year ago, stocks entered the dreaded bear market with the S&P 500 falling 20% below its peak. Check it out:
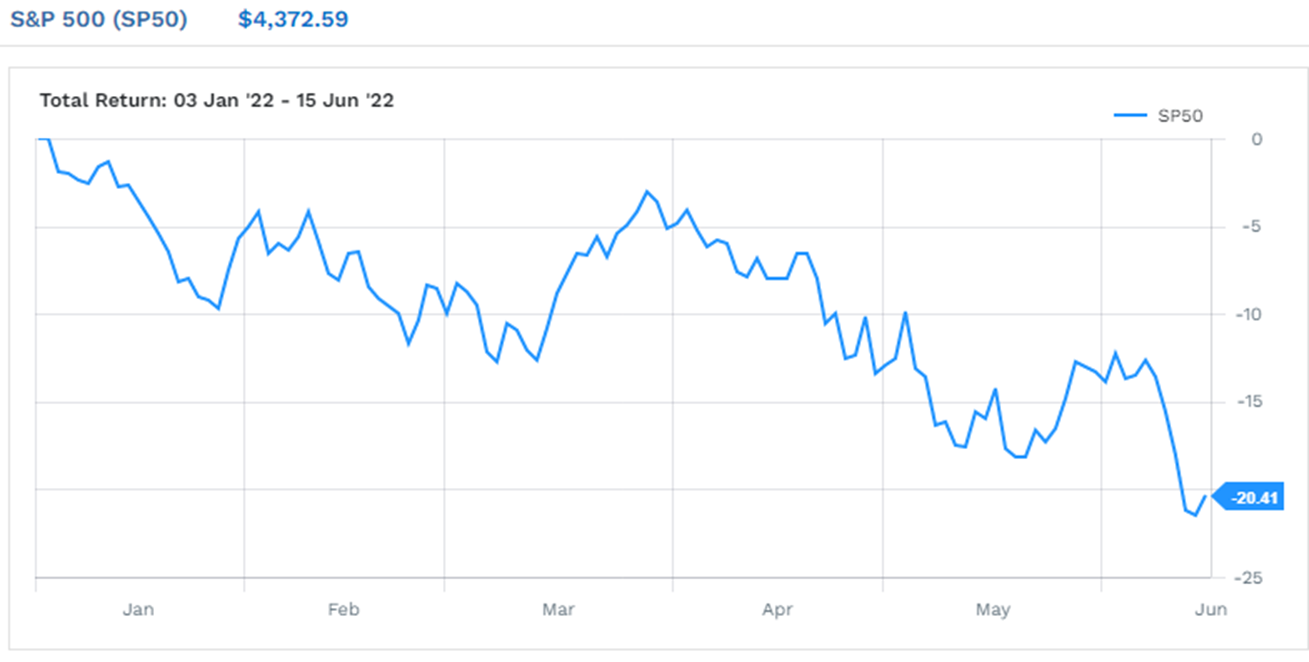
While many folks saw no opportunity, MAPsignals did! That’s because the price action alone didn’t tell the whole story. Our data revealed heavy capitulation under the surface.
The level of carnage was off the charts:
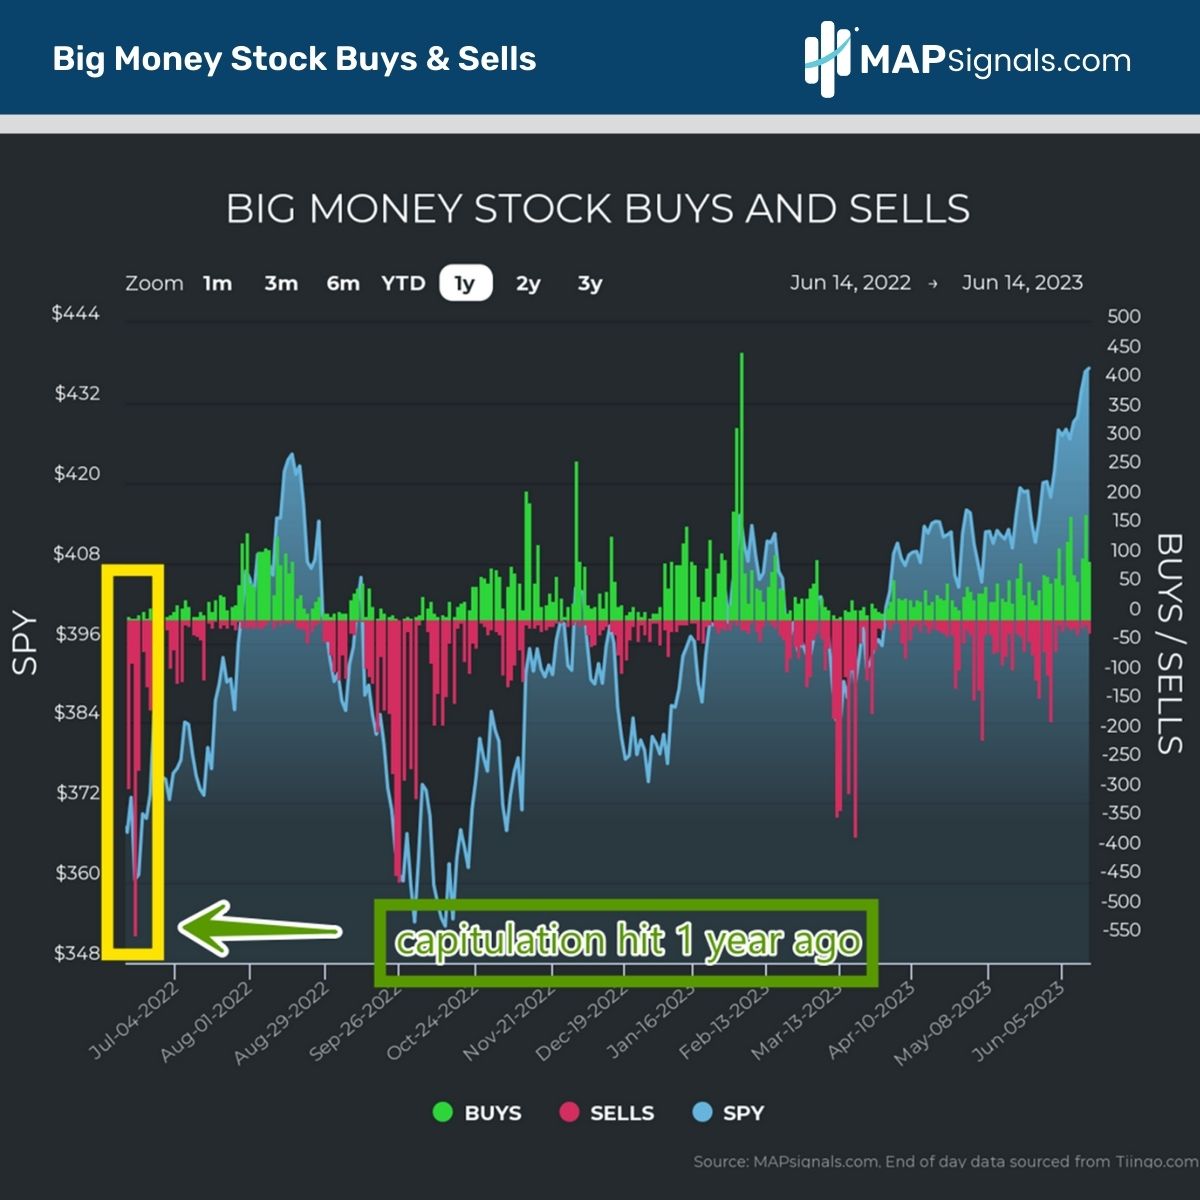
June 16th revealed the largest sell day we’d seen since the pandemic. Over 30% of our institutional universe was sold…that’s super rare.
Inside that post wasn’t a message of despair. Conversely, it was a positive forecast.
I provided a historical study looking at the forward performance for the S&P 500 post similar selloffs. In 20 years of data, it had only happened 61 times.
Post such a rare event, the 12-month forward return for the market averaged a crowd-pleasing 20.1% gain:

Now, here’s where data shines. Want to guess the forward performance of the S&P 500 from a year ago? Answer: Stocks have rallied 19%!
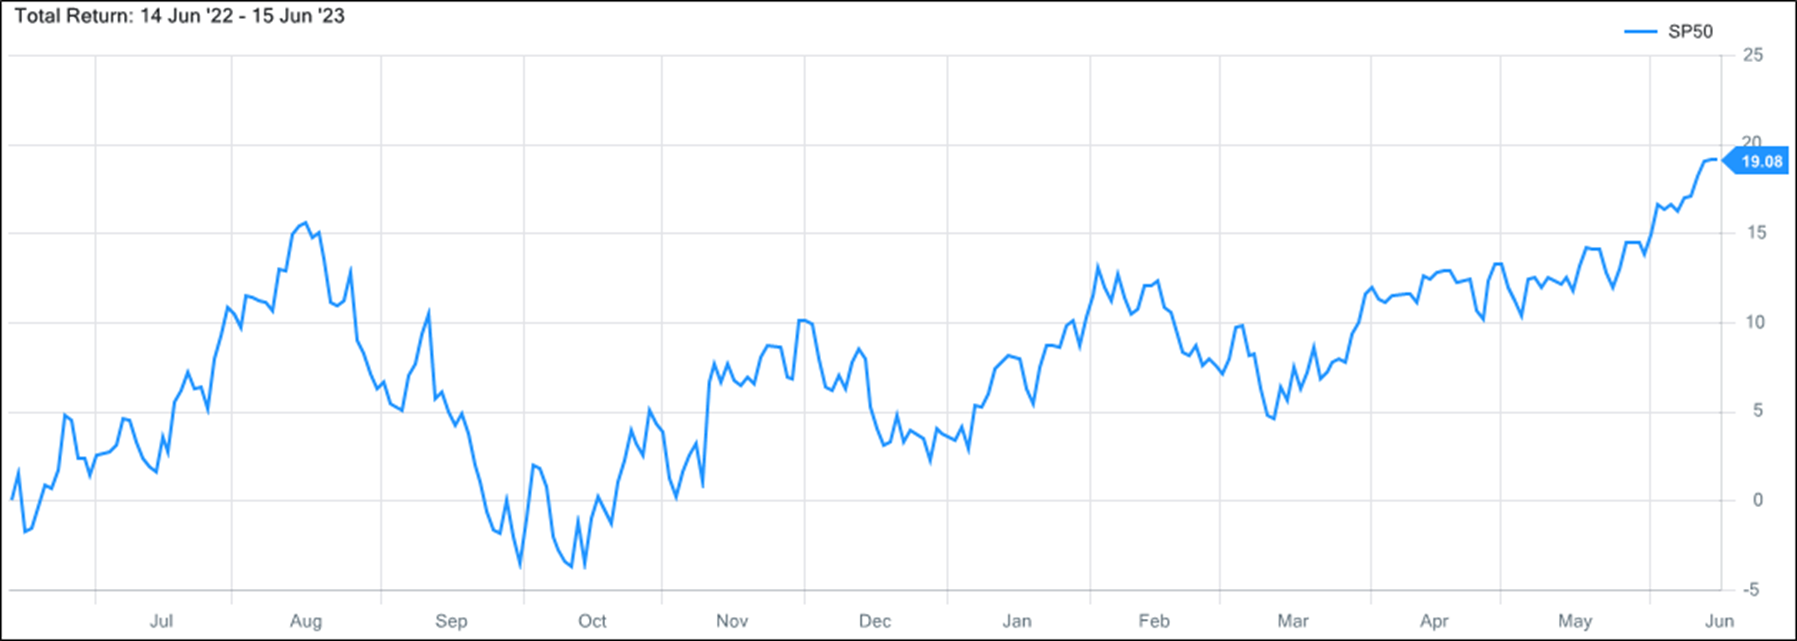
That’s the power of data. What helped guide us during the turbulent times then will guide us during the rebuilding process happening now.
Stocks have recently entered a new bull market according to the 20% rally from the lows. But my bet is that the 2023 bull market is just getting started.
Many of the companies getting accumulated in our data are brand new, indicating a massive runway for the future. Select semiconductors, discretionary names, and more are beating, raising, and defying the bearish media narrative.
We’re witnessing one of the strongest risk-on events I’ve seen in many years.
As I said earlier, if you wait for the all-clear message from the media to buy stocks, you’ll miss the grand opportunity. A better bet might be to get MAP!
Let’s wrap up.
Here’s the bottom line: Stocks recently entered a bull market a year after falling into a bear market. Staying constructive on stocks has been rare. More importantly it’s been profitable.
Capitulation signals a year ago suggested stocks would rally 20%… and they did. The crowd continues to be stunned.
As I’ve highlighted many times this year, we’re in the midst of a monster rally for select equities. The 2023 bull market is just getting started.
If you’re a professional investor looking for a different narrative than the mainstream media, get going with a MAPsignals subscription.
Can you invest without a map? Sure. I just can’t recommend it 😊
Have a great week!