
Tech Stock Washout: Institutional Outflows Reveal Market Bottom
by Jason Bodner All, Big Money Insights Weekly, StocksThe Washout Is Done. History Says Look Up.
Nvidia was born in a San Jose Denny’s in 1993. Founder Jensen Huang knew the restaurant well because he was a teenage dishwasher and busboy at Denny’s. Years later, when Nvidia’s stock hit $100, he tattooed the company logo on his arm. On Thursday, 33 years after that first meeting, he resigned.
A year ago, headlines like that could have smacked the market for a week. This time the S&P 500 closed down 0.35%. How the market reacted tells us more about where we are than the headline does.
The Flush Already Happened
I think we’re in the final innings of a volatility washout. Technology sector data proves it.
Tech Stock Washout: Institutional Outflows Reveal Market Bottom
Over the past 20 trading days, roughly 490 tech stocks had outflows. That puts it in the top 7% of all such stretches since MoneyFlows tech data begins in 2020. On Nov. 5 alone 118 tech stocks had outflows, making it the fifth-heaviest day on record, just behind the April 2025 tariff crash.
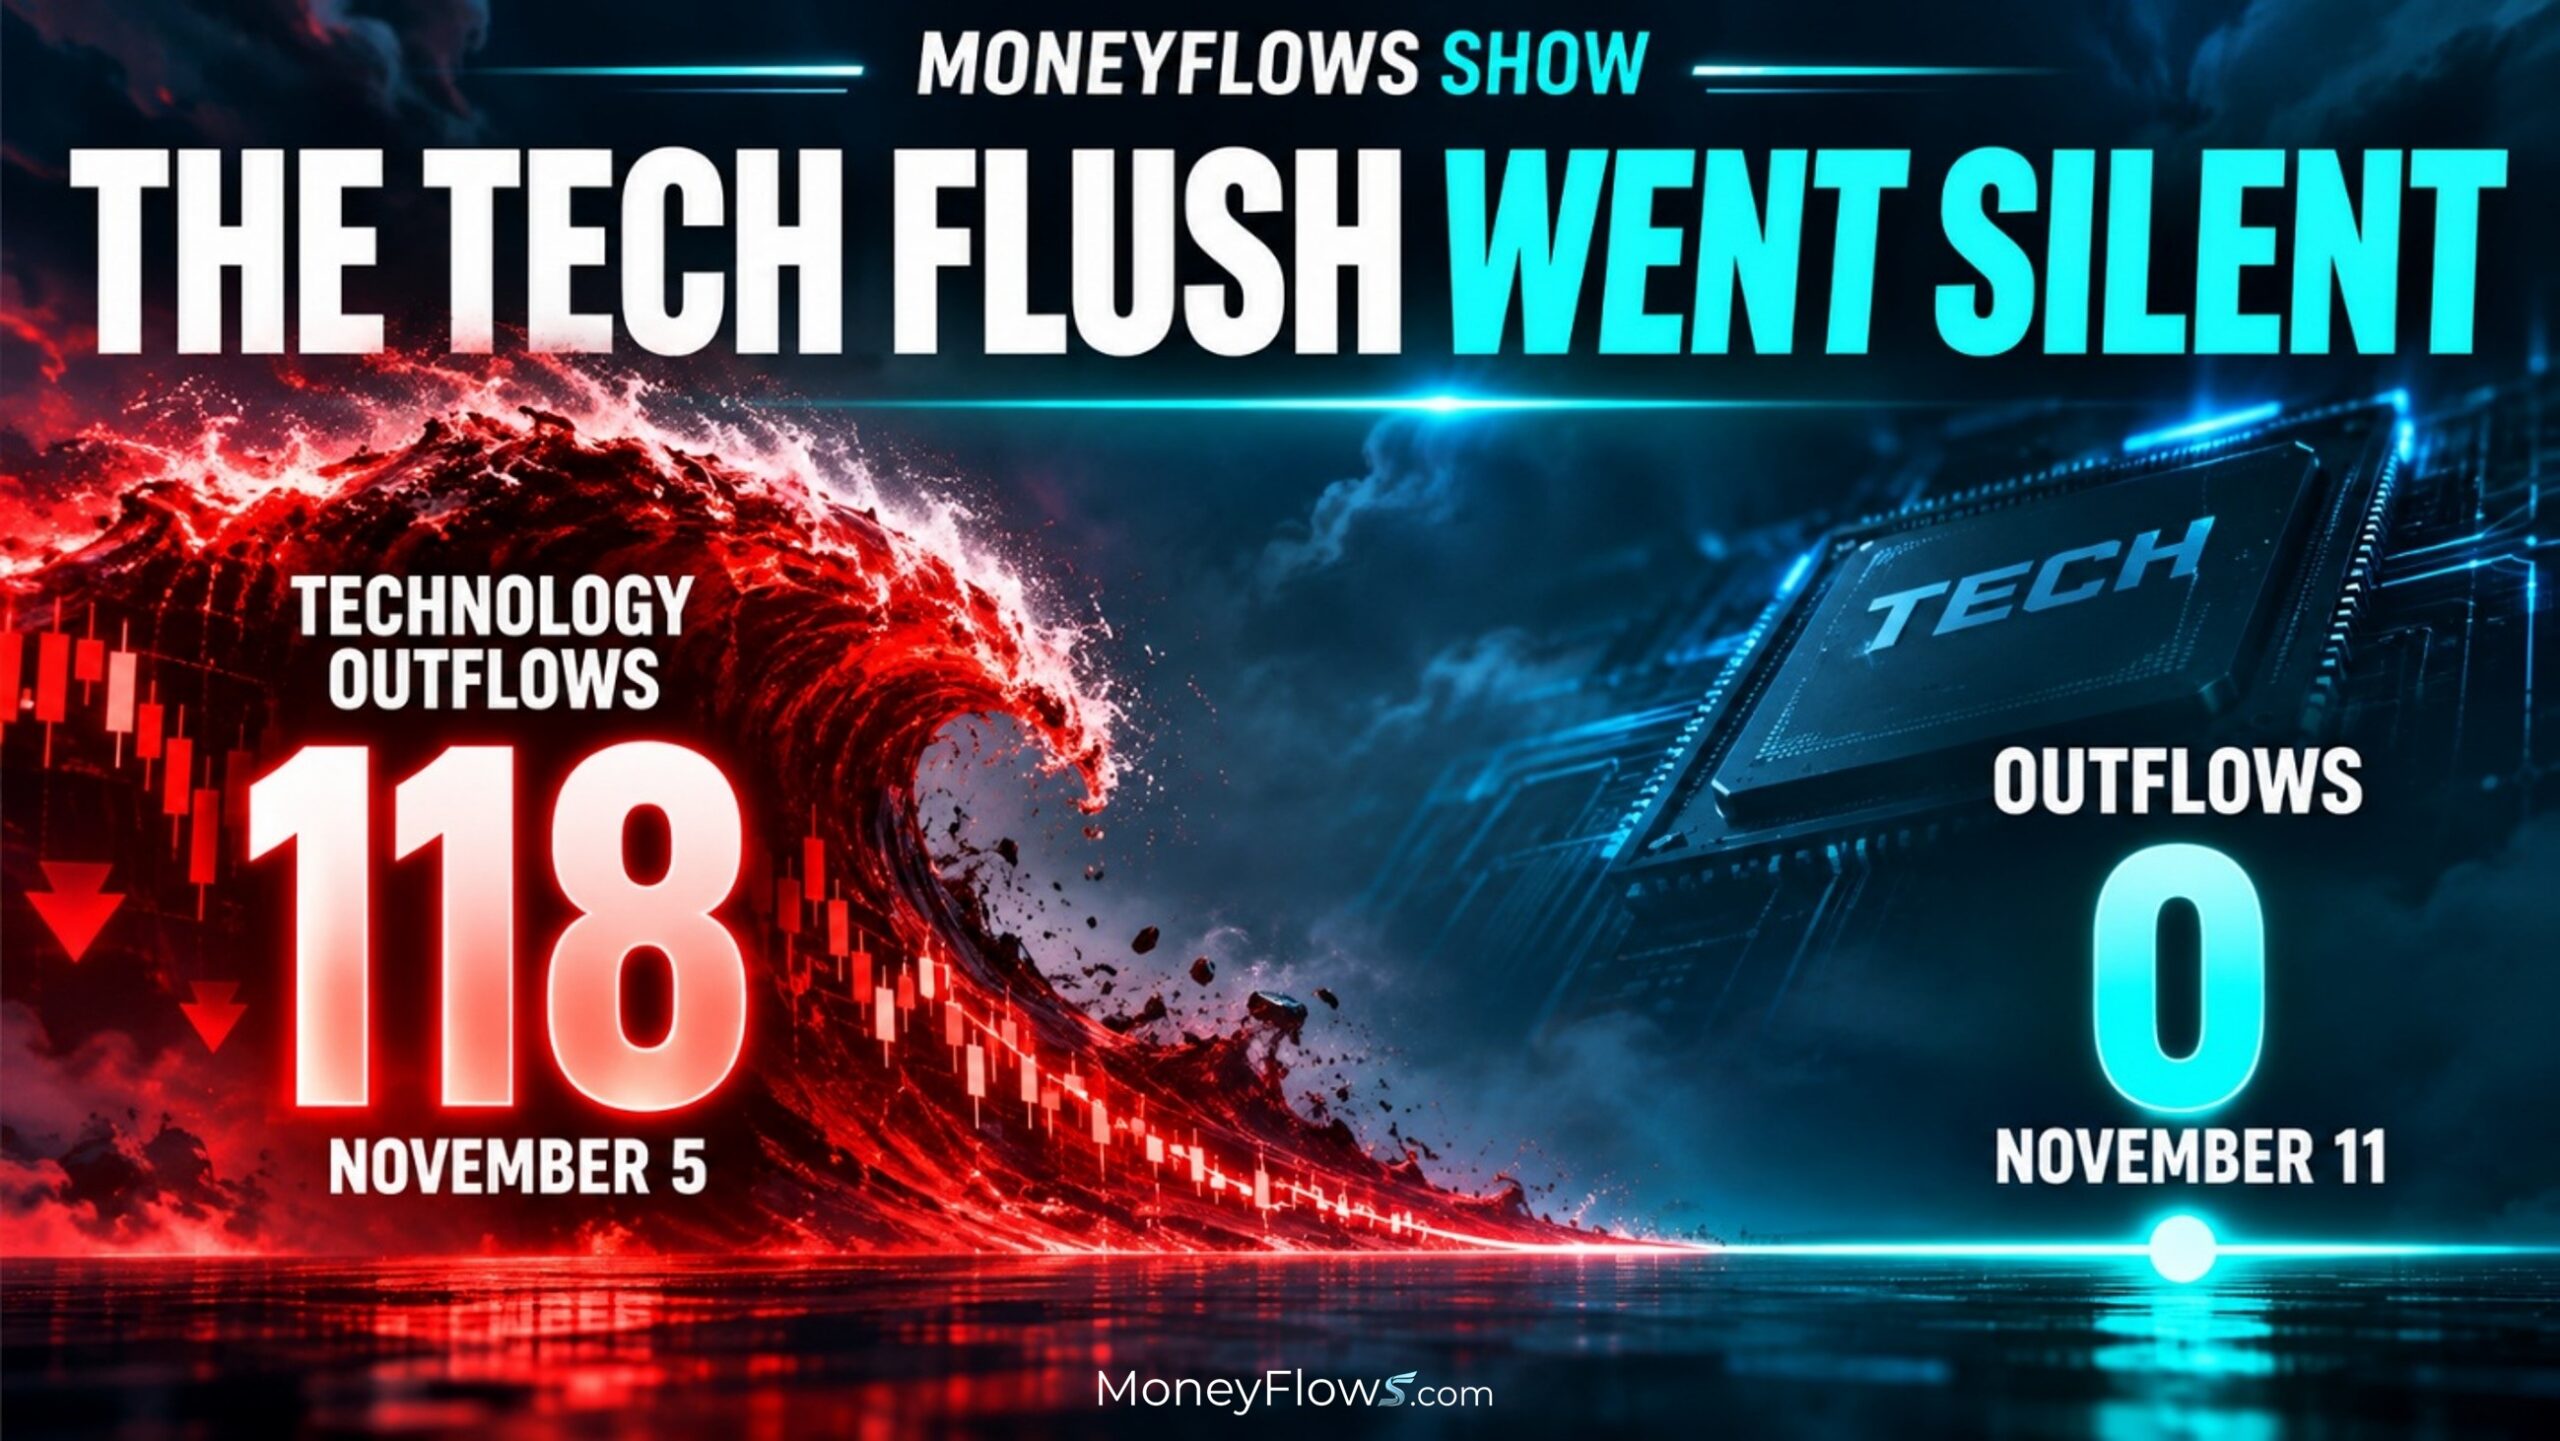
Since 2020, tech has seen an outflow wave this big only four other times. In three of them, tech stocks were higher six and nine months later, with median gains of 25% and 35%. The last one came a year ago almost to the week, and tech rose 36% over the next six months. The exception was December 2021, which kicked off the 2022 bear market.
So, what separates a bottom from a deeper drop? What happens next.
Since 2020, we’ve seen 10 days with 100 or more tech outflows. Usually outflows kept coming, often 10 to 1 over the next four sessions. After Nov. 5, inflows won, 37 to 32, a first in our data. The three closest matches, where inflows returned fastest, dipped the next week. Three months later, tech was higher each time, averaging a 21% gain.
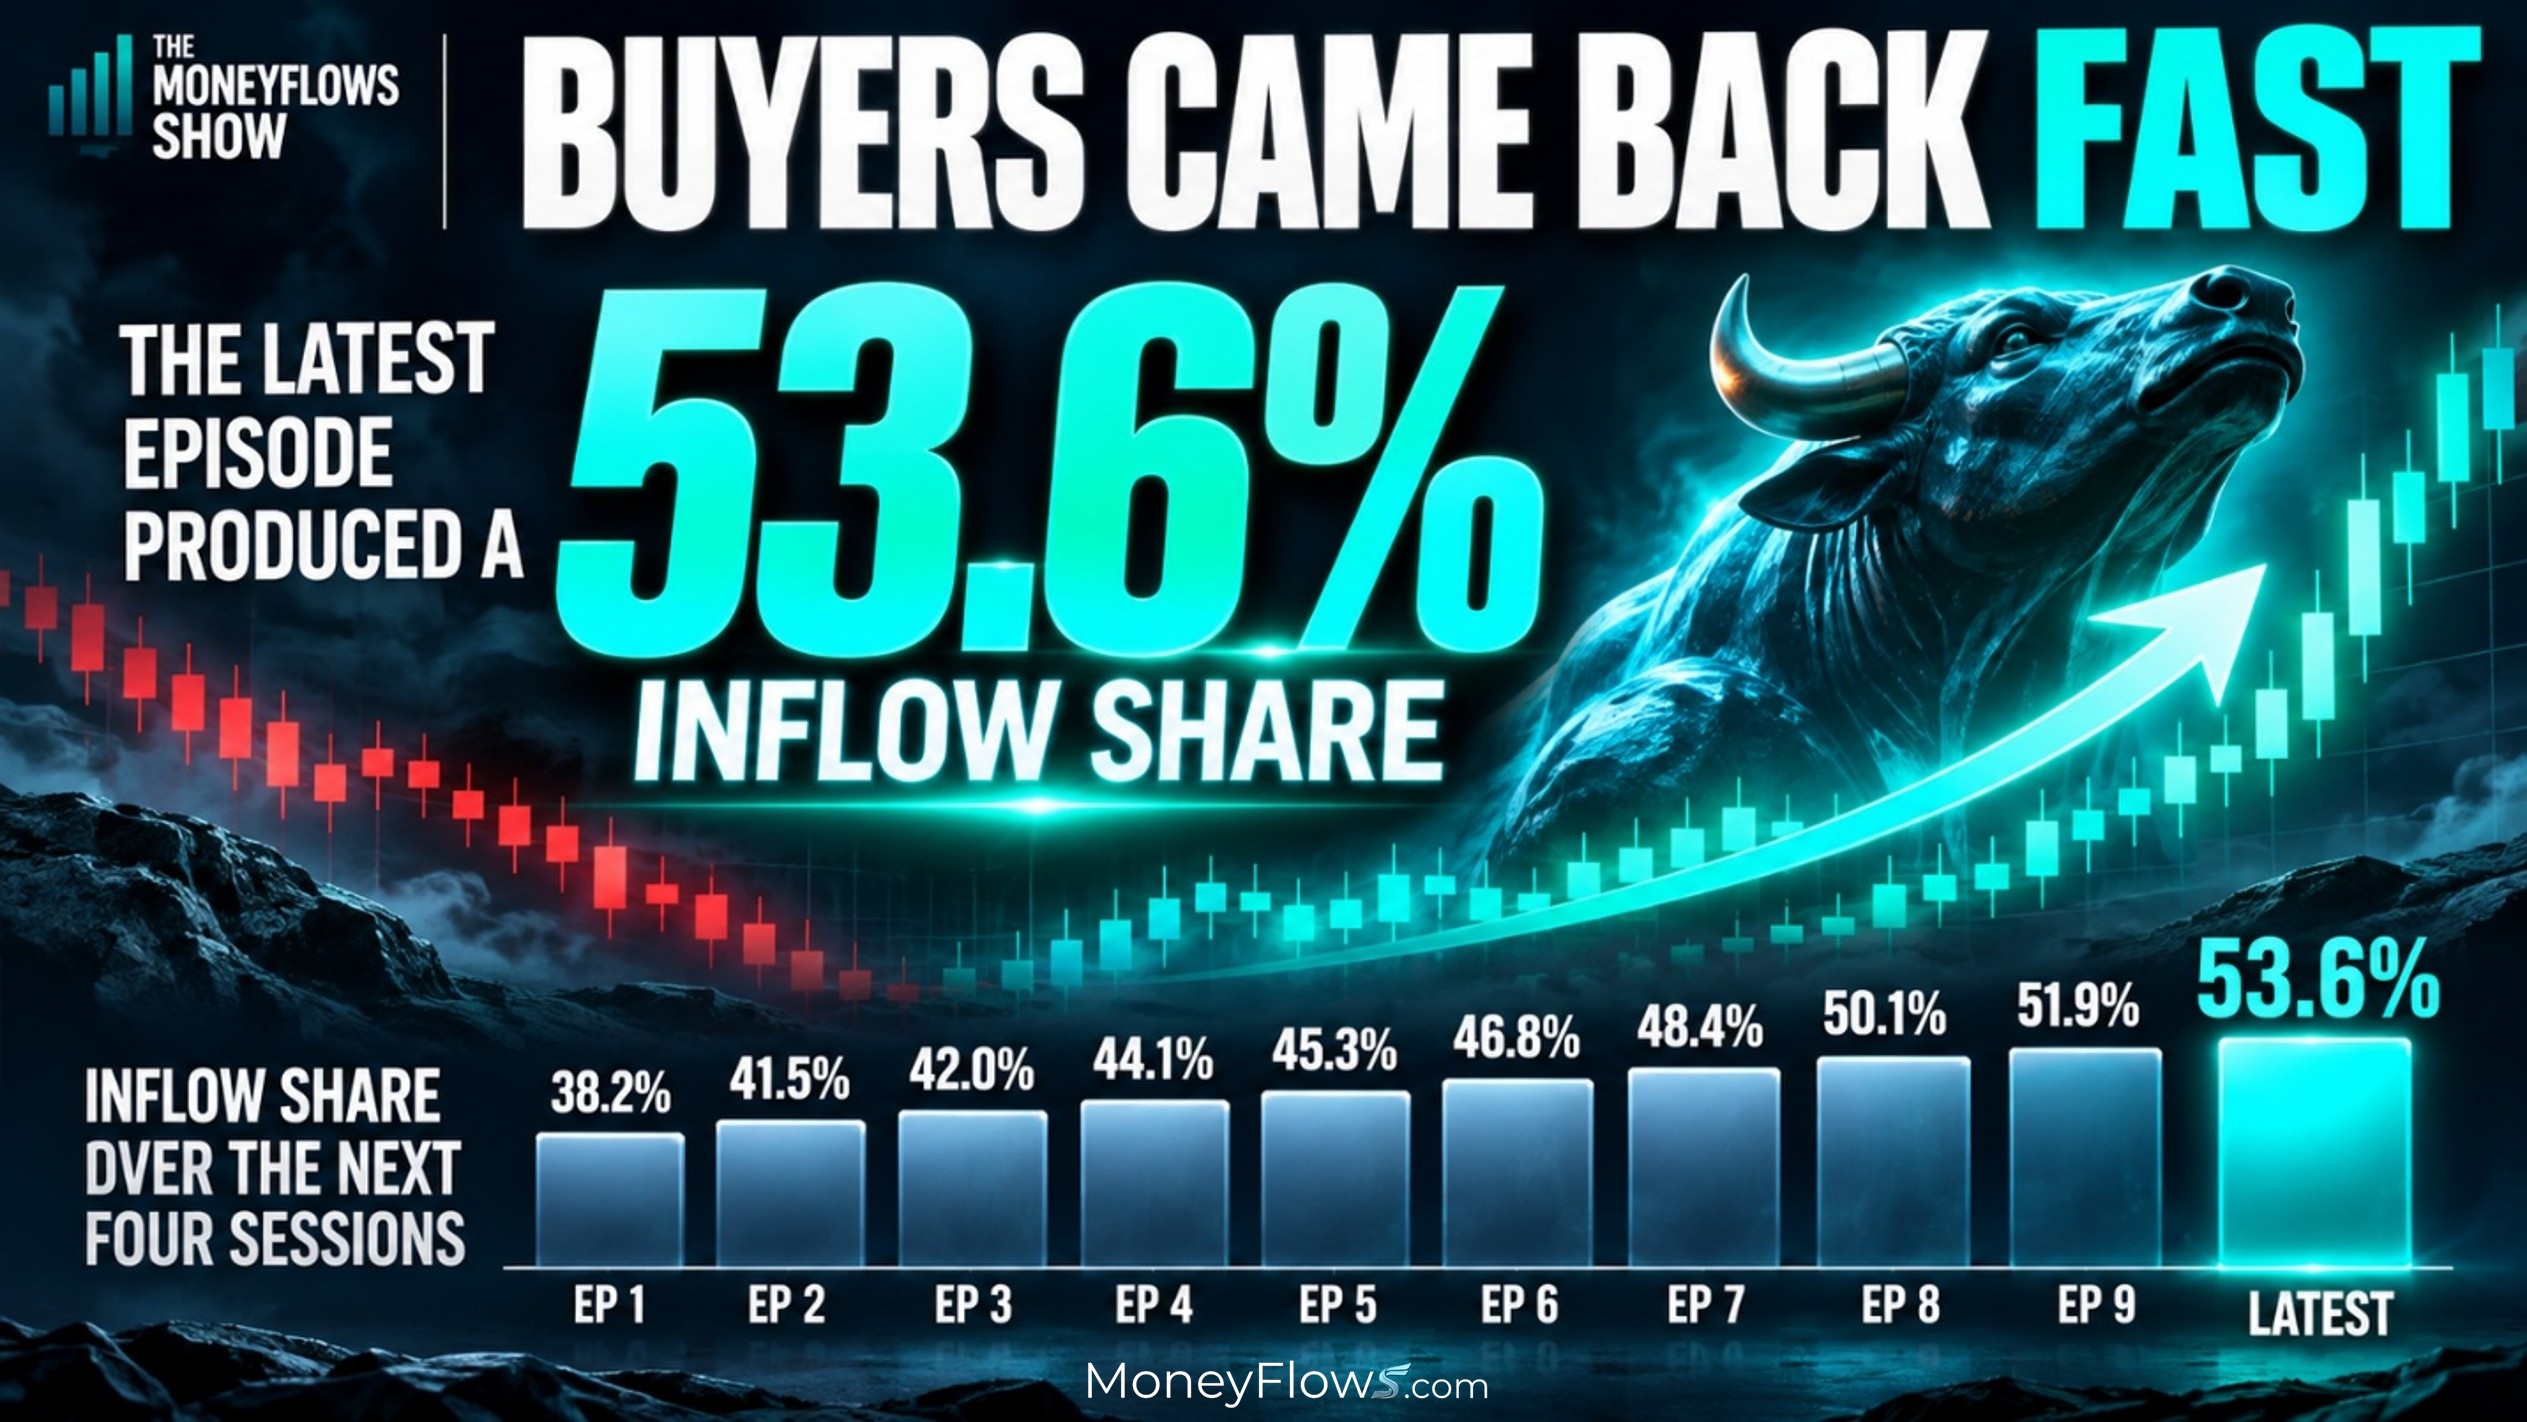
Outflows that just stop are what exhaustion looks like. Morgan Stanley says hedge funds cut risk at the fastest pace in more than a decade in early November. The forced sellers already sold.
Then Came the Stress Test
The Big Money Index rose from 42.6% to 49.1% over the past week and went up every single day, including Nvidia day.
The most important company in the AI trade lost its founder overnight. Its stock fell as much as 14% intraday and then closed down just 4.3%. So, buyers took back more than two-thirds of the drop before the bell. The broad market barely moved. Other chipmakers rallied hard, and the money moved around inside AI instead of leaving it.
A market that’s still fragile breaks on news like that. A market that’s healing absorbs it.
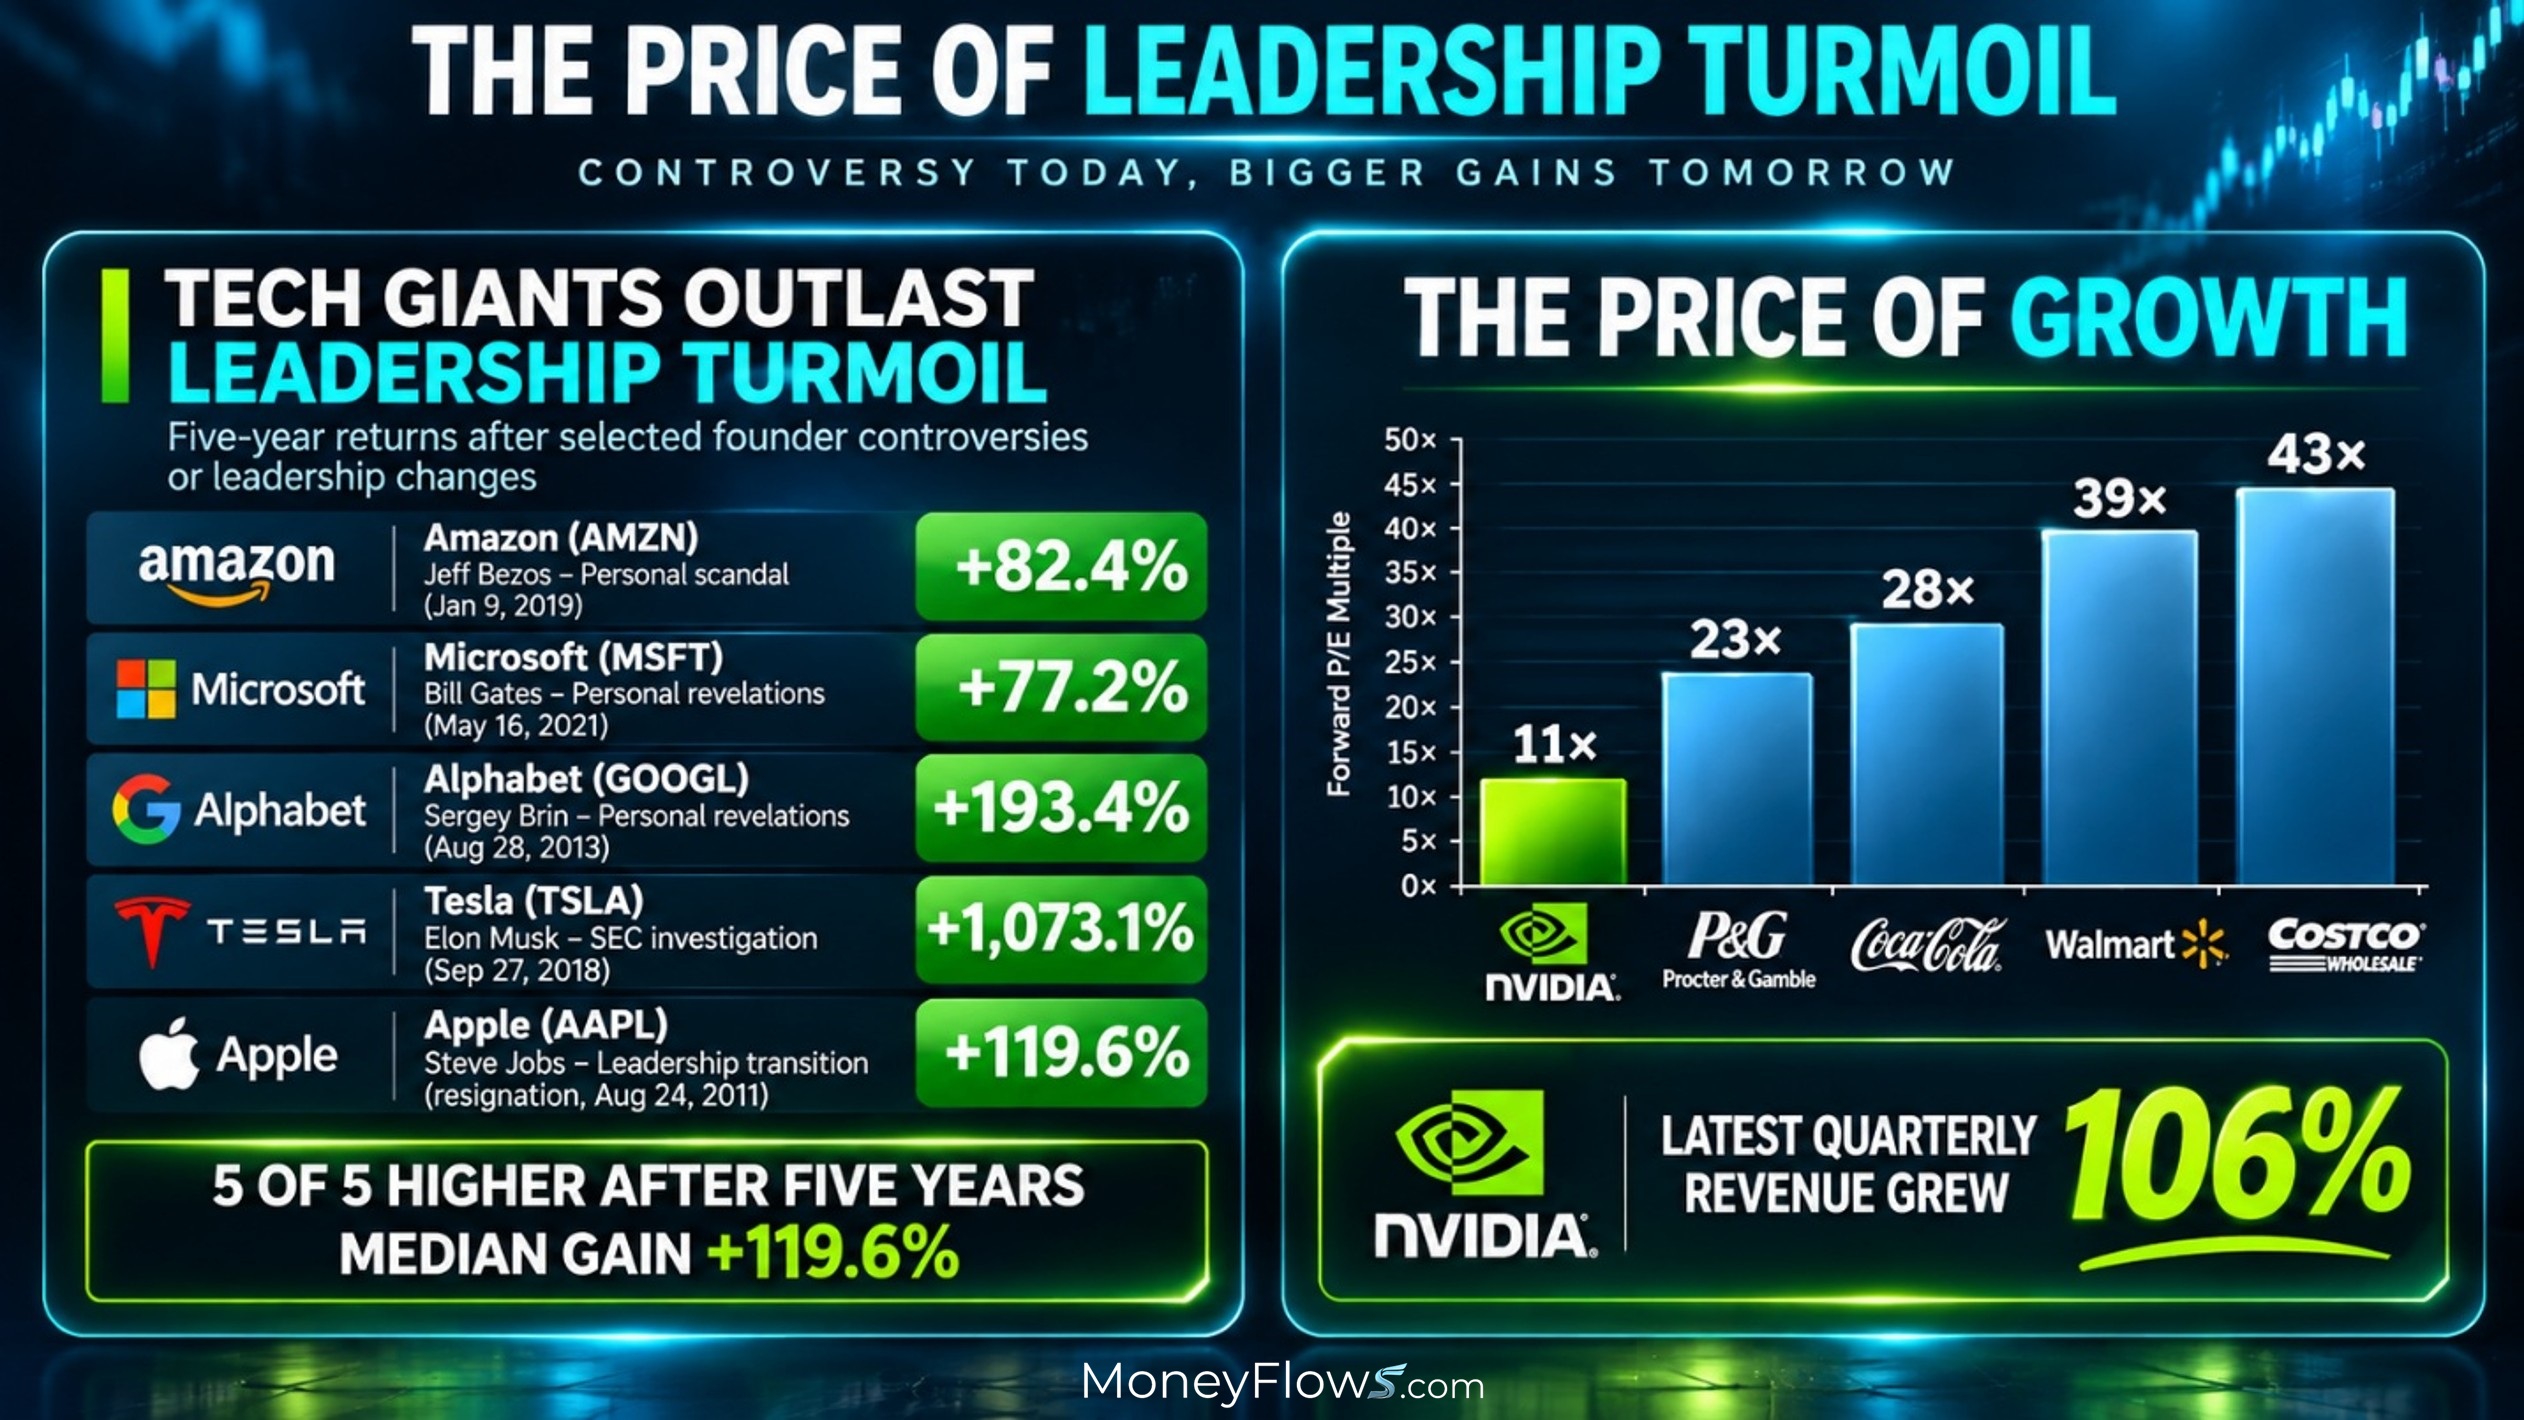
The scandal is serious, but it’s about one man, not the business. History is on Nvidia’s side. I studied five tech giants hit by founder scandals or major leadership changes. All five were higher two years later, and all five were higher five years later.
Products and earnings outlasted the headlines. Today Nvidia trades at about 11 times forward earnings, its cheapest valuation in 15 years, while revenue grows more than 100%. Procter & Gamble and Costco trade at 23 and 43 times. Investors are paying more for soap and groceries than for the engine of AI. That gap won’t last.
Big Money is Leaving the Fear Trades
Where the money goes matters as much as how much. This week our exchange-traded fund data showed outflows from gold funds, bitcoin and ether funds, and preferred stock funds. In stocks, energy drew zero inflows and 19 outflows, even with oil near $88. That’s investors taking off their hedges.
The inflows went into health care, industrials, utilities, and consumer names. Tech is starting to come back too. It drew 33 inflows against 20 outflows this week, and on Wednesday every tech signal was an inflow. So far that’s software and internet names, not chips. When the semis join in, that’s the next confirmation.
The Fastest Growers Are on Sale
This is the part the fear crowd keeps missing: with 88% of the S&P 500 already reporting earnings, FactSet says 84% of companies beat earnings estimates and 74% beat revenue expectations. Third-quarter earnings are up 31.4%. Yet the forward P/E fell to 17.7, below its five-year average of 19.8.
The real bargains are in growth.
I screened every stock over $2 billion that’s growing both sales and earnings by 20% or more. Two-thirds of them are in bear markets, at a median 31% below their highs. Their earnings are growing 38%, nearly four times the rest of the market. Semis are the extreme case: 84% are in bear markets while their earnings grow more than three times faster than everything else.
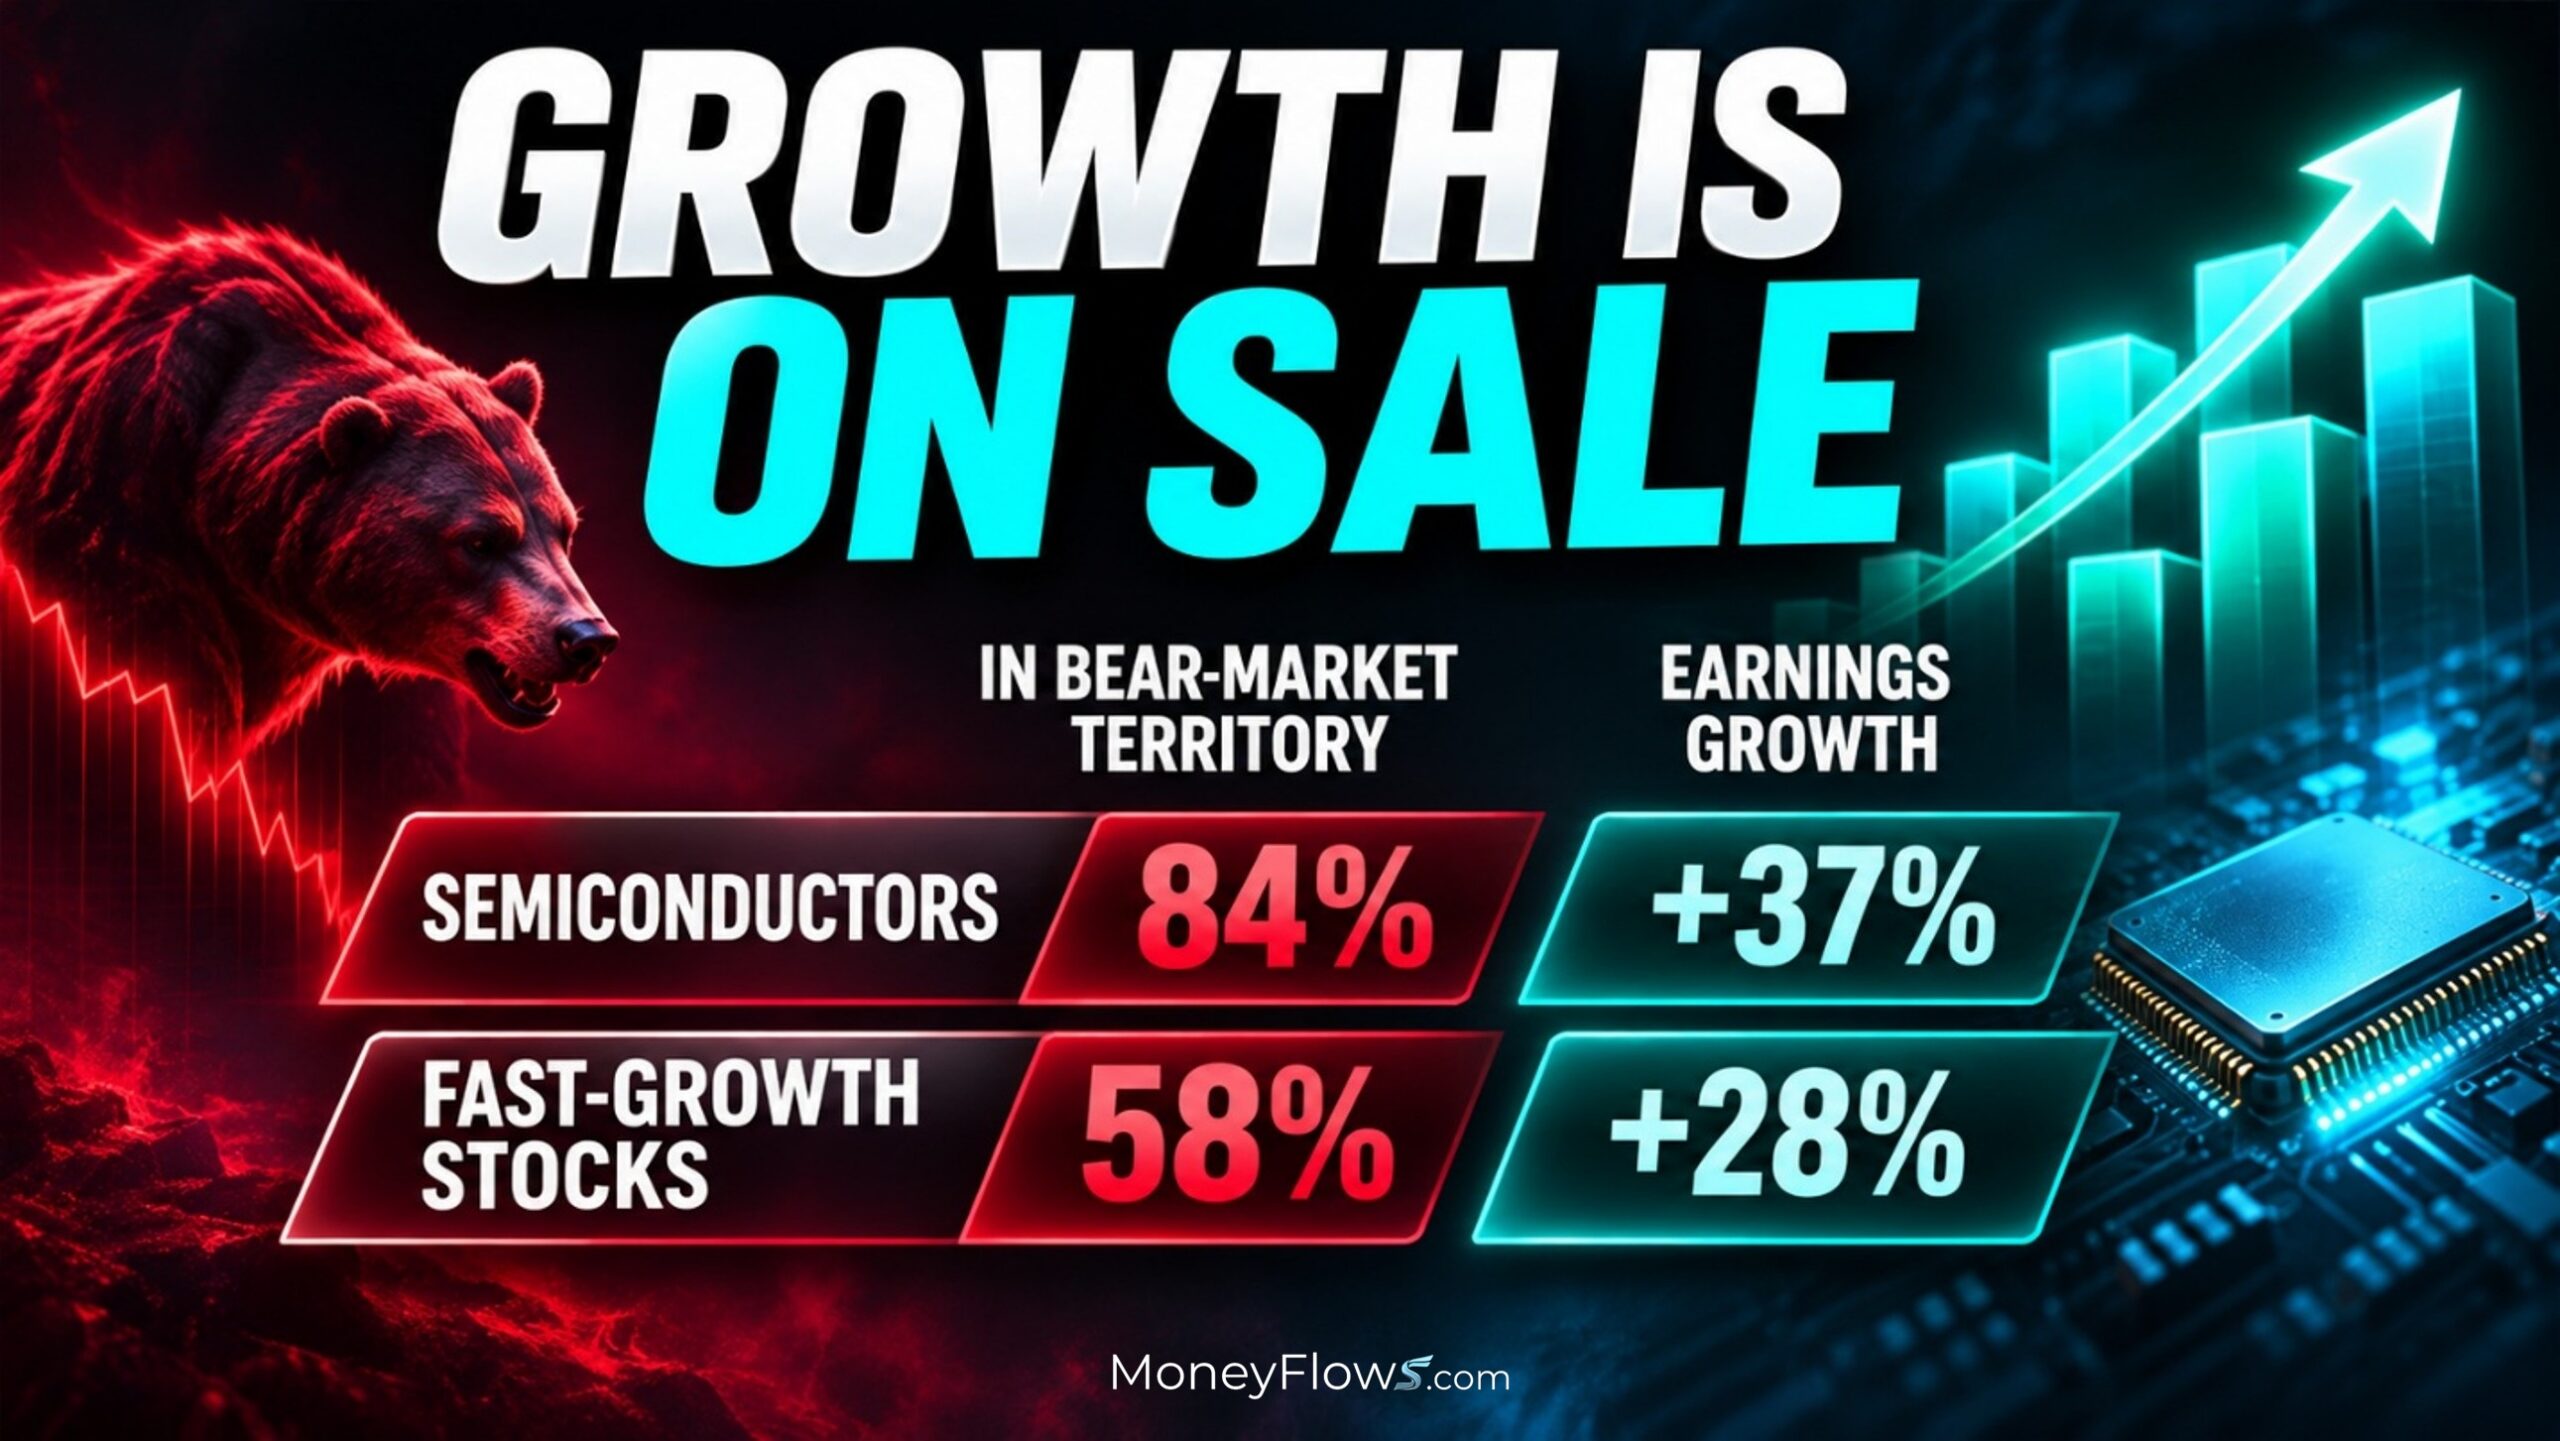
I also track a group of the fastest-growing AI infrastructure stocks. The median name is 49% below its high, yet its earnings are growing 30%. Since their recent lows, they’ve bounced a median 21%, which is nearly double the average stock. They’ve had big up days and quieter down days, with higher highs and higher lows. The names that got hit hardest are leading the recovery.
When the best growth is priced like it’s broken, the setup favors buyers.
A Perfect Record
This is the stat I’d circle. I looked at where the S&P 500 went from Nov. 12 of every midterm election year since 1990.
Six months later, it was higher every time. Nine months later, higher every time. A year later, higher every time. That’s nine for nine.
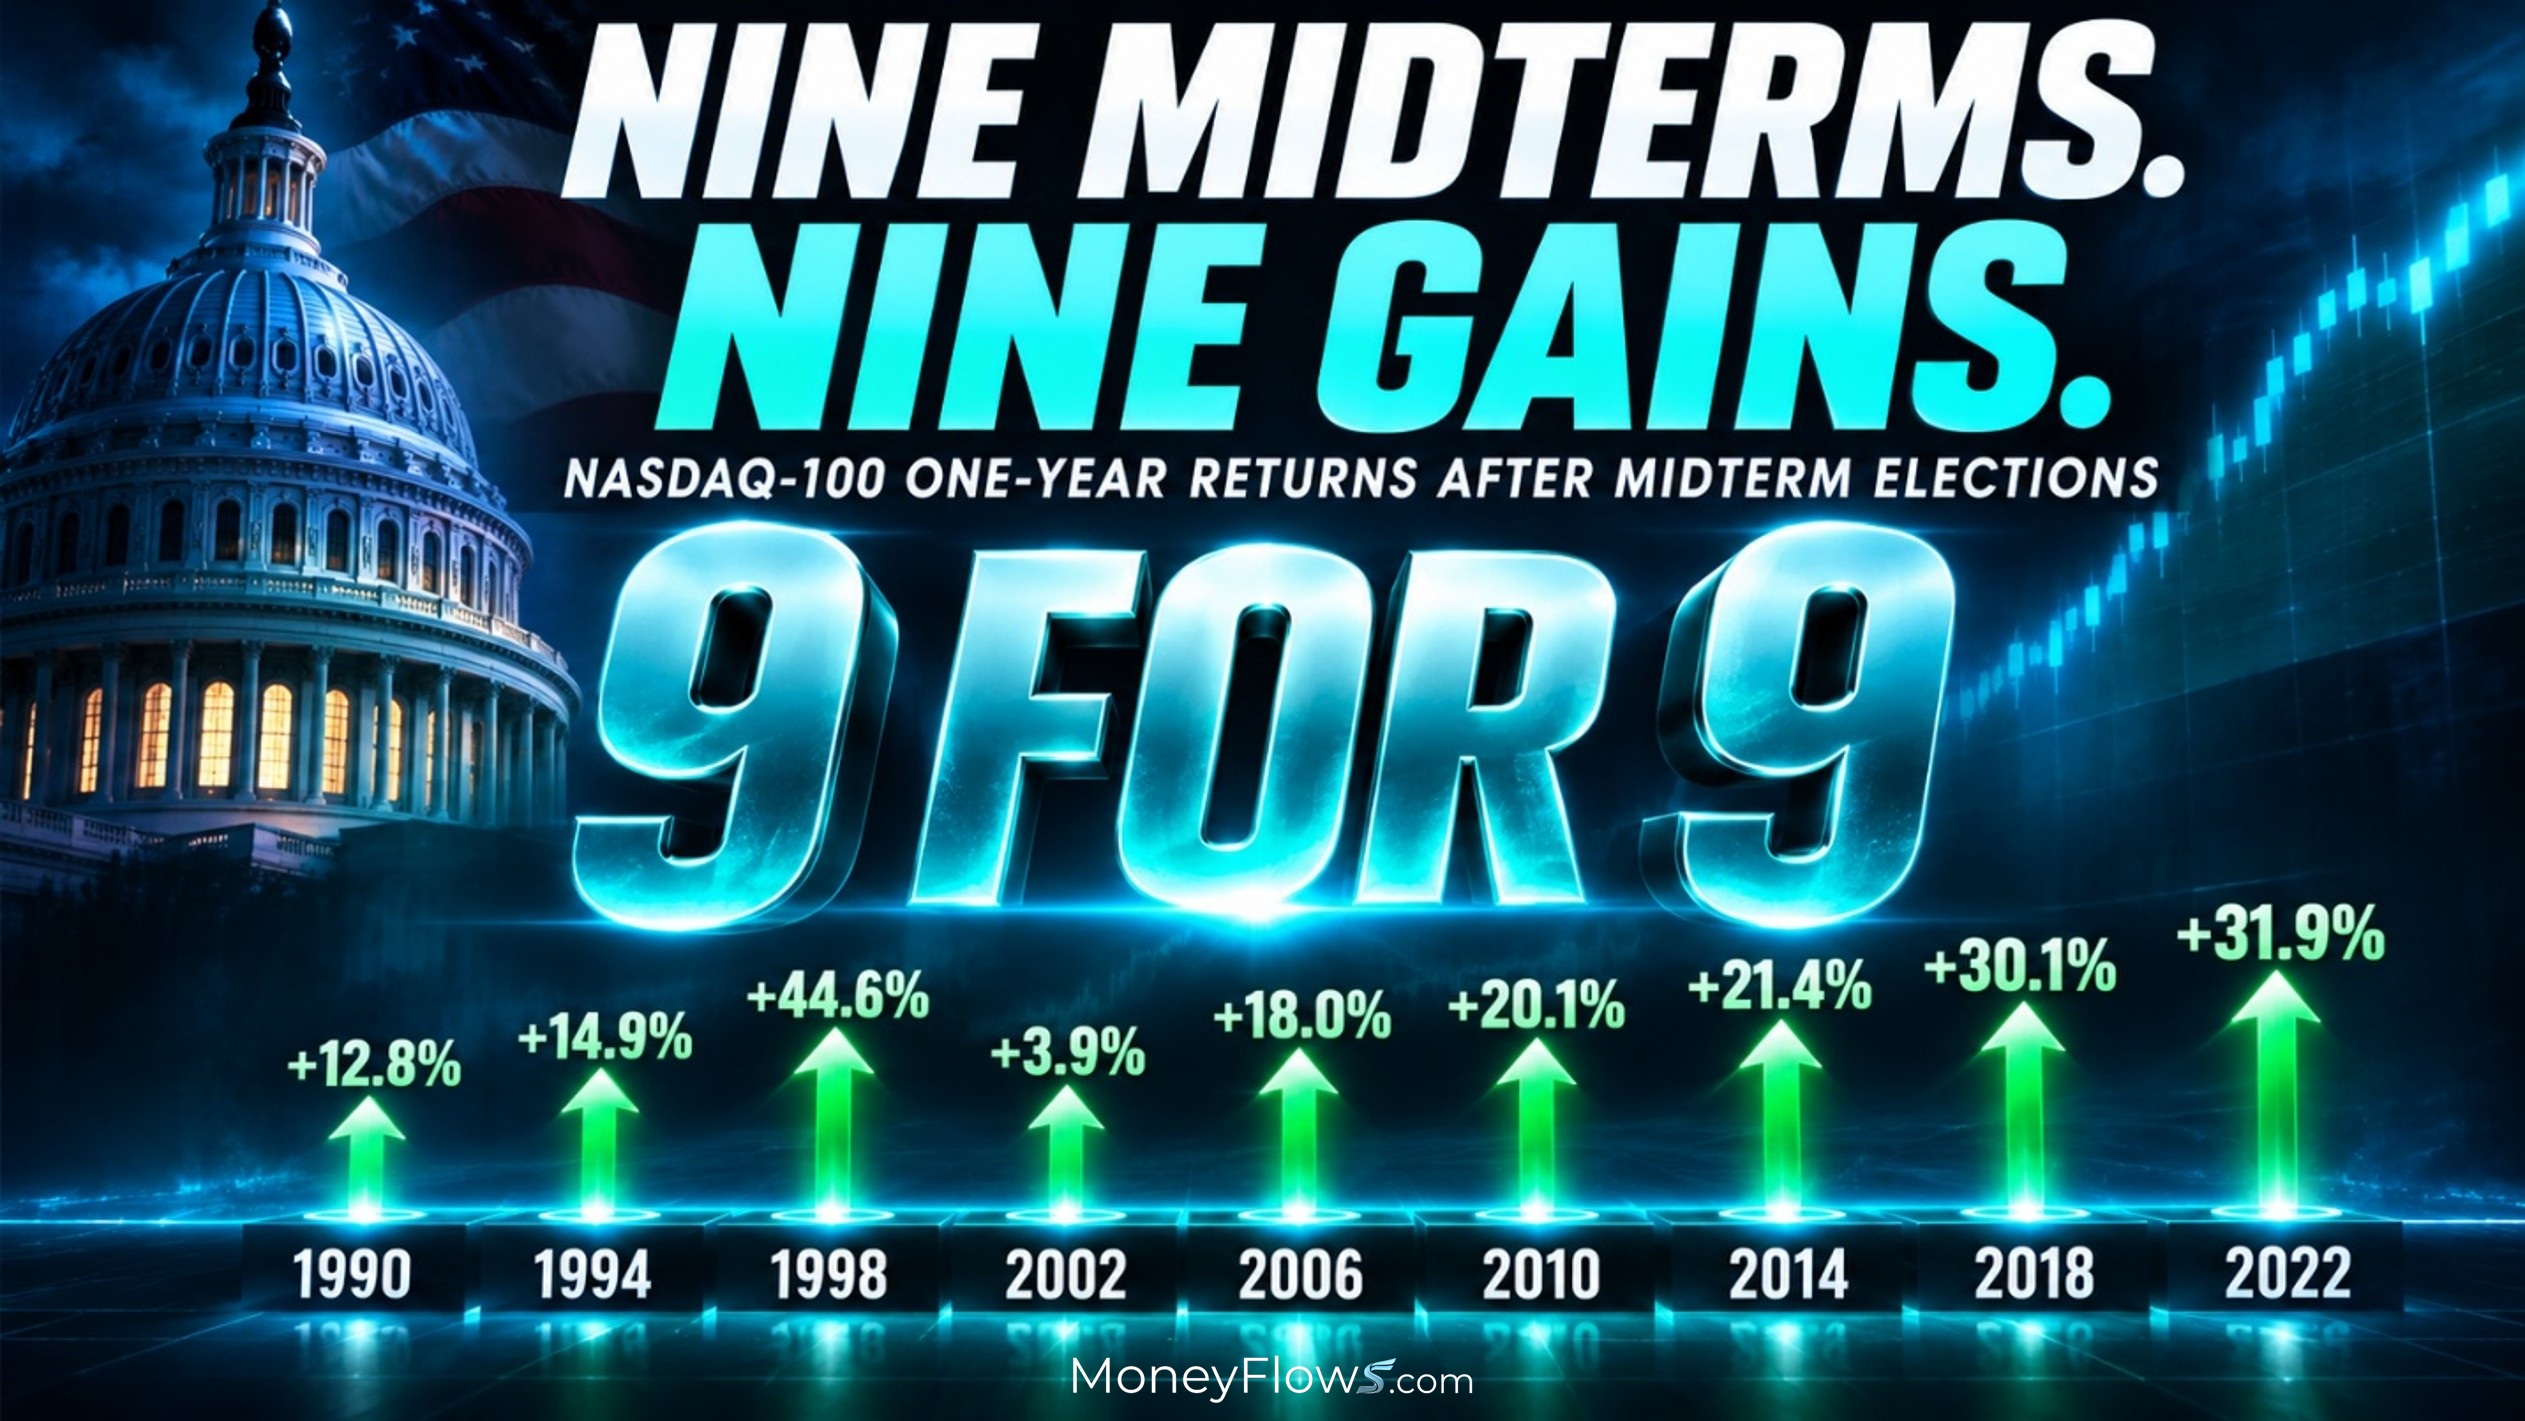
The average one-year gain was 15.2%. Every year after Nov. 12, it was 10.7%. Midterm years are known for a rough middle and a strong finish. We’re right on schedule.
It Pays To Be Optimistic
Stocks have been in bull markets about 78% of the time since 1929. Pessimism sounds smart, but optimism pays.
That doesn’t mean to ignore risks. The 10-year Treasury yield hit 5.16% Friday, the Federal Reserve is hiking rates, and Nvidia reports Tuesday under a new CEO. Friday’s pullback fits the playbook.
After big tech outflow days, the first month was usually choppy, but three to nine months later, tech was usually much higher. Outside tech, volume was light. Tech traded heavy, and that’s the tell to watch. If tech outflows return and the BMI rolls over, the market needs more time. Until then, a retest is right on schedule.
Bottom Line
One company lost its founder, and the market digests. Tech flushed, then inflows won. The fastest growers are priced like they’re broken. And every midterm November since 1990 led to a higher market a year later.
Headlines say be afraid, but data indicates the storm clouds are parting.
Marcus Aurelius said, “Our life is what our thoughts make it.”
MoneyFlows finds the winners early…bringing them to you.
If you’re a serious investor or money manager, get started NOW.
Our PRO subscription allows you to spot daily flows and access our weekly Outlier 20 report.
This is the report that has found EVERY SINGLE ONE of our Outlier stocks.
Enjoy a click-through experience unlike anything out there.
Professional money managers and RIAs looking for additional portfolio solutions including ETF flows & ranks and your own Portfolio Tracking tools, please reach out about our Advisor Solution and Emerging Advisor Program.
Have a great week!
***Lastly, join me LIVE, Nov. 30 – Dec. 2, at the MoneyShow Masters Symposium Sarasota, FL. I’ll be presenting: Why the Midterm Election Historically Brings Epic Rallies – And What to Buy Now.
You don’t want to miss this! Click the image below to reserve your spot.