

Navigating Market Rogue Waves and Forced Selling
by Jason Bodner All, Big Money Insights Weekly, StocksFor centuries, sailors told of giant waves rising from calm seas. Scientists dismissed them as myths. Then, on Jan. 1, 1995, instruments on an oil rig logged an 84-foot wave. Rogue waves were real, just rare enough to escape proof.
This week, we got a rogue wave.
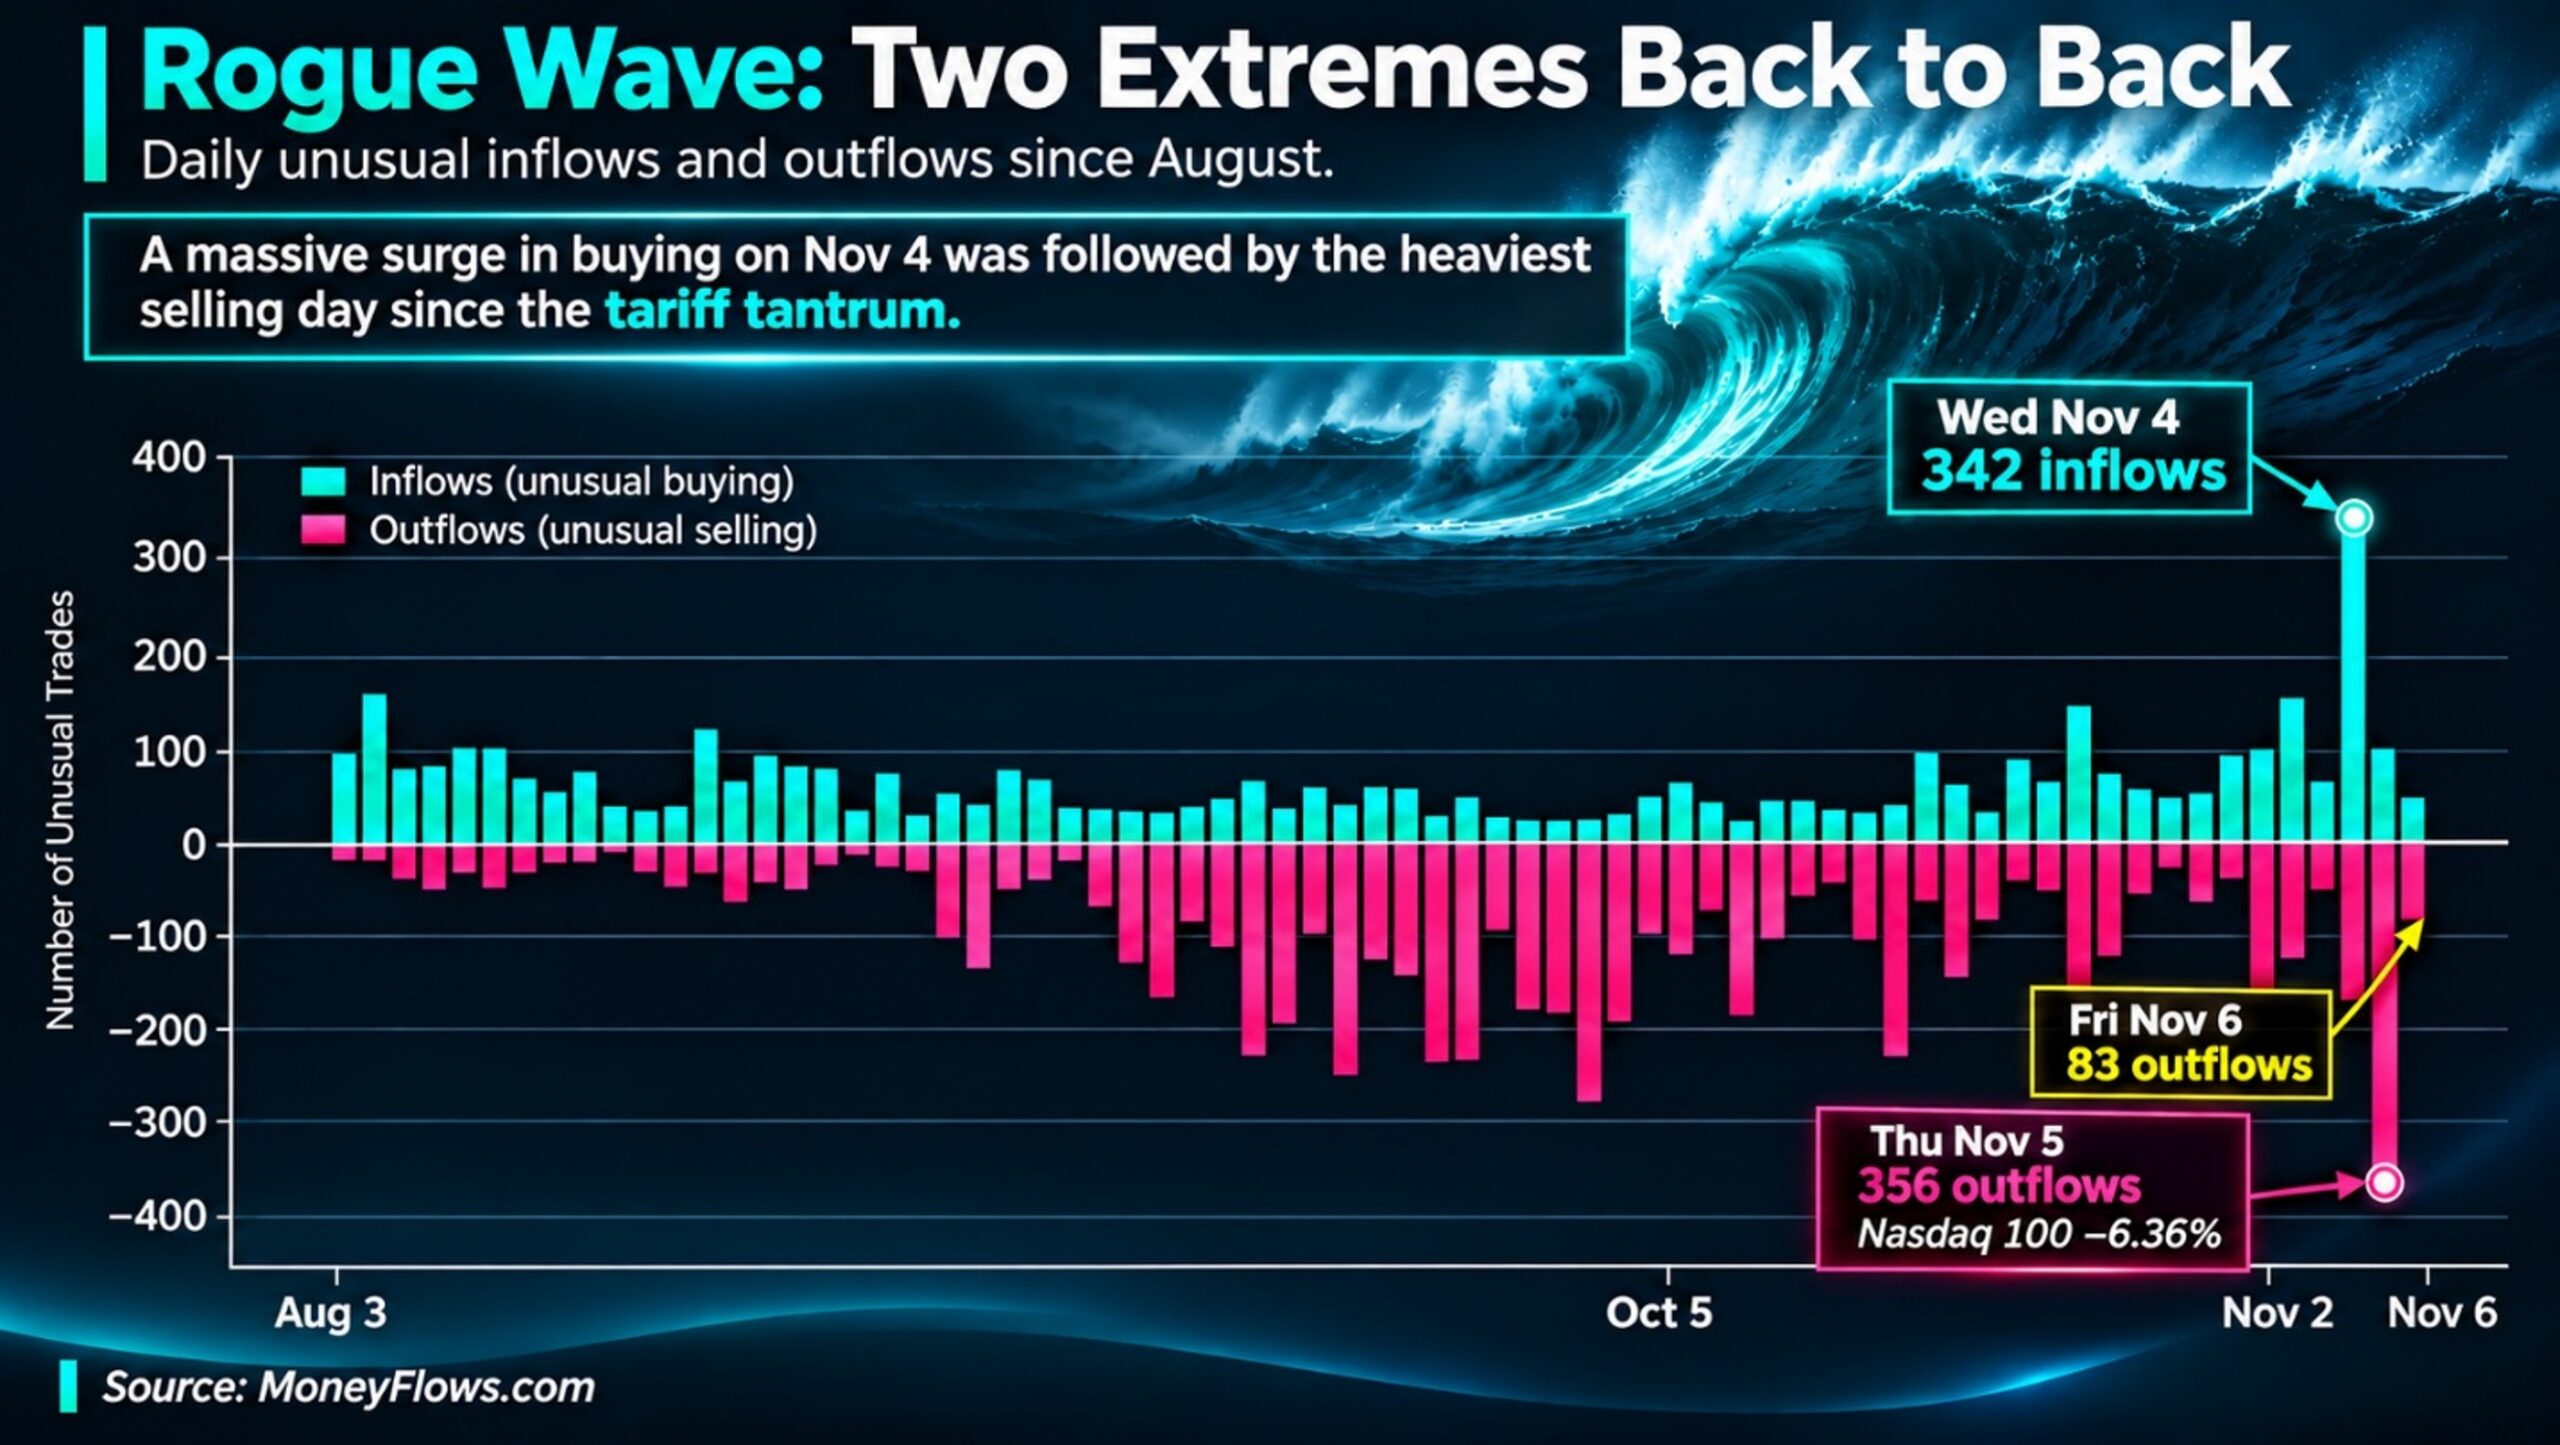
After the midterms, Wednesday brought 342 unusual inflows, ranking 17th among 9,200 trading days since 1990 – in the top 0.2%. Thursday, the Nasdaq 100 plunged 6.4% as we logged 356 outflows. In 36 years, we’ve never seen such extreme opposite days back-to-back. By elevated trading volume, it was the fourth heaviest two-day stretch in our data. Only the April 2025 tariff crash was bigger.
Headlines offered plenty of explanations. Democrats swept Congress. A lawmaker called for an AI pause. Texas elected a governor seeking data center restrictions. Qualcomm missed. Microsoft reportedly soured on neoclouds. Hedge funds were blowing up. Margin debt hit a record.
Pick your poison.
Here’s what I think really happened…
Navigating Market Rogue Waves and Forced Selling
This was classic forced selling. Goldman Sachs estimates technology-focused hedge funds lost over 4% Thursday, erasing a year that was up 24% in June. Funds de-risked before the election, chased Wednesday’s rally, then dumped Thursday. Hedge funds are closing pods too. Walleye Capital is returning $2 billion to investors and slashed its stock-picking team. Engineers Gate gutted its fundamental equity group. Leveraged exchange-traded funds had to rebalance, selling tens of billions in stock, mostly tech.
I’ve seen this firsthand. During the financial crisis, I ran North American equity derivatives at Cantor Fitzgerald. I oversaw the liquidation of a major Wall Street firm’s massive options book – billions in notional value. The order came from the top: sell everything. Options normally a penny wide suddenly traded 10 to 20 times wider. Buyers vanished. Think the film “Margin Call,” when Jeremy Irons said, “Sell everything, at whatever price the market gives you.”
That’s forced selling. Price stops measuring value and starts reflecting desperation.
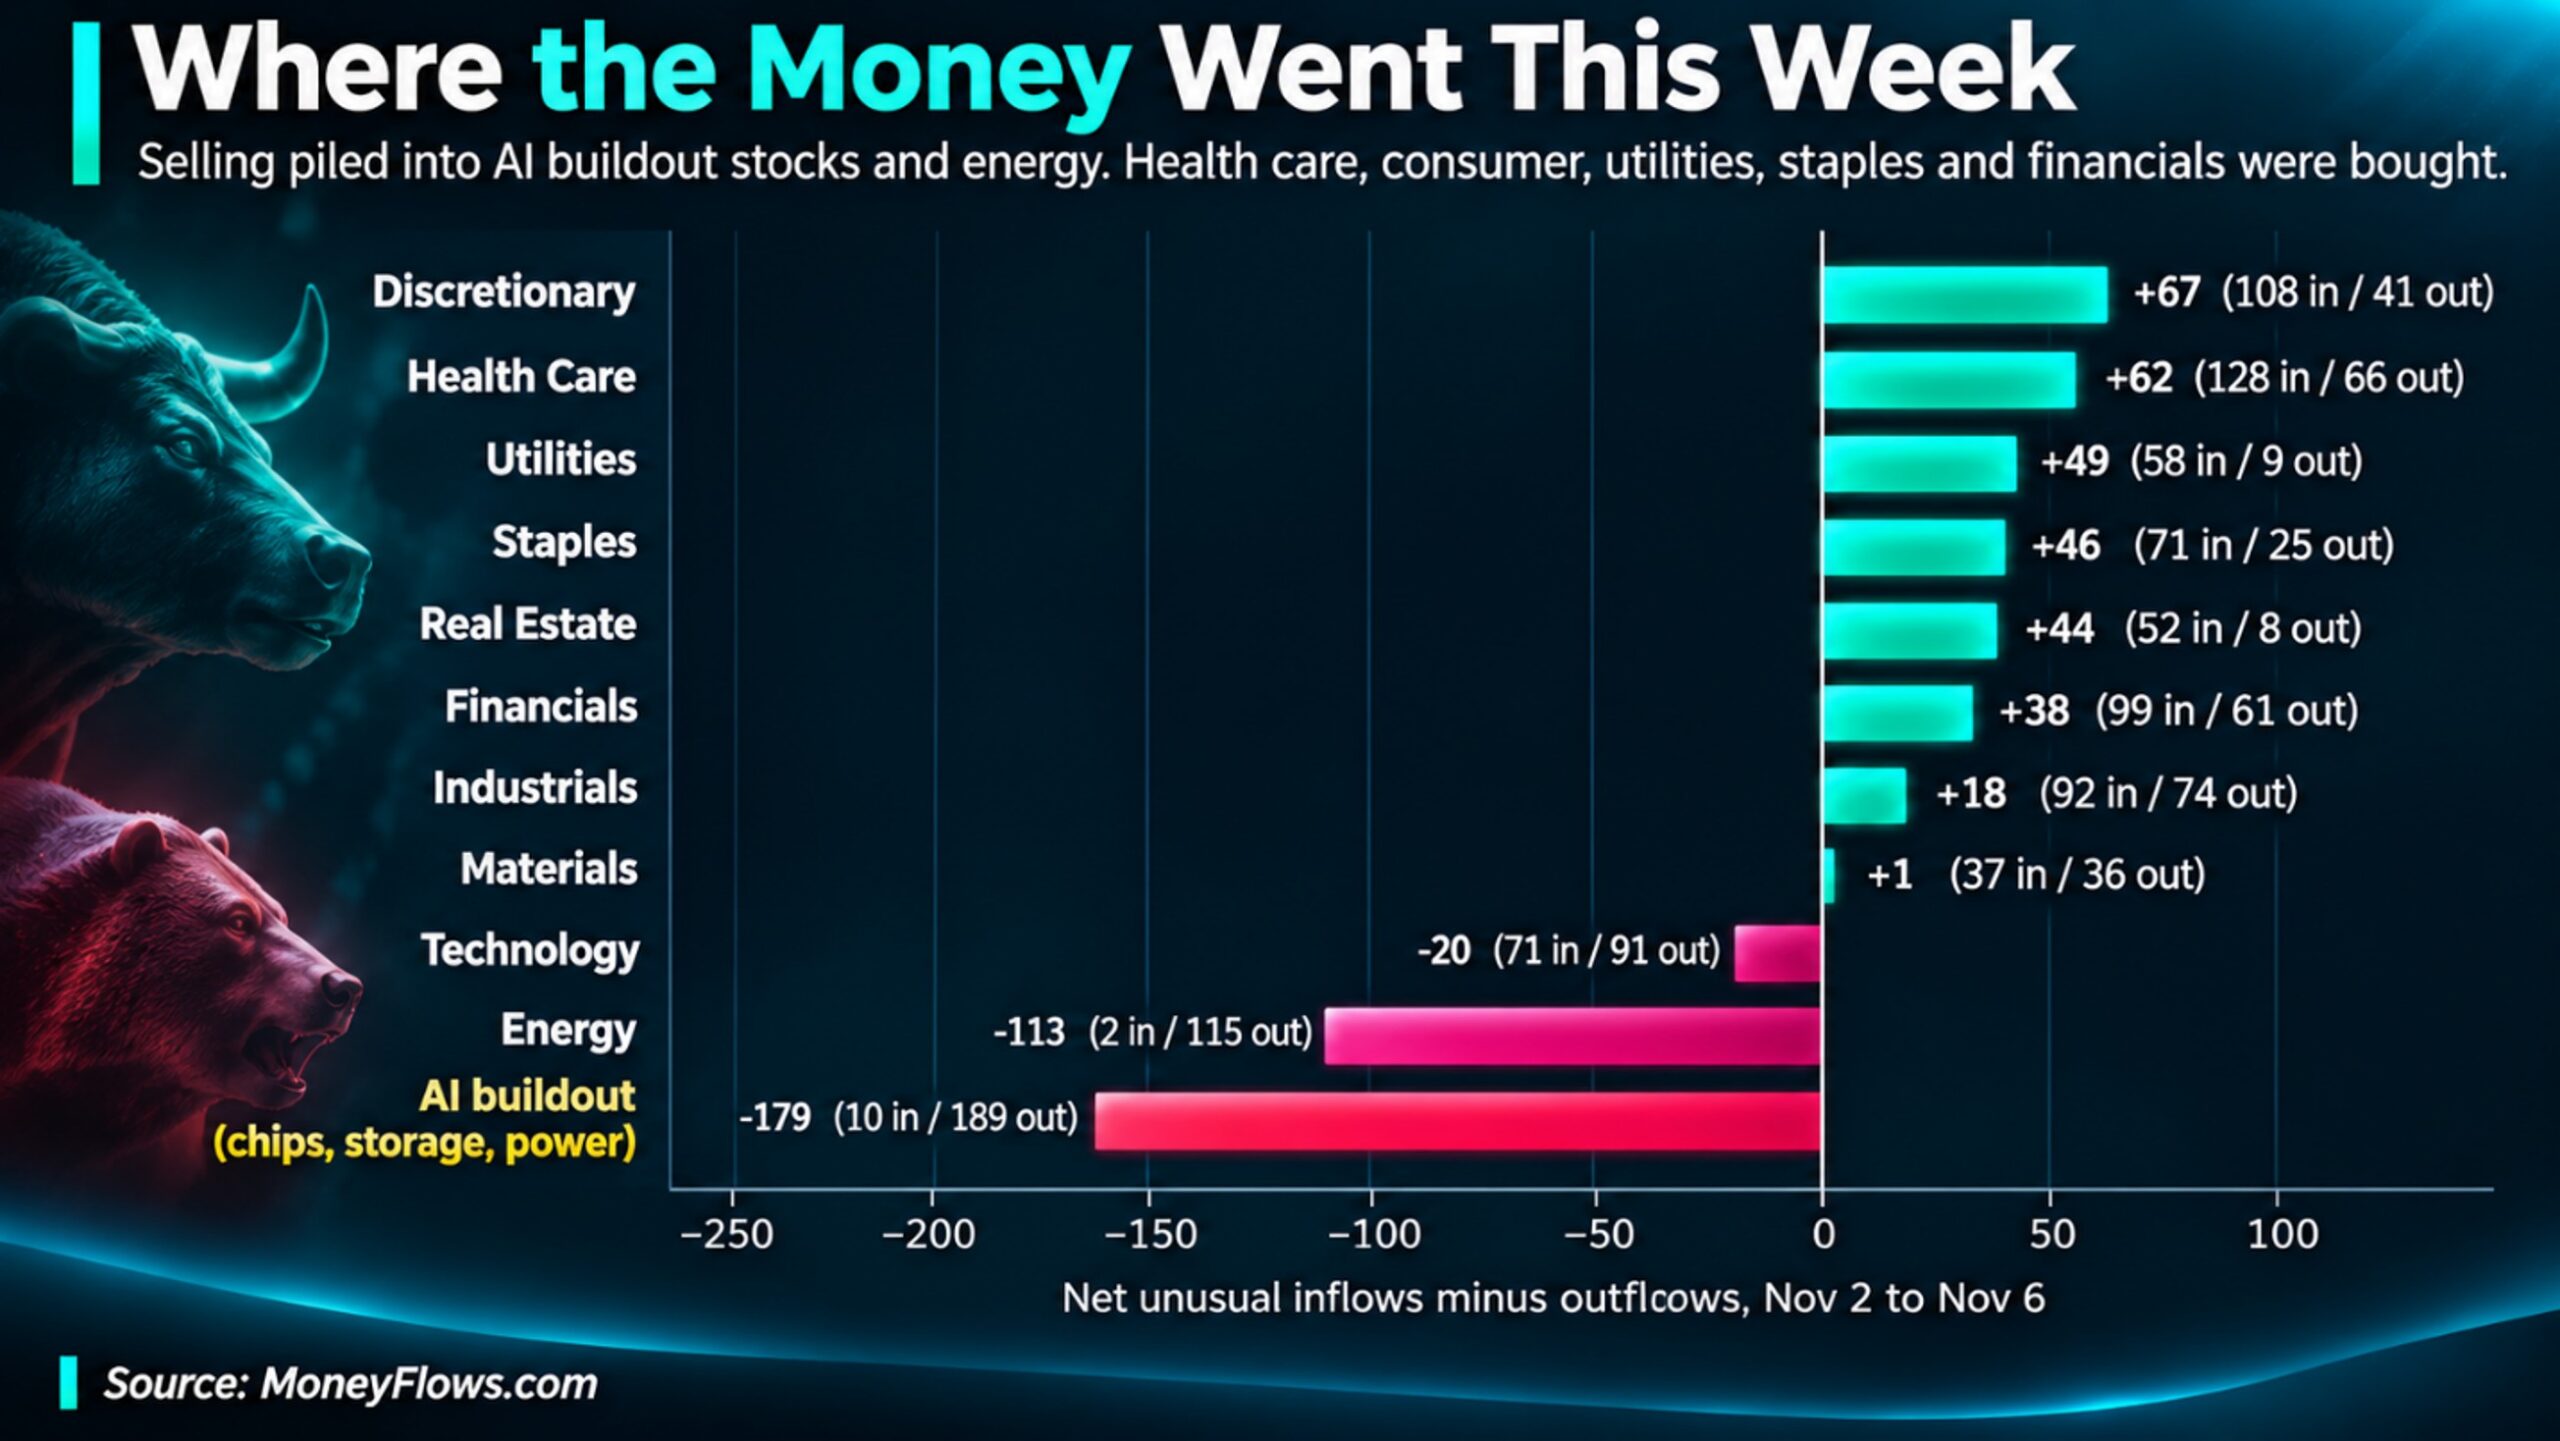
Our data shows the violence. AI buildout stocks, from chips to storage to power, saw 189 outflows against just 10 inflows this week. Meanwhile, health care, consumer, utilities, staples, real estate, and financials were net bought. Money didn’t leave the market. It fled a crowded corner.
What happens next? Near term is unclear. But flows offer a roadmap, and Friday brought encouraging signs.
- 1. Selling dried up. Outflows plunged from 356 Thursday to 83 Friday. Chip stocks went from 51 outflows to one.
- 2. Breadth improved. Stocks near their 55-day lows dropped from 36% to 25% in one day.
- 3. Our Big Money Index (BMI) kept rising, reaching 43%. This 25-day average is shedding October’s heavy selling days. Even with relentless selling, it can’t return to oversold before late November. Historically, when the BMI rose into market plunges, lows arrived quickly, usually within two weeks.
- 4. The final test is a retest. If prices revisit Thursday’s lows on lighter selling, forced sellers may be finished. Another shakeout is possible, but most of the damage appears to be done.
Now let’s zoom out. That’s where things brighten.
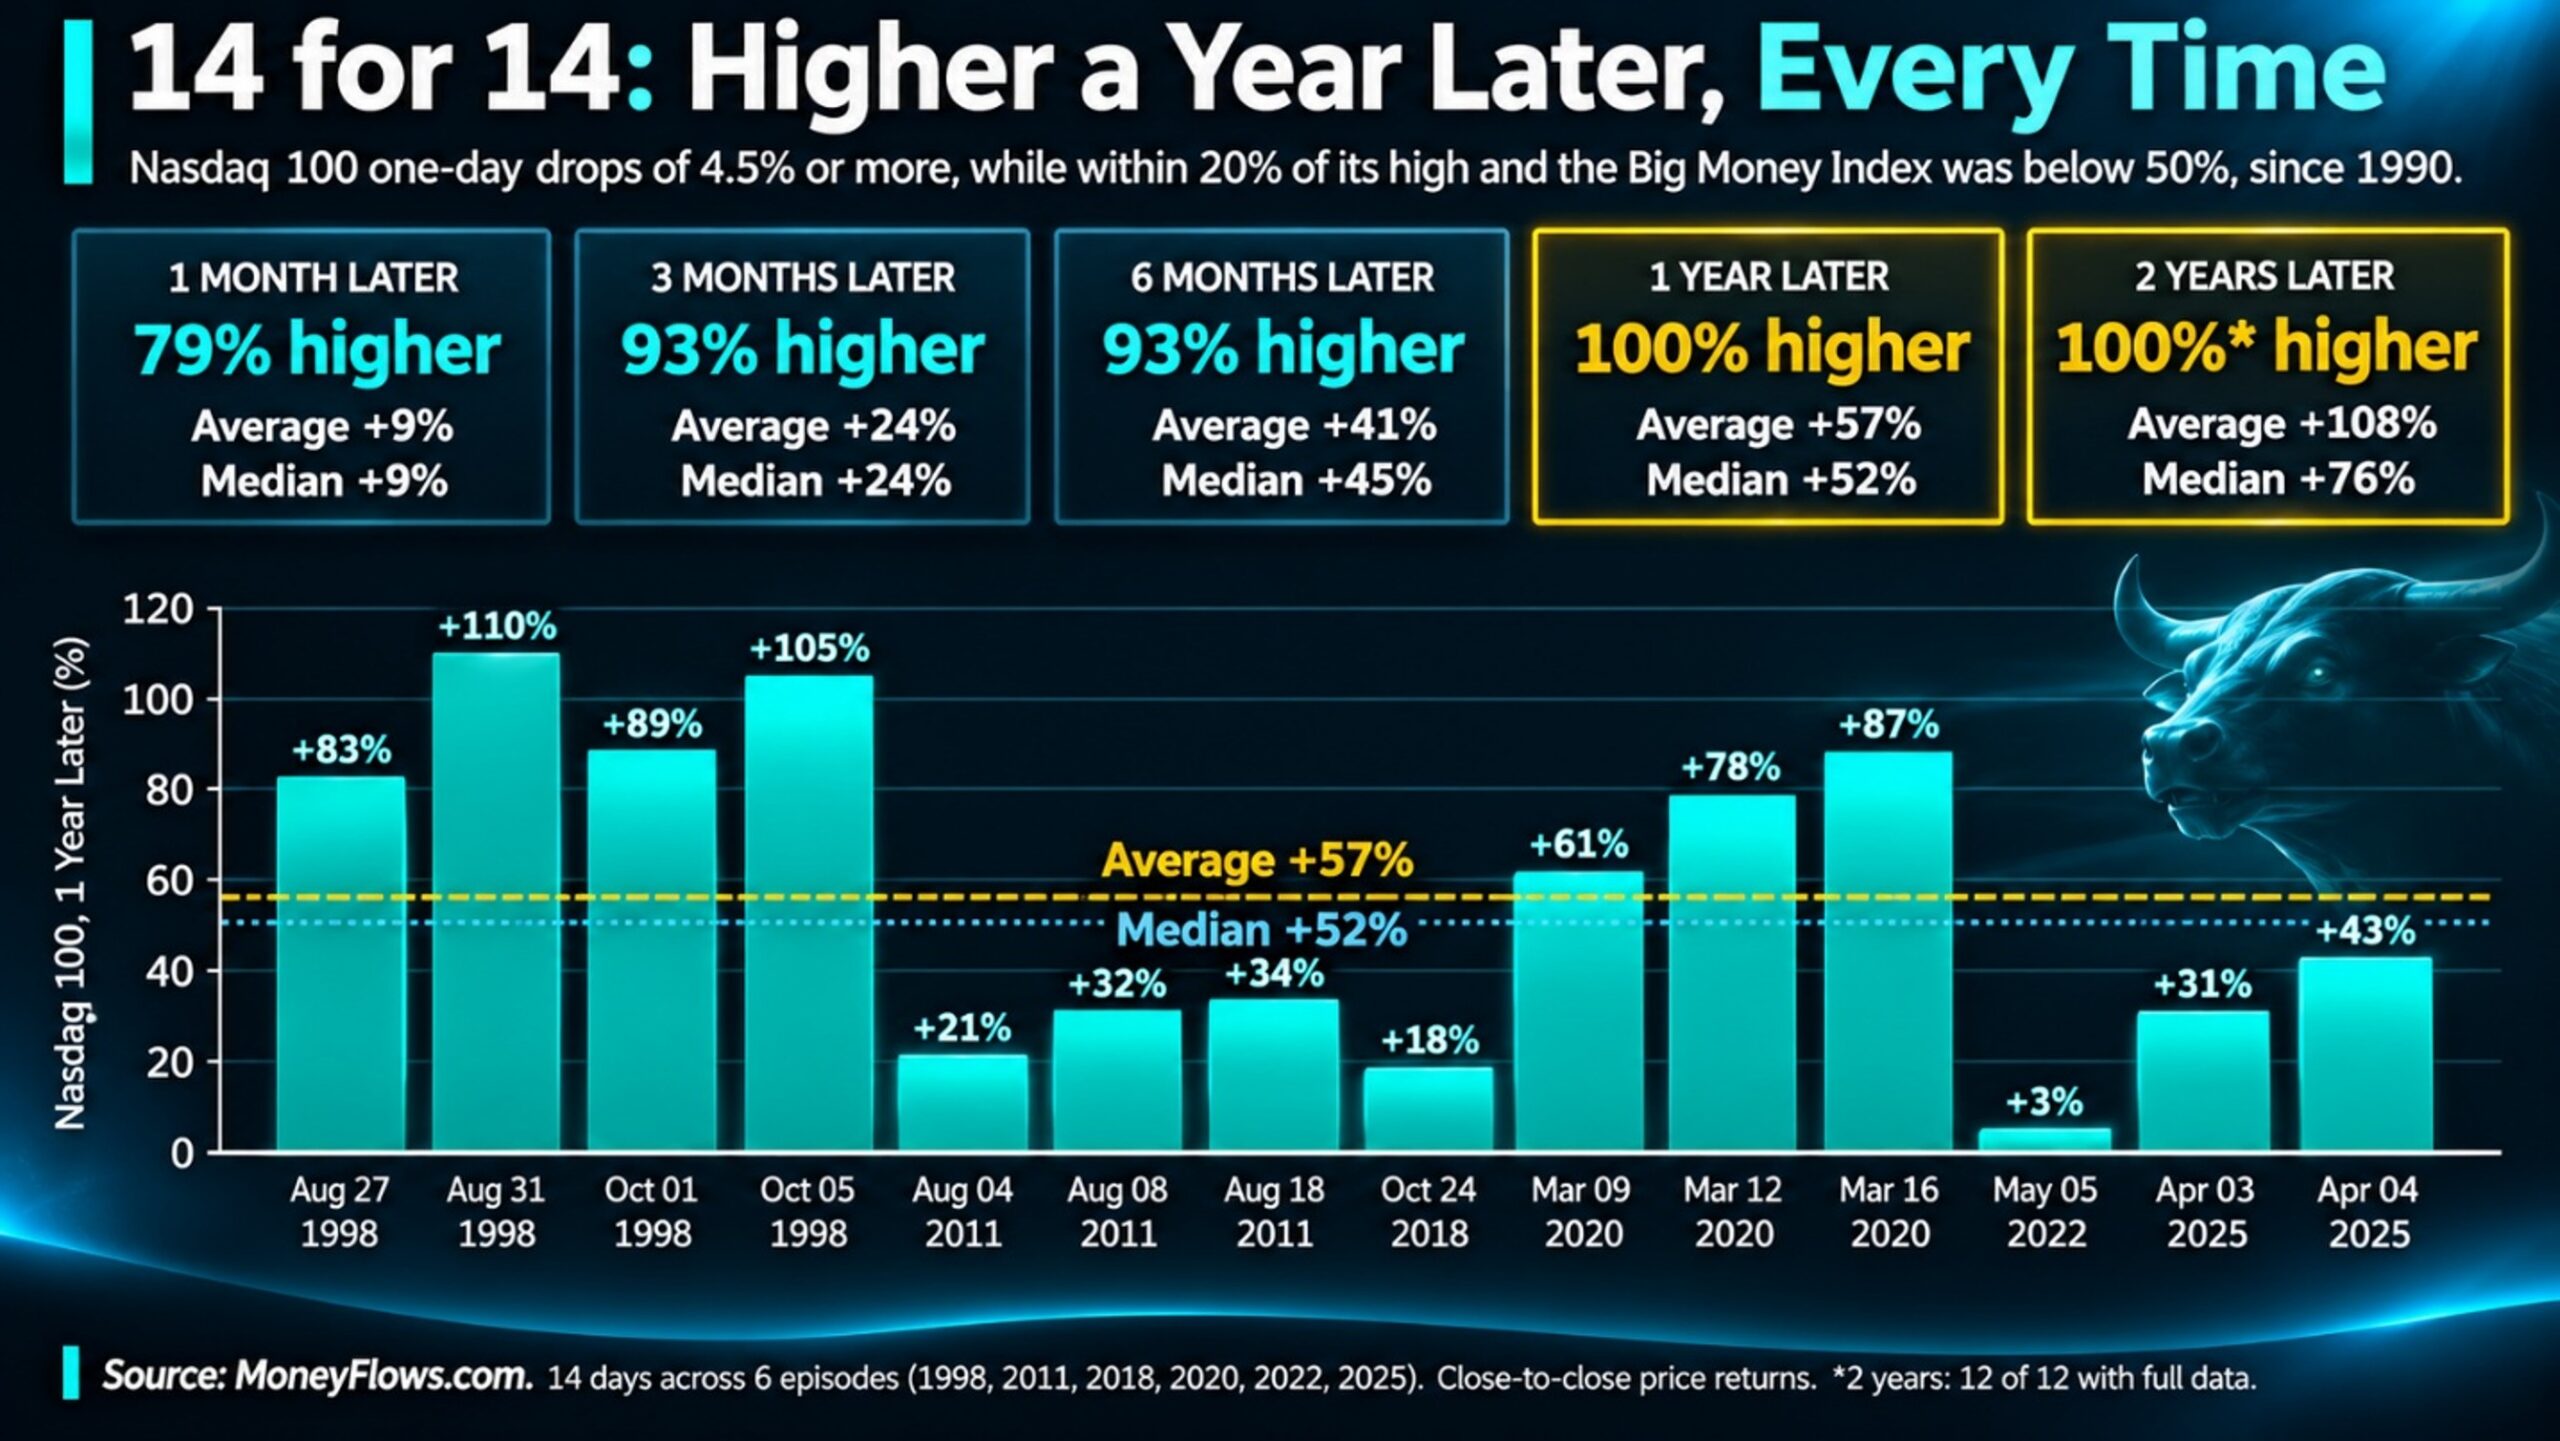
Since 1990, the Nasdaq 100 has plunged 4.5% or more in a day 14 times while within 20% of its high and with our Big Money Index below 50%. One year later, it was higher all 14 times, averaging a remarkable 57% gain.
Thursday became number 15.
Chips are hurting, so let’s look there.
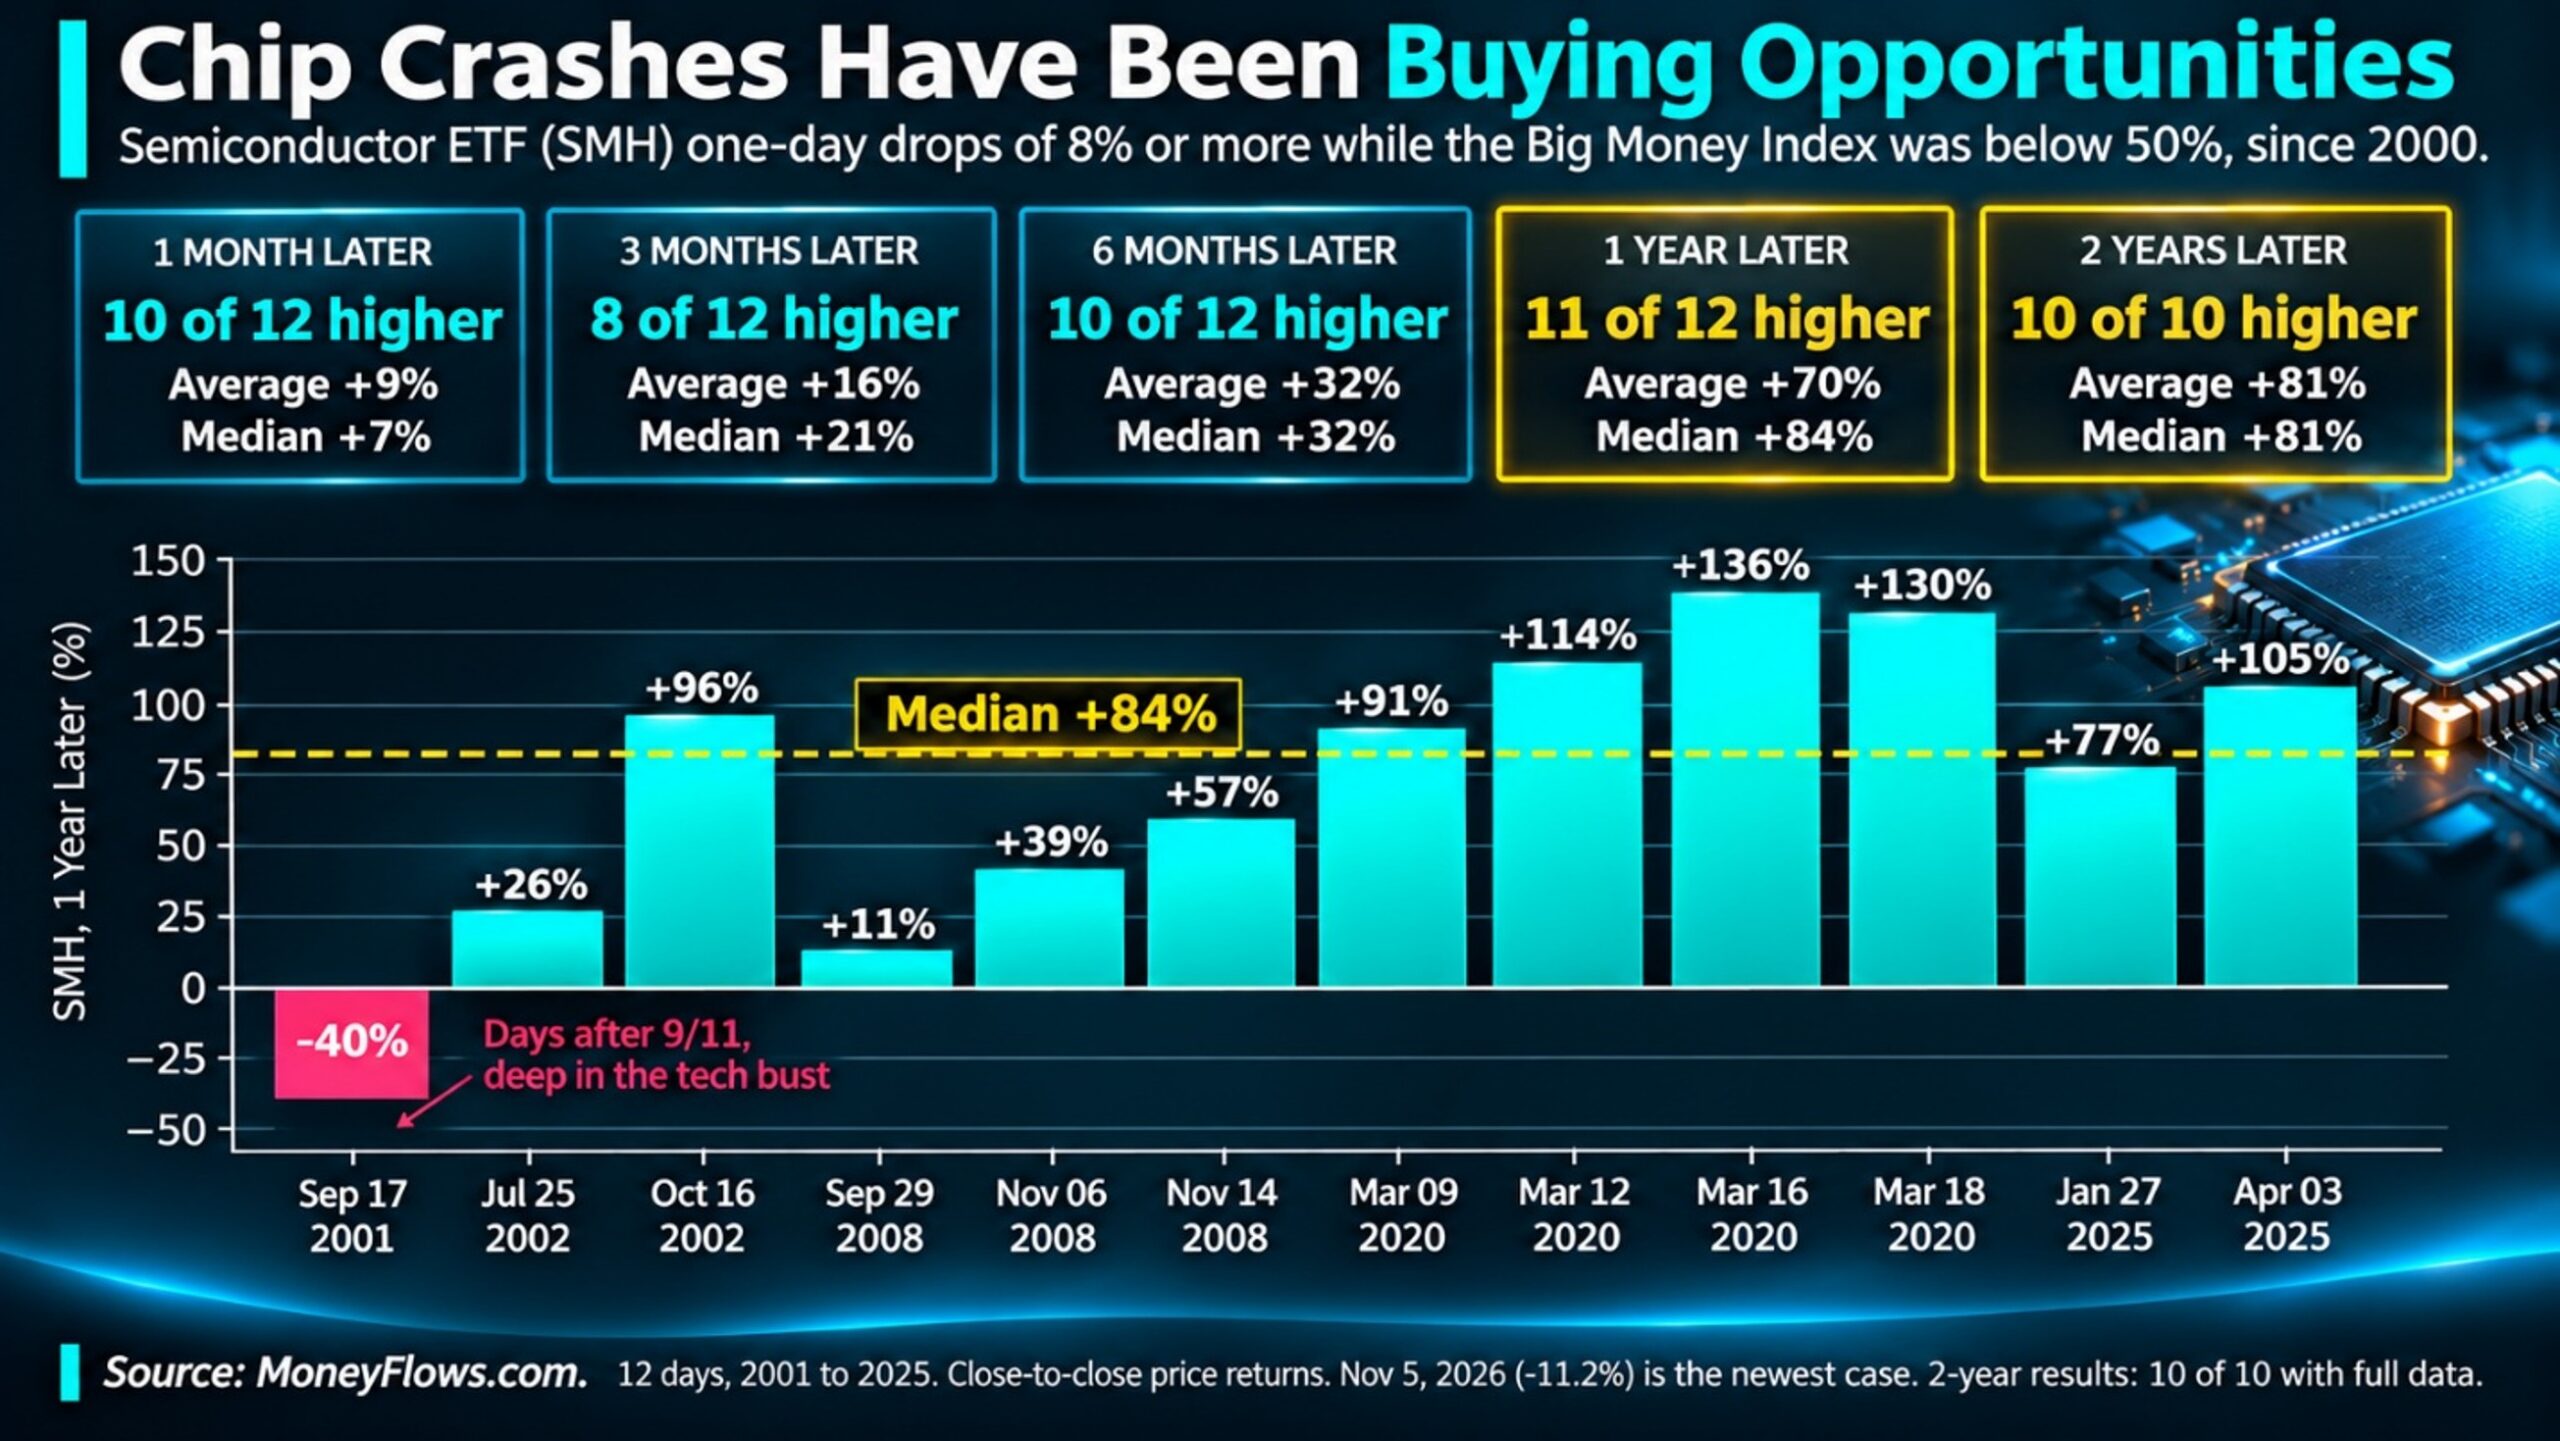
Thursday, the largest semiconductor ETF plunged 11.2%, its second-worst day since 2000. Since then, it fell 8% or more in a day 12 times with our BMI below 50%. A year later, it was higher 11 of 12 times, with an outstanding median gain of 84%. The sole miss came days after 9/11:
Let’s also remember this isn’t a bear market. Those came with falling profits, stretched valuations, or a Federal Reserve slamming the brakes. Today, we have:
- S&P 500 earnings growing 30% and sales 13%, more than double their 10-year averages.
- Stocks trading below their average valuation.
- Employment and productivity gains – October added 165,000 jobs, and productivity rose 3.6%.
- Rising earnings estimates for 76% of AI chip stocks.
- Bank of America saying $140 billion flowed into cash funds in one week.
That last point is fuel for later.
So, what about the AI threat? In the worst case, say lawmakers halt every new data center. Projects already underway still need chips, memory, storage, and optics. Samsung says its 2027 high-bandwidth memory is already sold out.
Let’s imagine AI adoption stops tomorrow (i.e., no new frontier models). It’s ridiculous, but consider it nonetheless. AI agents change the math. Instead of answering one question, agents execute dozens of steps. Gartner estimates agentic tasks require up to 30 times more computing than a chatbot exchange. If existing users add just one or two agents, compute demand compounds without any new users. That strains already stretched capacity.
Politics won’t stop it either. According to an interview summarized by Elon Musk, Texas’s governor-elect says permitted data centers can finish. New projects face rules on taxes, electricity, water, and labor. Companies can navigate those. States that push data centers away simply hand jobs and tax revenue to their neighbors.
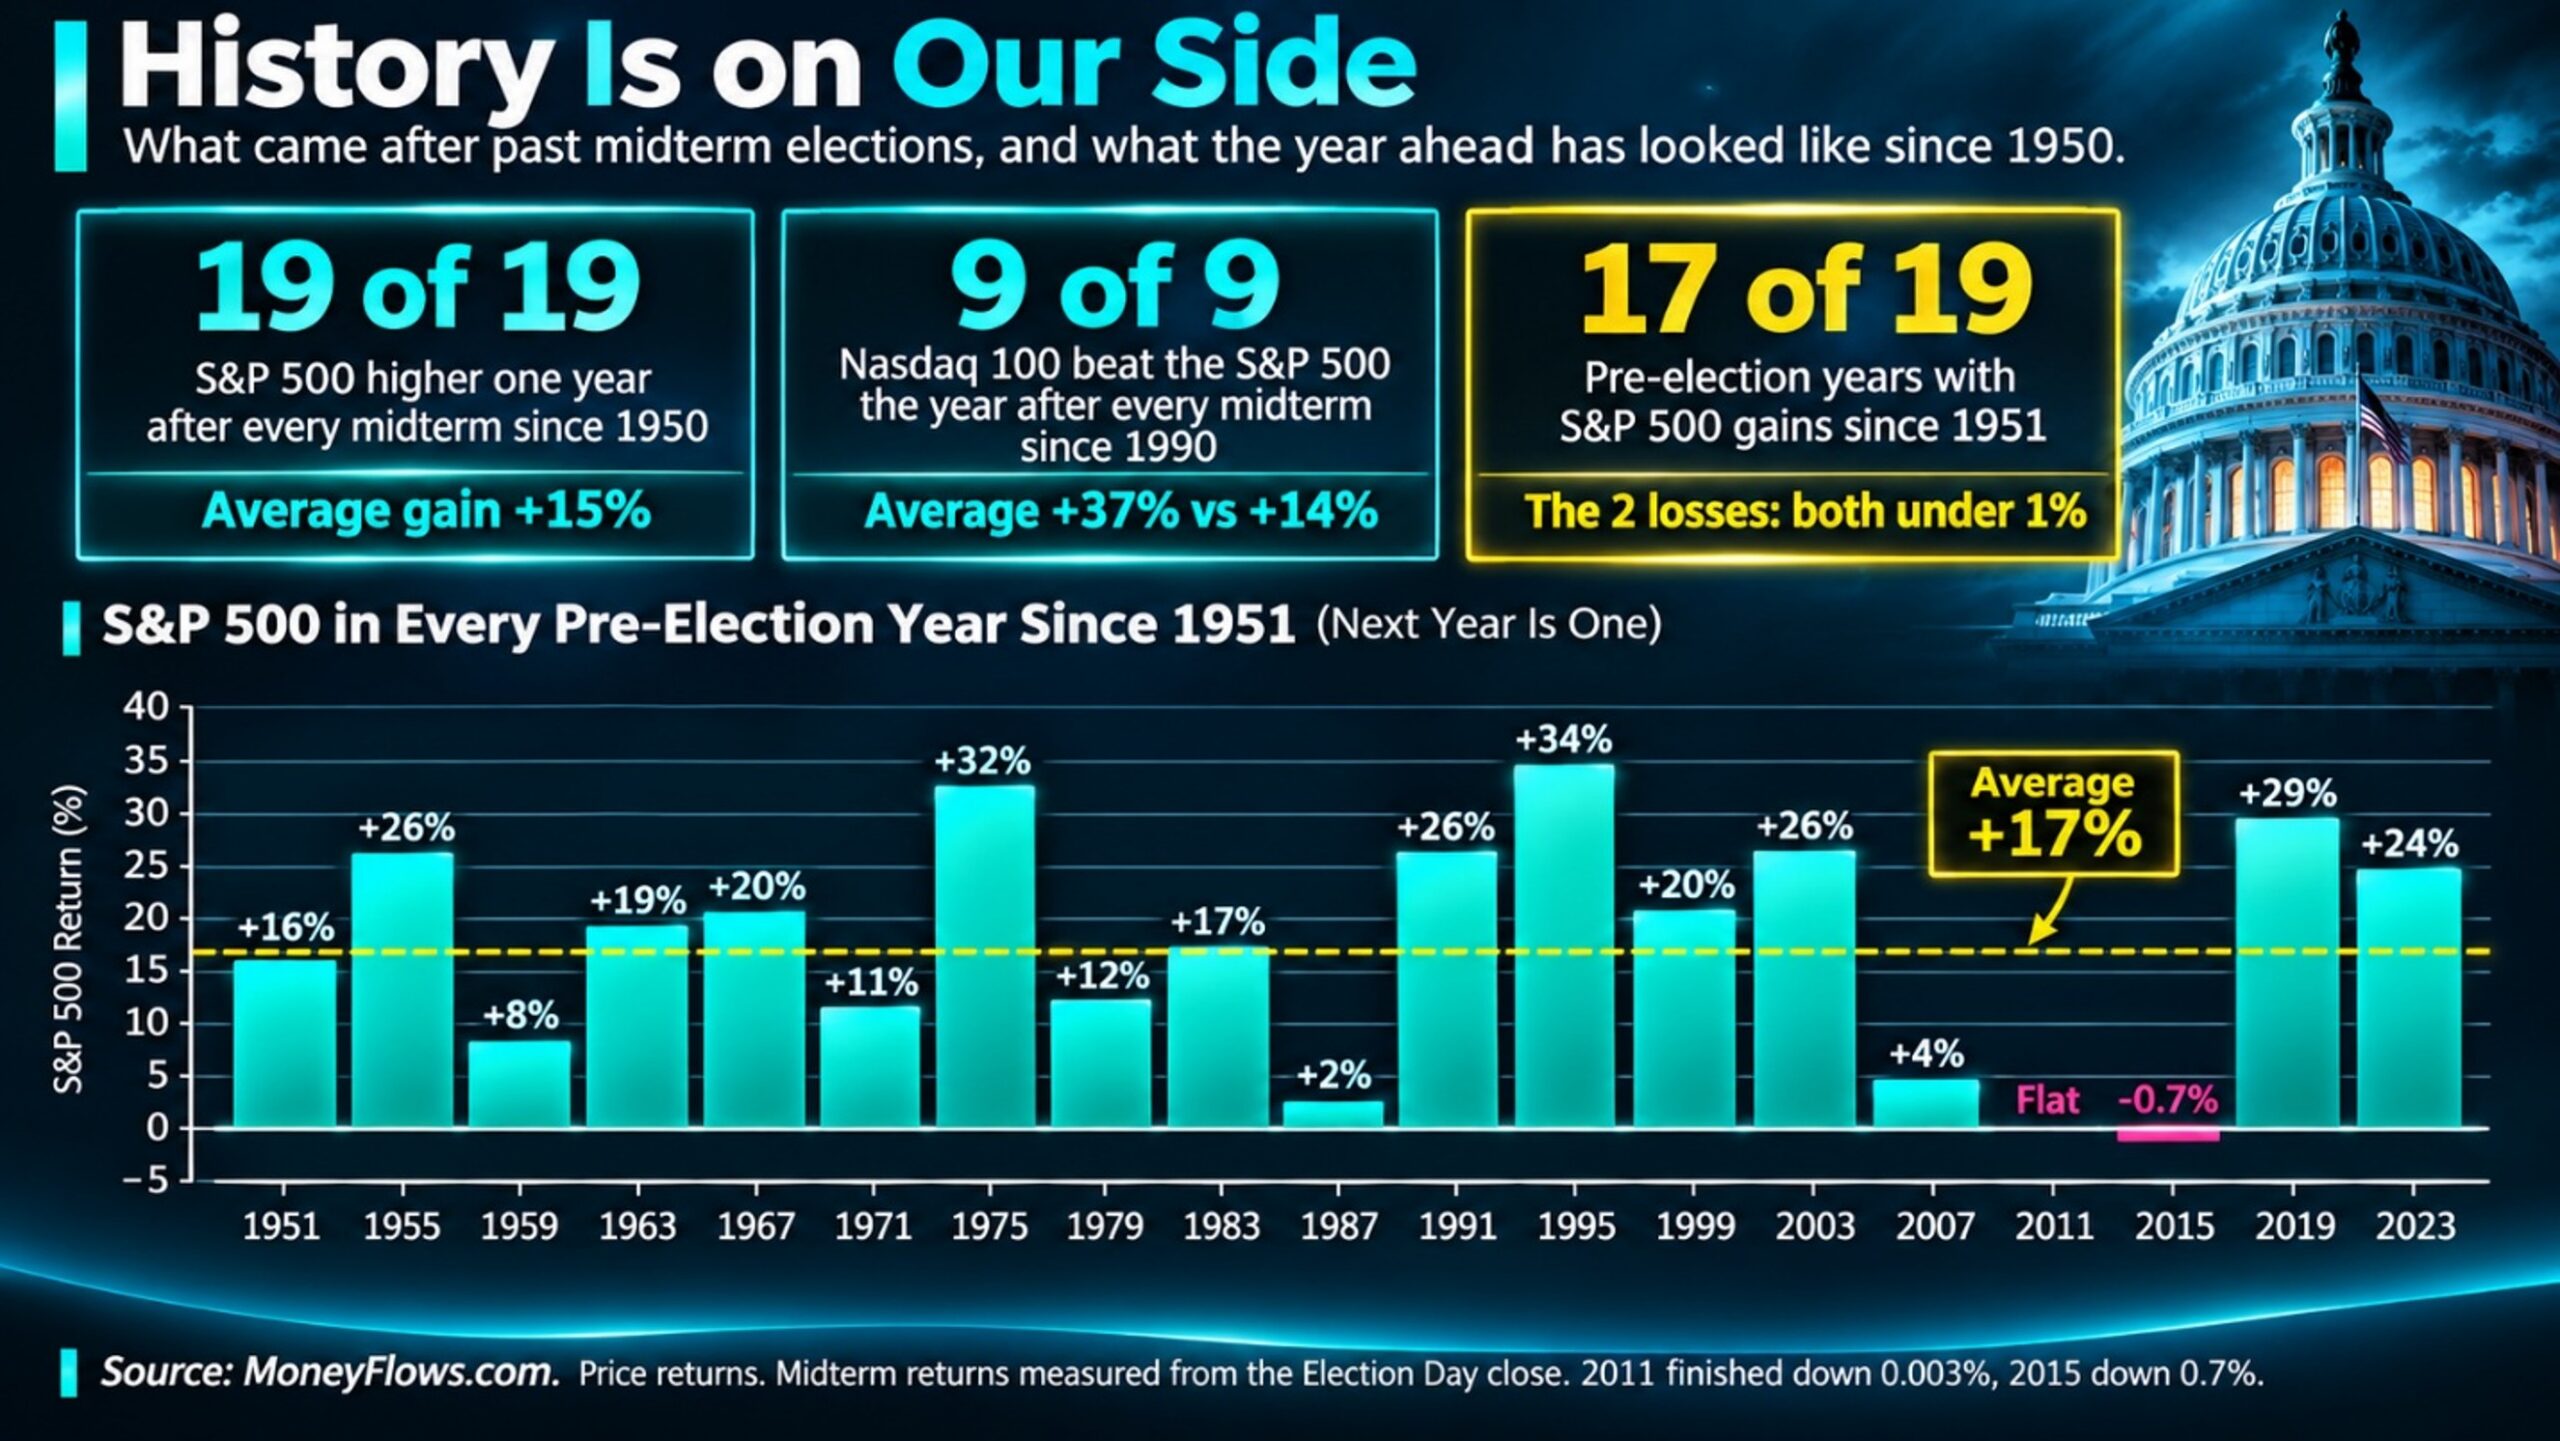
History is on our side. Since 1950, the S&P 500 has risen a year after all 19 midterm elections.
Tech has done better. Since 1990, the Nasdaq 100 has beaten the S&P 500 in the year following every midterm.
And next year is the pre-election year, which is historically the strongest of the four-year cycle. Since 1950, the S&P 500 has declined in just two, though both by less than 1%.
Our flows tell the same story.
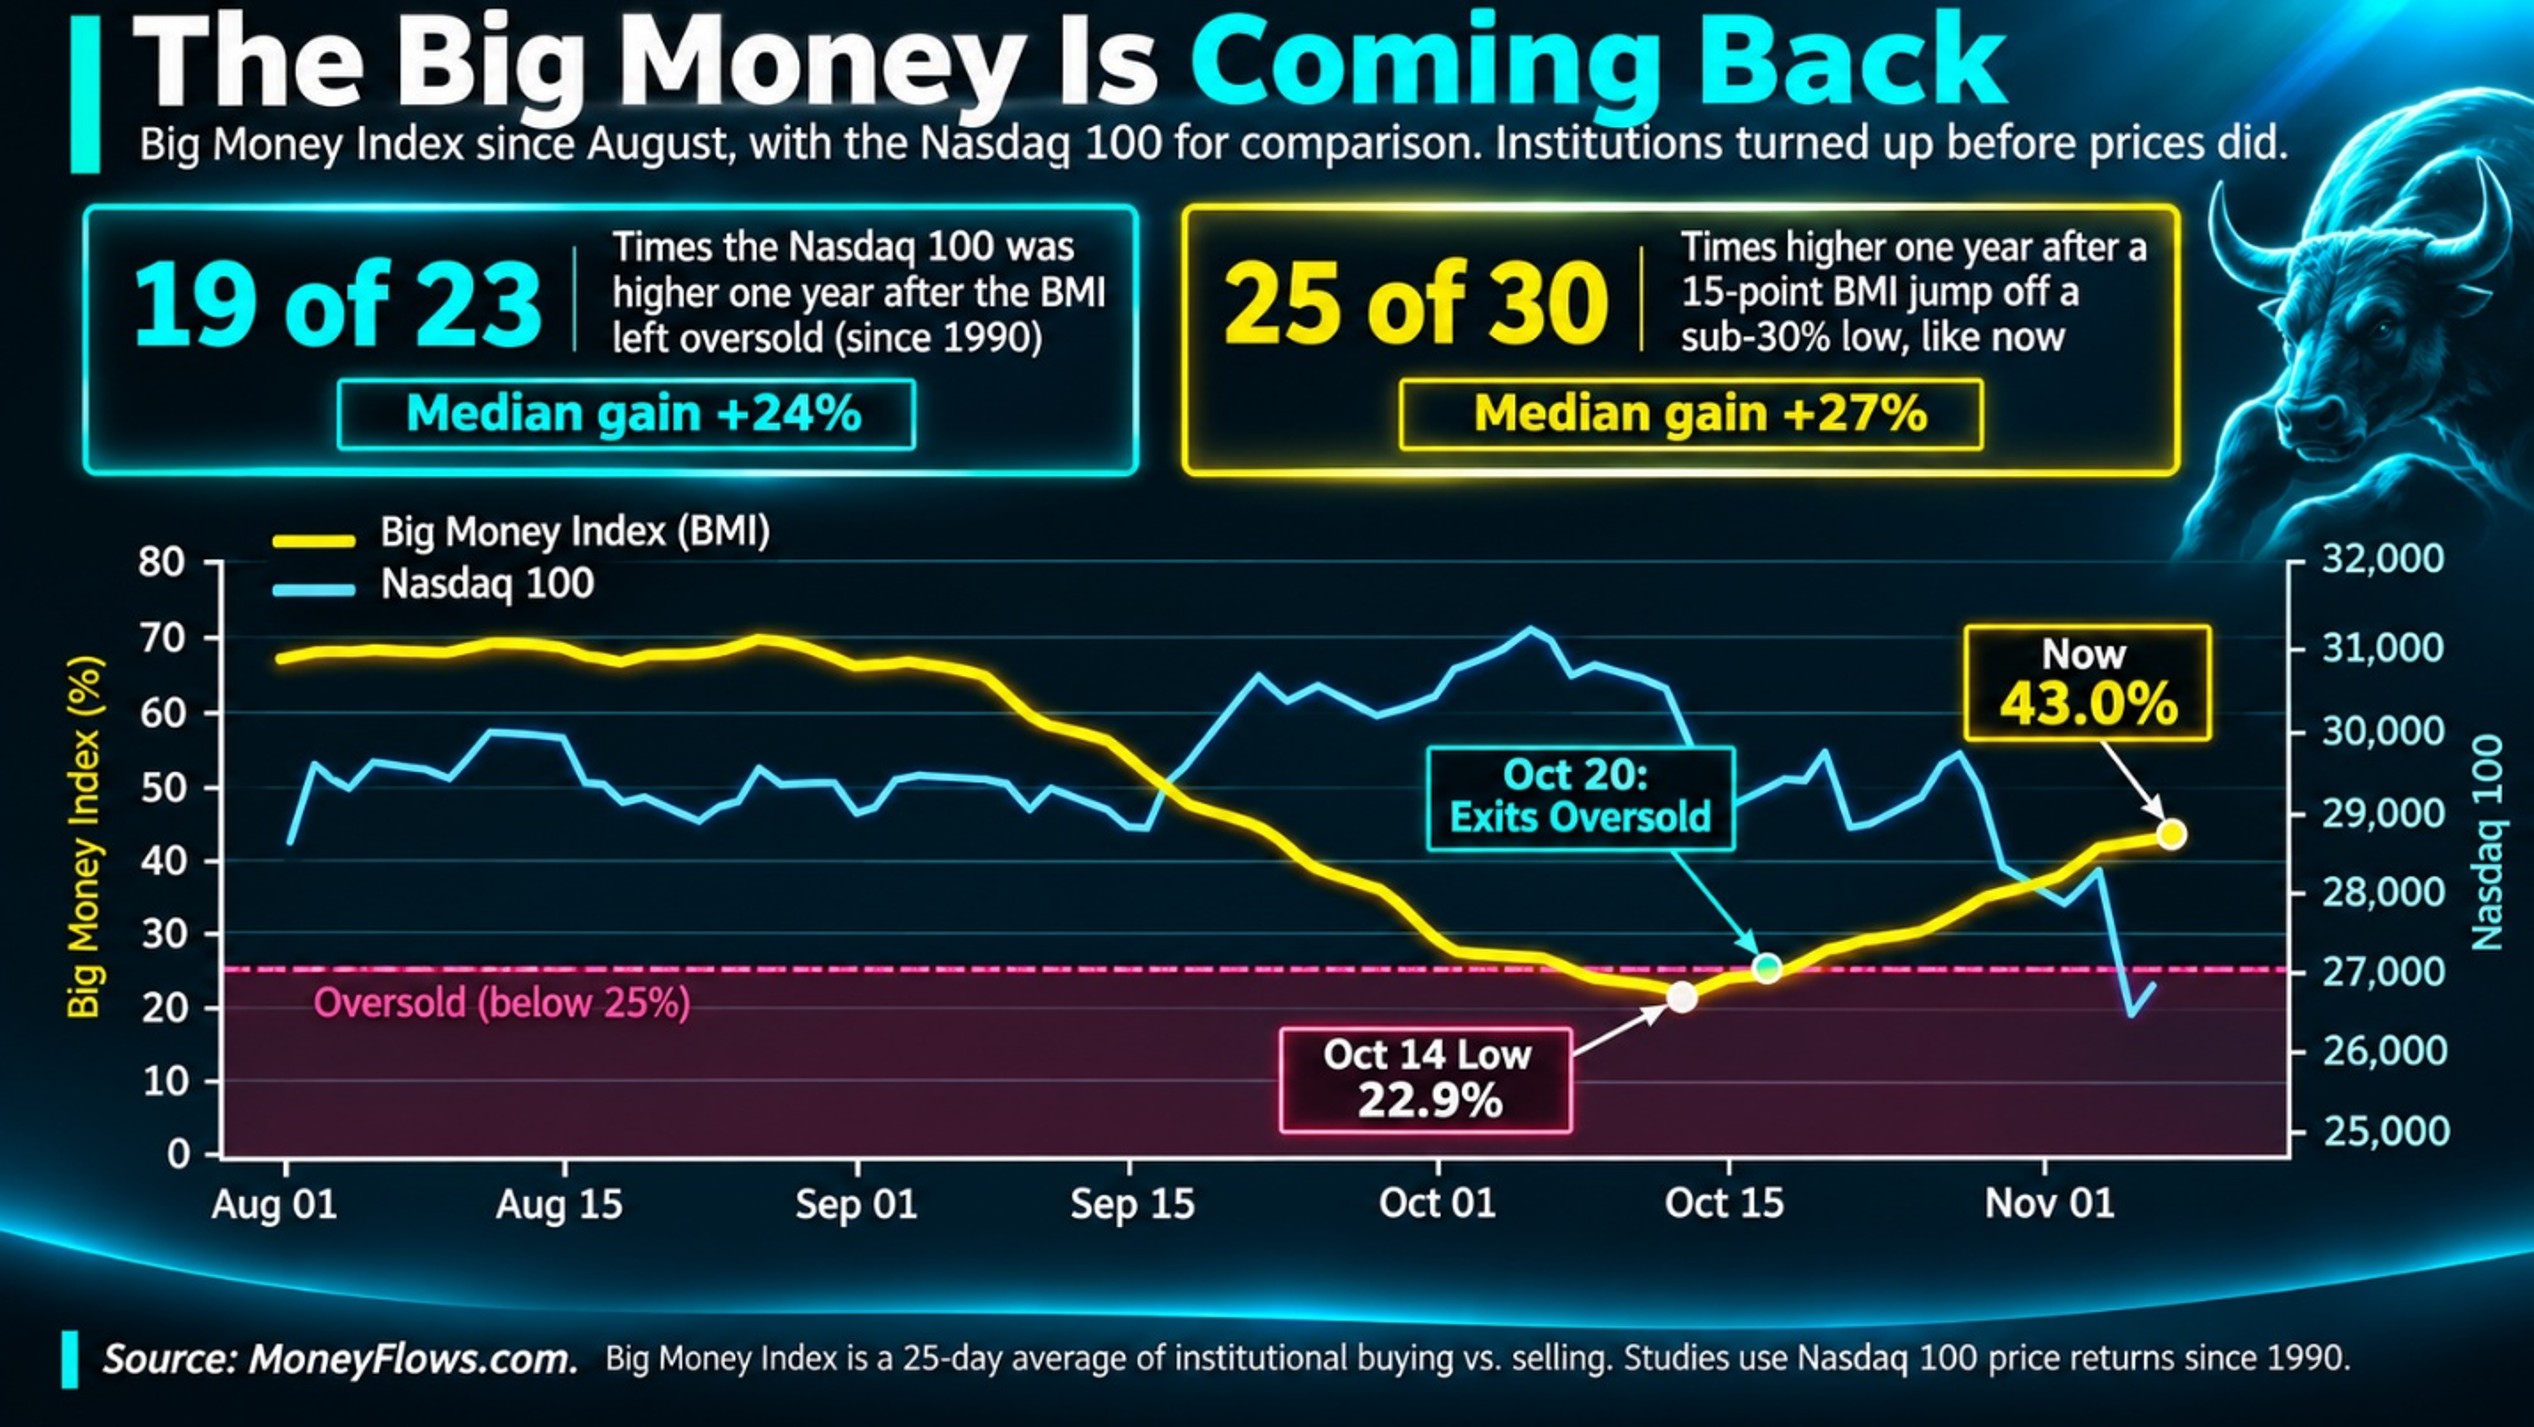
In mid-October, our BMI sank to 22.9%, which is deep in oversold territory, where institutional selling is heaviest. On Oct. 20, it climbed out. That’s happened 23 other times since 1990. A year later, the Nasdaq 100 was higher 19 of those 23 times (82.6%).
This rebound is fast. The BMI surged 15 points in three weeks from below 30%. Historically, the Nasdaq 100 was higher a year later over 80% of the time, with a median gain of 28%.
Margin debt is another worry. It hit a record $1.5 trillion in June, and that leverage needs unwinding. But we saw a test run. In July, margin debt plunged a record $85 billion. The S&P 500 shrugged it off, hitting a new high in October. Flushing leverage isn’t the end of a bull market. It’s maintenance.
The near-term may be choppy. Flows will say when the coast is clear. But forced sellers are running out of ammo, earnings are growing twice as fast as usual, and AI demand keeps compounding.
History favors patient investors.
As writer William Arthur Ward put it, “The pessimist complains about the wind; the optimist expects it to change; the realist adjusts the sails.”
MoneyFlows finds the winners early…bringing them to you.
If you’re a serious investor or money manager, get started NOW.
Our PRO subscription allows you to spot daily flows and access our weekly Outlier 20 report.
This is the report that has found EVERY SINGLE ONE of our Outlier stocks.
Enjoy a click-through experience unlike anything out there.
Professional money managers and RIAs looking for additional portfolio solutions including ETF flows & ranks and your own Portfolio Tracking tools, please reach out about our Advisor Solution and Emerging Advisor Program.
Have a great week!
***Lastly, join me LIVE, Nov. 30 – Dec. 2, at the MoneyShow Masters Symposium Sarasota, FL. I’ll be presenting: Why the Midterm Election Historically Brings Epic Rallies – And What to Buy Now.
You don’t want to miss this! Click the image below to reserve your spot.