

DEATH CROSS
by Lucas Downey All, Big Money Insights Weekly, StocksIt’s been a challenging few weeks.
Stocks are falling. Investors are scared.
Then we find out that the S&P 500 formed a death cross.
Tariffs are causing extreme uncertainty. Arguably the most important company in the world, NVIDIA (NVDA), is the latest headline casualty.
The company announced a multibillion-dollar charge related to chips sold to China.
Finding a positive narrative has been difficult to say the least. But we’re going to do just that.
What I’ve found helpful throughout my career is this:
- First, trust the data. It often signals a changing tide well before the applause of the crowd.
- Second, run historical analysis on scary headlines before drawing a conclusion.
With this in mind, we’re going to first look through our data, searching for clues on the true investor appetite for stocks.
Then, we’re going to unpack what a dreaded death cross means for stocks.
There’s a decent shot you’ll be surprised at the findings.
Big Money Index Turns Higher
With all the red in markets, it may come as a surprise that the Big Money Index (BMI) is at 5-week highs.
The reason for this is simple. Forced selling has slowed dramatically.
Note how the BMI is at direct odds with the price of the S&P 500 (SPY ETF):
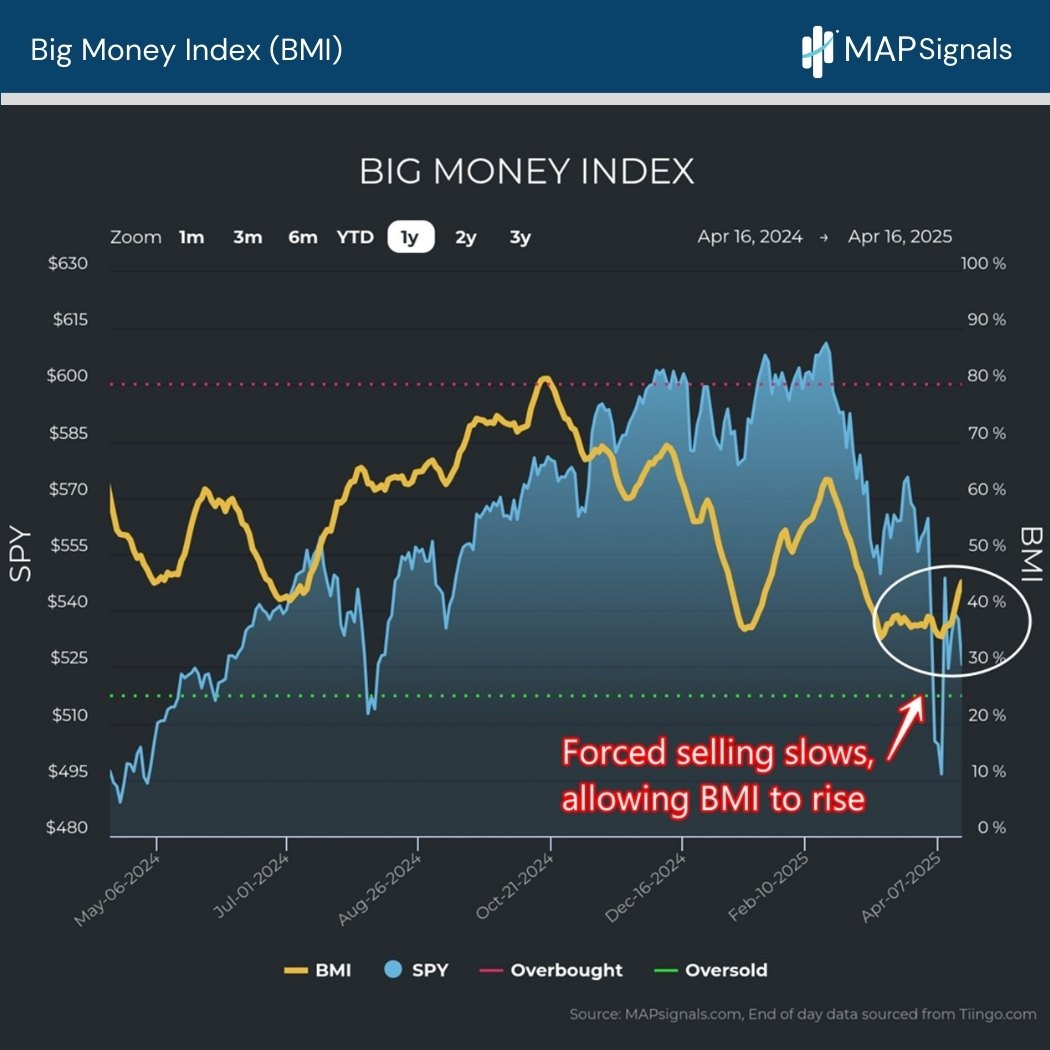
How on Earth is this conflicting picture possible?
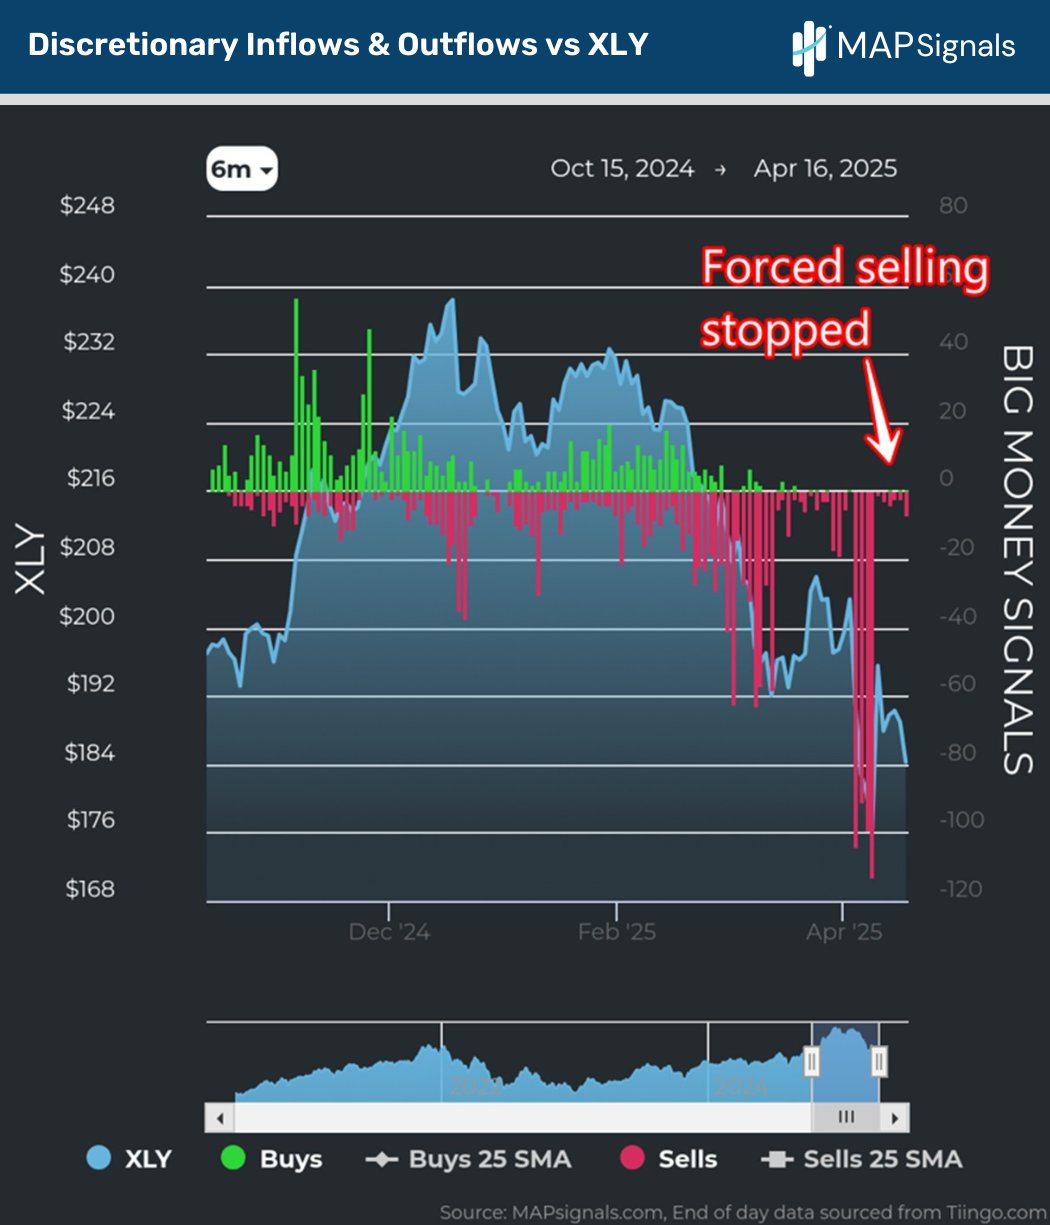
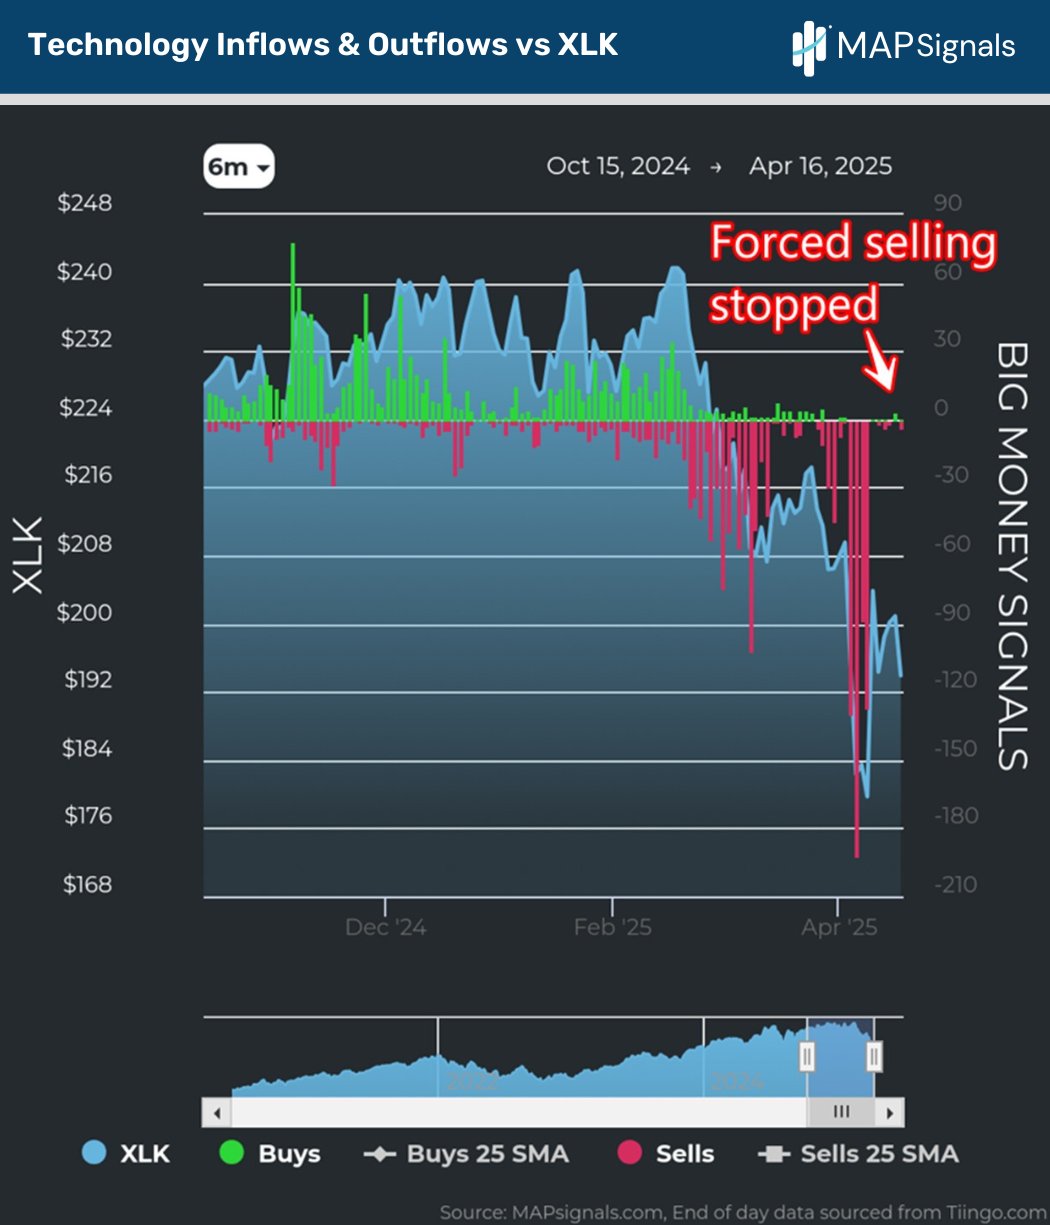
It boils down to the action in the 2 most toxic areas of the market: Discretionary & Technology. These sectors have had hardly any large outflows in the last week.
To show you what I mean, have a look at the daily flows in our discretionary universe.
Forced selling has vanished:
The same pattern is seen in Technology stocks too.
Are we in the clear? Not exactly.
What this data signals is a market that’s trying to find a bottom. Massive sell orders must get absorbed by buy orders before an uptrend can emerge.
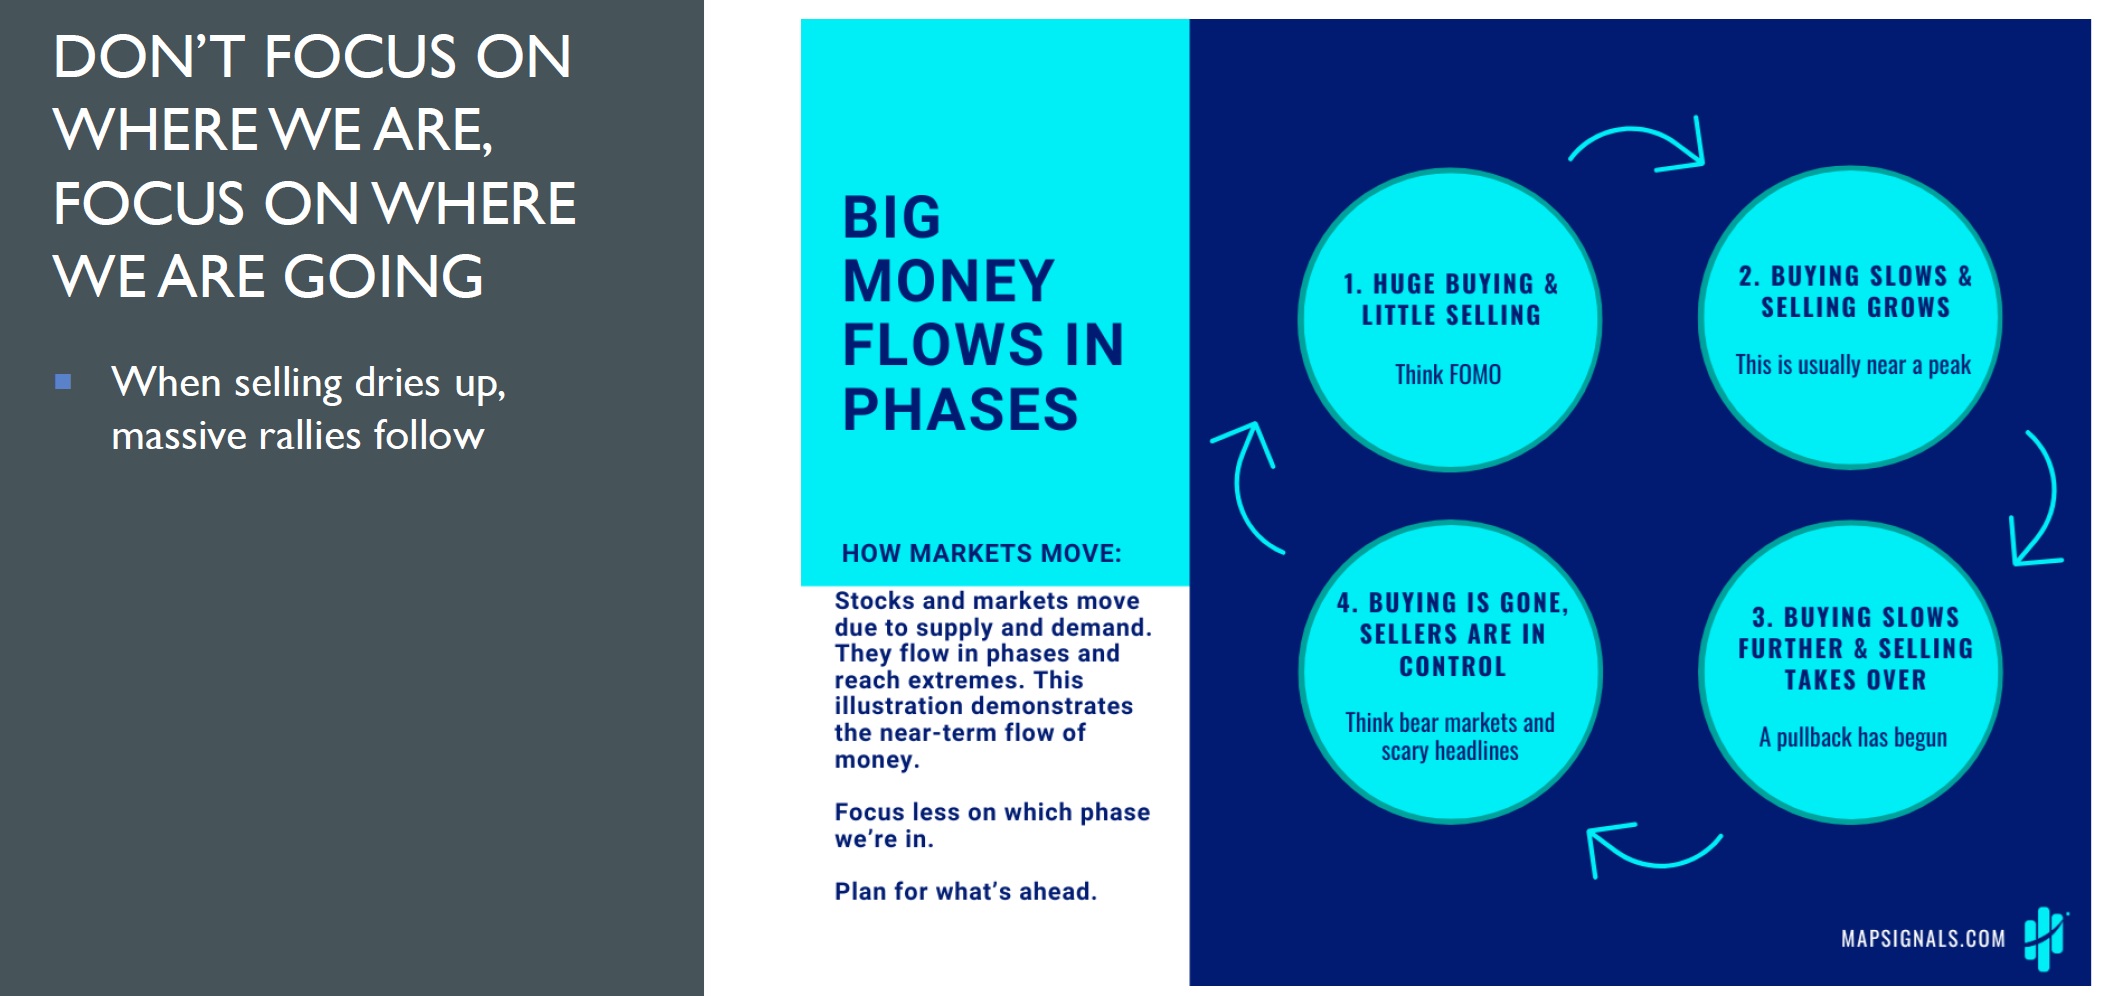
To reuse an image from last week’s 15 chart pack, money flows in phases. We’ve been in phase 4 for weeks now as sellers are in control.
The next phase occurs when buyers outstrip sellers causing a spike in equity levels. Phase 1 is defined as huge buying and very little selling.
We have yet to see large-scale buying in our data.
While the latest data footprints lean more positive than negative, only when real money is put to work will we begin to sustain a rally.
What’s the bottom line? Wait for buyers to step in. Odds are they’ll show up when the crowd least expects it.
Should you be buying high-quality stocks on big down days? Absolutely!
Should you buy stocks into a death cross?
Let’s find out.
S&P 500 Enters Death Cross Formation
If you want to ignite engagement, utter the following words: Death Cross.
Social media has been ablaze with the recent signal.
A death cross occurs when the 50dma falls below the 200dma, indicating that the near-term trend has fallen below the longer-term trend.
Below details how this is the first time we’ve triggered a death cross (weekly data) since 2022:
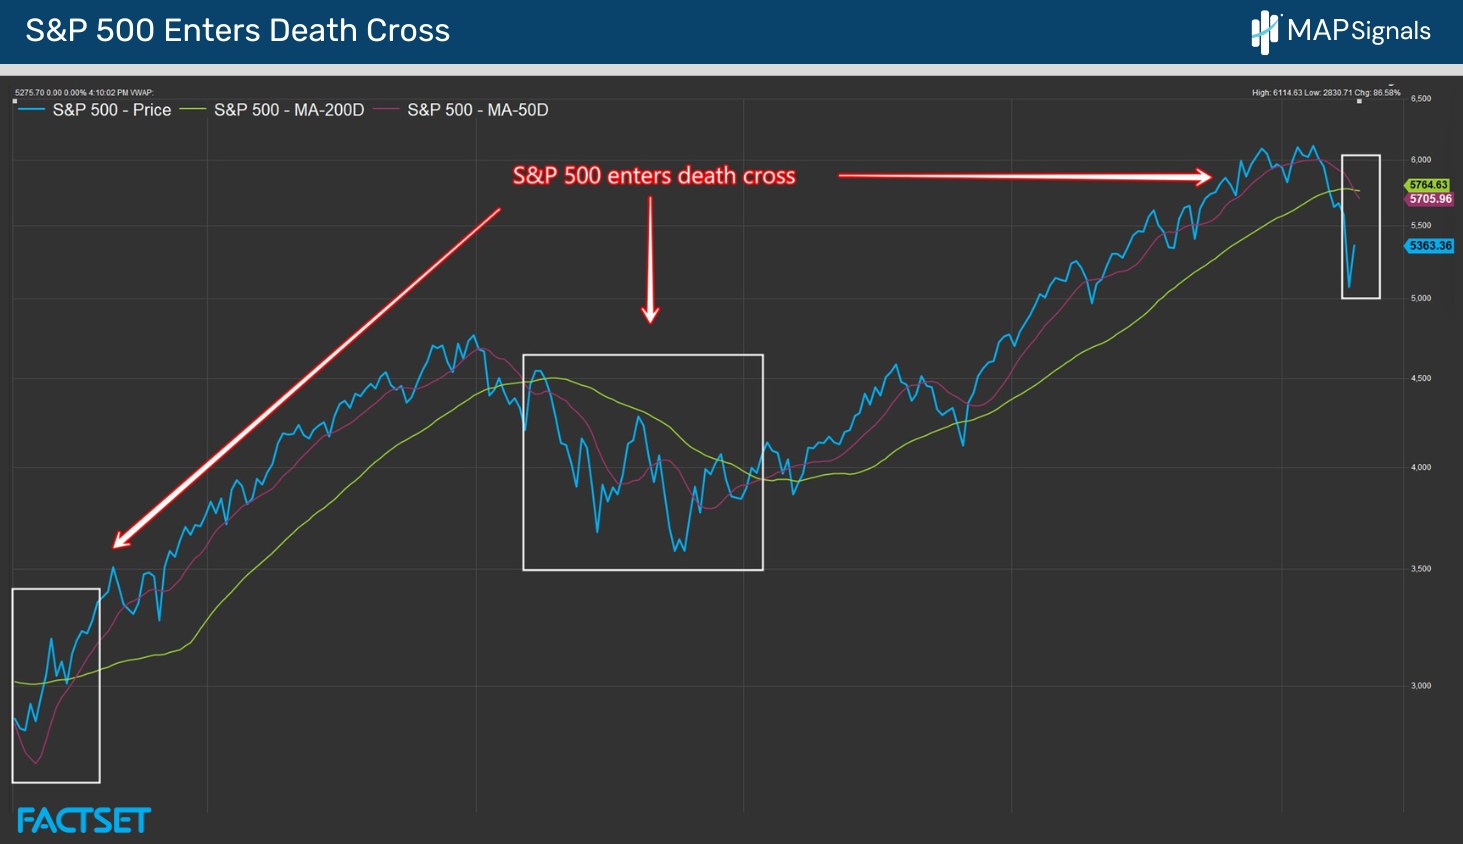
The million-dollar question is this. Is it time to run for the hills?
Before you bite the headline bait, let’s check in history.
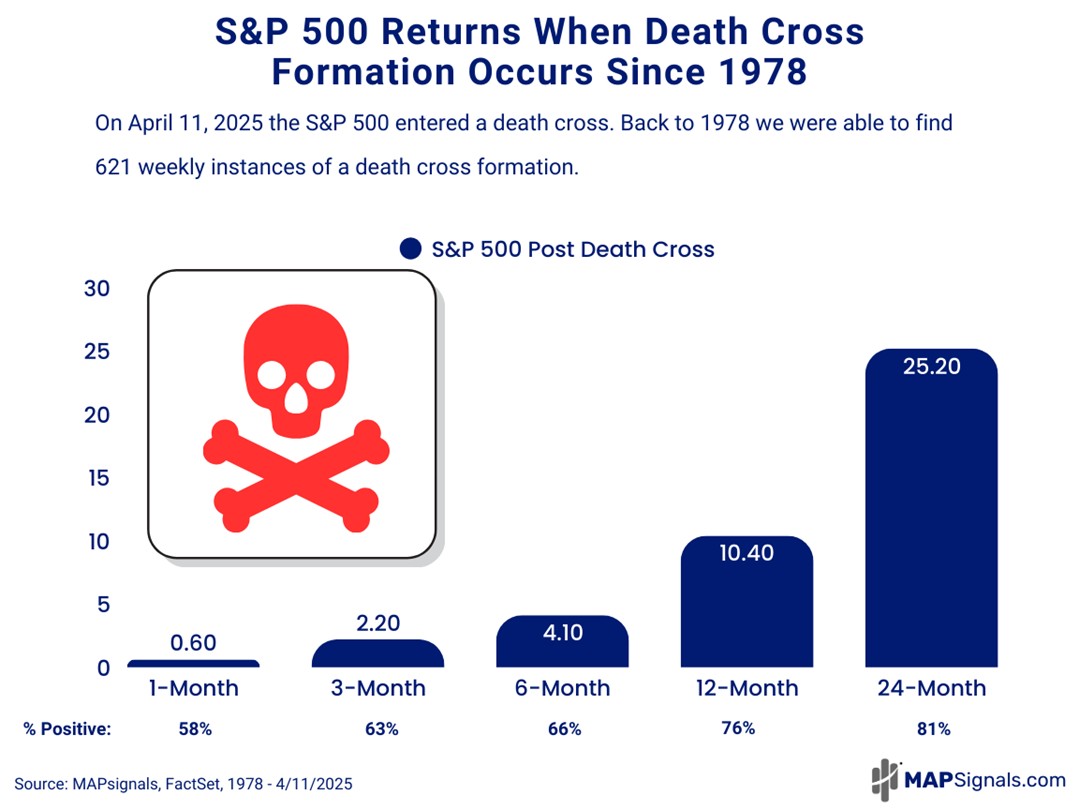
Back to 1978 I was able to locate 621 death crosses using weekly data. It turns out that this signal occurs more often than most realize.
To state the obvious, when the market pulls back for a protracted period of time we see the moving averages invert.
Do we want to buy low or sell low? Let’s review the evidence.
Whenever the S&P 500 50DMA is below the 200DMA, here’s what happens next:
- 3-months later stocks are up 2.2%
- 6-months later modest gains of 4.1% are seen
- 12-months later, the market is up 10.4%
- 24-months later, the S&P 500 jumps 25.2%
If you aren’t a PRO member, and are a serious investor, get started today to access the below report. It’s a beauty!
If you ask me, a death cross isn’t as deadly as it sounds.
However, it does appear that stocks can wobble near-term.
That means, focus on institutional favorites…high-scoring companies.
This is where MAPsignals can help you spot what others miss.
Here are the top 5 ranked stocks in our top 3 ranked sectors.