
When Will the Market Selloff End
Equities have gotten battered recently.
Tech stocks in particular are hurting.
The question on every investor’s mind is simple: When will the market selloff end?
Here’s the reality, nearly all stocks are in a downtrend…even the ultra-popular mega-cap tech names.
This is a different setup than what we’ve seen recently as the Magnificent 7 has held up major indices for months.
But like all things in life and markets, what goes up ultimately has to come down… at least periodically.
Afterall, that’s what markets do!
The good news is a lot of damage has already taken place.
The better news is capitulation should be around the corner, signaling a near-term bottom.
Let’s unpack the MoneyFlows picture to understand where the supply and demand picture stands.
Weak Breadth Sends Big Money Index to 5-month Lows
The ultimate power law in markets is supply and demand.
When institutions slow down purchases, stocks fall.
One of the easiest ways to visualize the trend of money flows is with the Big Money Index (BMI). It’s our North Star.
When the line of truth is falling, it indicates that inflows are slowing and outflows are growing.
It now sits at 46%, the lowest reading since late April:
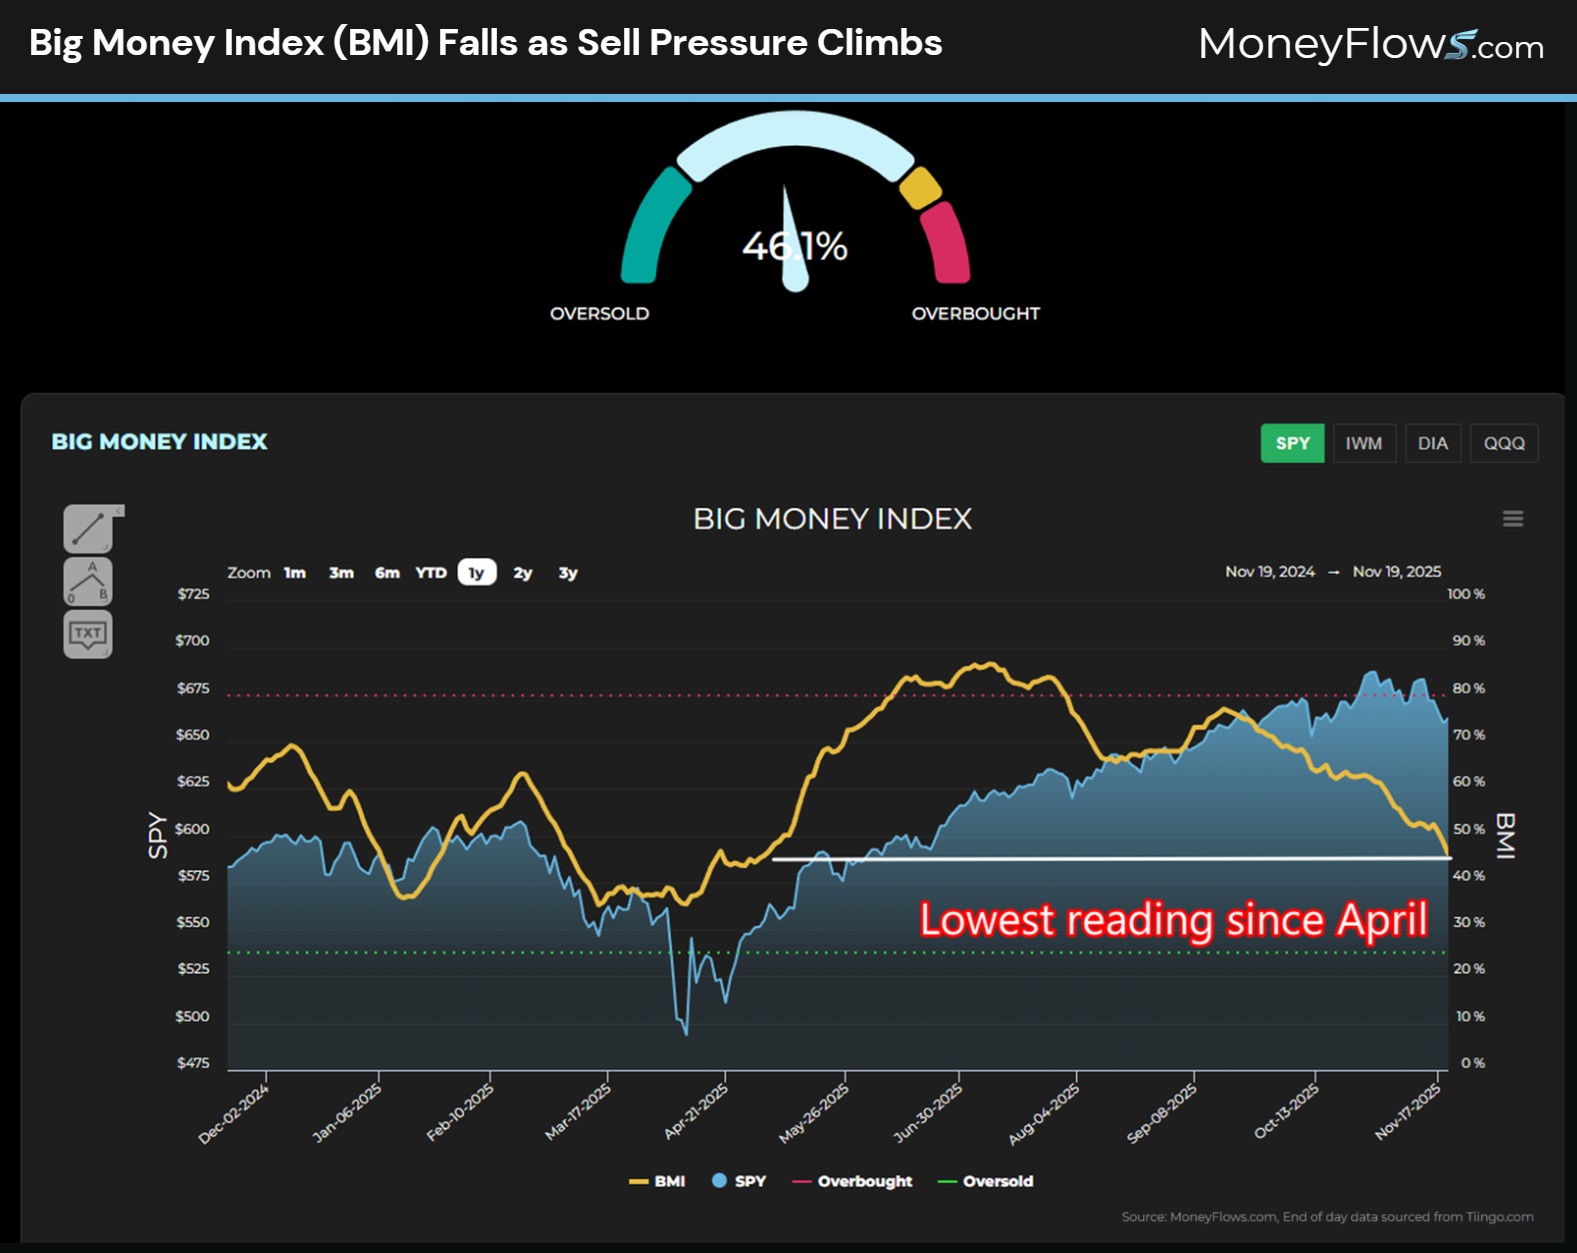
If the BMI is falling, sell pressure must be climbing…and it is.
Just in November outflows have outnumbered inflows by a ratio 2:1 with 1546 red signals vs 877 green signals:

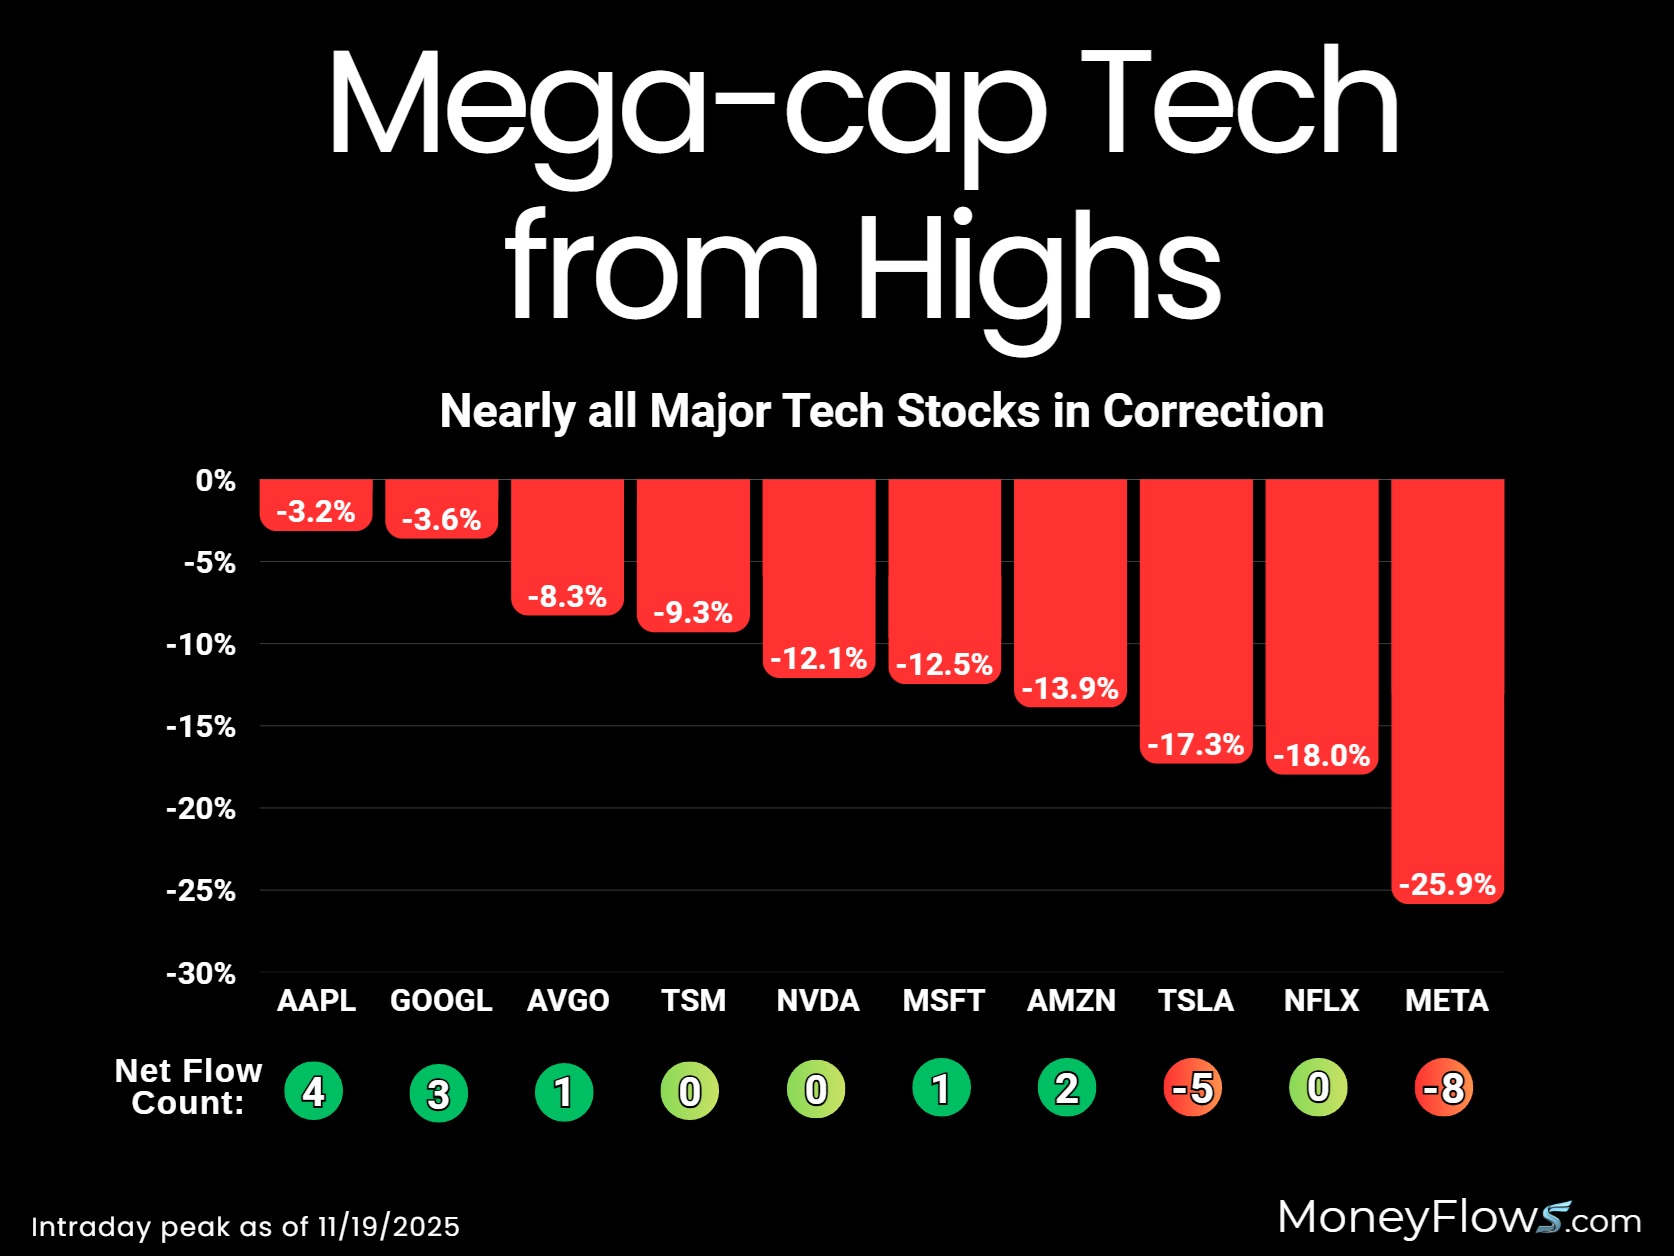
Inside of all this carnage is a clear theme. Most mega-cap tech stocks are in correction territory.
Here we can see how Meta Platforms (META), Netflix (NFLX), Tesla (TSLA), Amazon (AMZN), Microsoft (MSFT) and NVIDIA (NVDA) are all off double digits from their recent peaks:
(Disclosure: I hold long positions in META, NFLX, TSLA, AMZN, & MSFT)
So if your portfolio is down, just know it’s a broad-based pullback.
Now the million-dollar question is simple: When will the market selloff end?
To find an answer, let’s turn to cold hard data.
When Will the Market Selloff End
To tackle a market bottom, you first need perspective on the current landscape.
Earlier I said that there was good news. That’s because the low-level BMI is approaching a level forecasting better than average market returns.
To prove this, consider that we’ve been in business for 11 years. We’ve seen a lot in that decade+ timeframe: a few bear markets and multiple crowd-stunning rallies.
The current BMI sits at 46%. I went back and studied how the S&P 500 performs on average each month, 3-month, 6-month, and 12-month period.
It may not surprise you to learn that the market gains an average of 12% each year.
However, the average gains jump massively when the BMI falls below 40% as evidenced by this chart.
You want to be constructive on stocks as we approach the 40% line because the average forward returns nearly double the market in each timeframe:
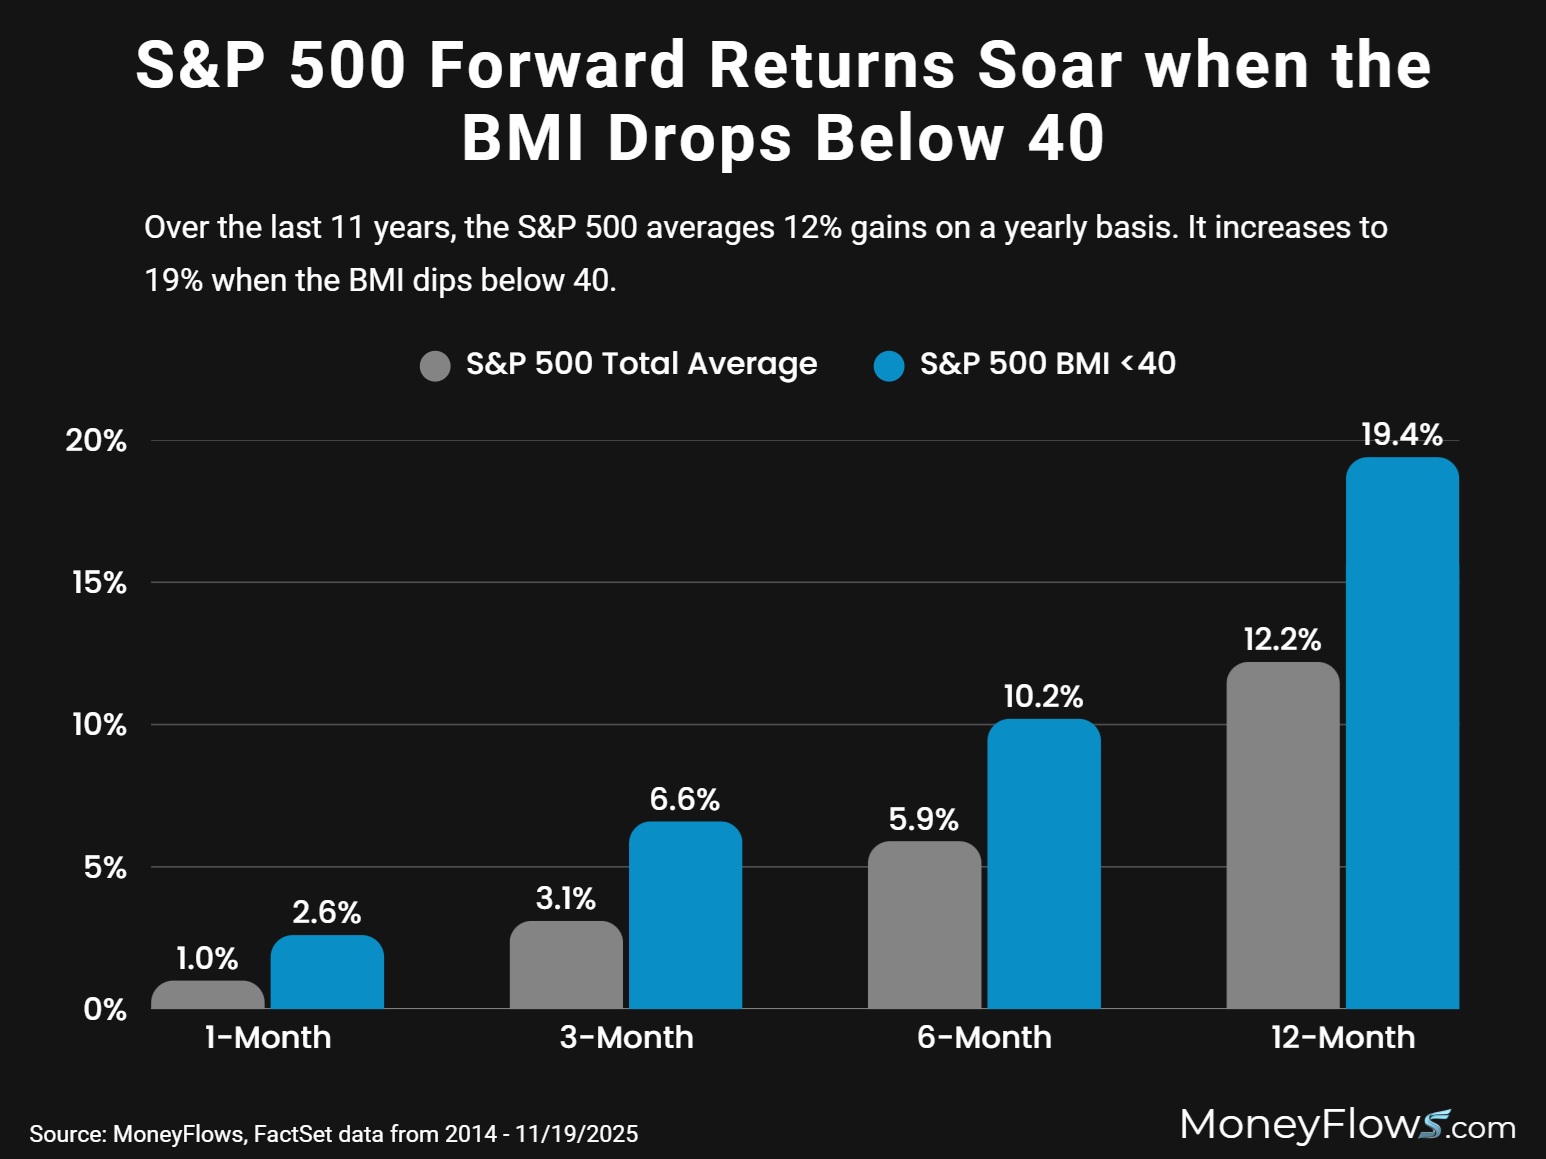
This should make intuitive sense given the old Wall Street adage to buy low and sell high.
But how can we time the market low?
That comes down to spotting capitulation. Our unique data helps you see forced selling in real-time.
How do we define capitulation? It’s roughly 400 equity outflows in a session. That amounts to nearly 30% of our institutionally traded universe.
These rare signals are defined as a Forced Capitulation Trigger (FCT).
Look how these red bars often fall near market reversals:

And to prove their usefulness in helping us find market bottoms, consider the following study.
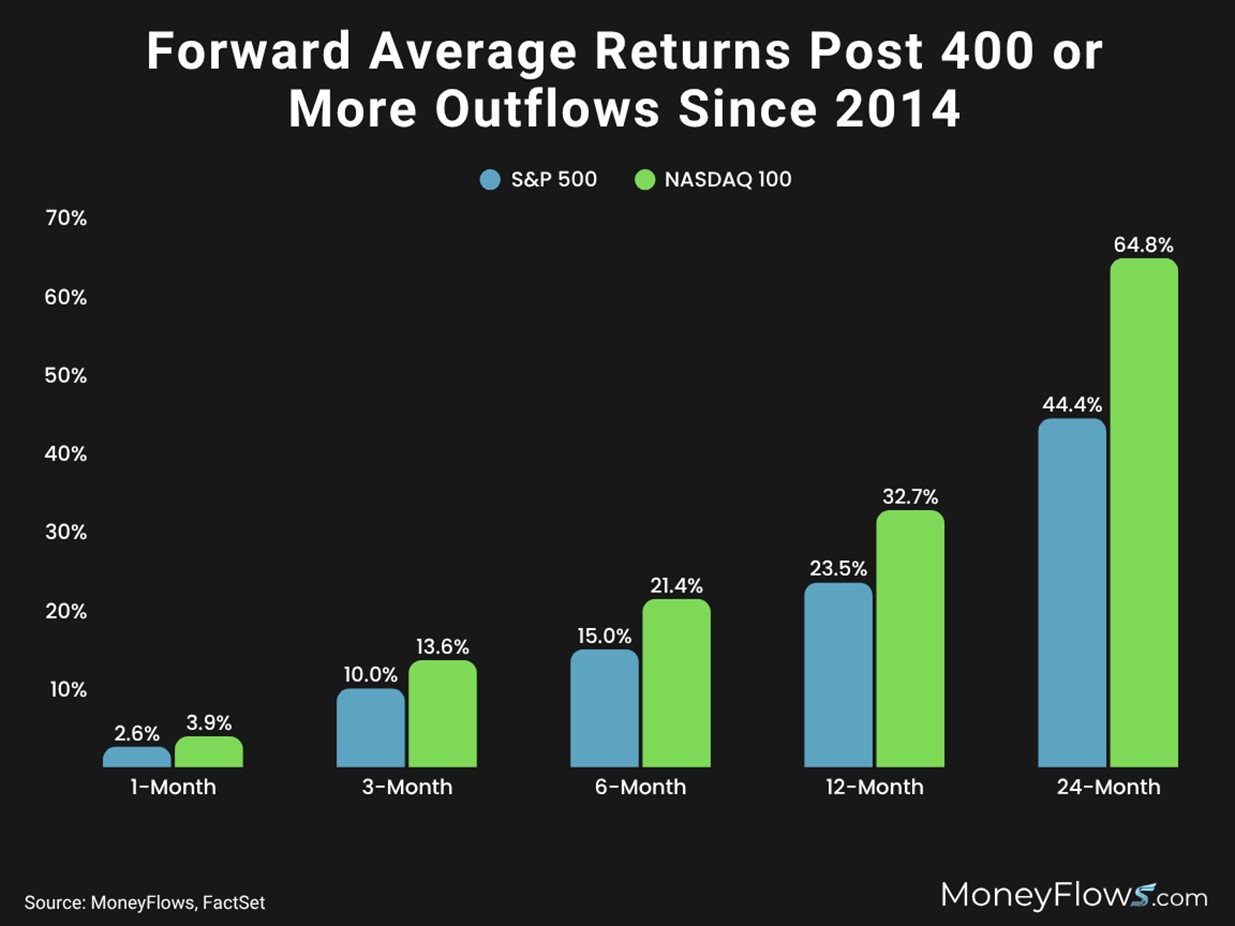
Here’s how the S&P 500 and NASDAQ 100 perform after 400 or more outflows:
- 3-months later large caps gain double digits
- 6-months later the S&P 500 jumps 15% and the NASDAQ climbs 21.4%
- 12-months later the S&P 500 soars 23.5% and the NASDAQ vaults 32.7%
Yes, capitulation is a powerful signal!
Now, we can’t predict the future, but we’ve relied on this signal in the past when most pundits were prophesying market doom.
At the April bottom we made the non-consensus call to prepare for a violent rally.
We did it again at the COVID-19 bottom when we yelled to send the marines.
So let’s take stock of where things stand:
First, we know that a lot of damage has occurred under the surface and many stocks are becoming attractive.
Second, we could be headed for capitulation…which is a great place to add risk into high-quality stocks loved by institutions.
Either way, you should be hunting for all-star stocks now because these weak patches rarely last long.
As we head into the holidays and yearend, there’s no better time to become a PRO member and track our institutional signals and gain access to our market-beating research.
Professional money managers and RIAs looking for additional portfolio solutions please reach out about our Advisor Solution and Emerging Advisor Program.
Don’t guess when the market selloff will end.
Have a plan and a process.
Follow the flows.