
USA Credit Downgrade & Forward Projections
The epic rally stalled.
Many are describing the setback as an elaborate unsolvable debt spiral.
I think it’s simpler…and it all kicked off last Friday.
Let’s unpack Moody’s USA credit downgrade and make evidence-based forward projections.
On Friday, Moody’s downgraded the United States credit rating to Aa1 from Aaa, citing the one-notch downgrade…reflects the increase over more than a decade in government debt and interest payment ratios to levels that are significantly higher than similarly rated sovereigns.
This is a big deal.
A ratings slash implies that the US is a riskier debtor, and it’s sending interest rates higher.
The bad news bears are telling us that this debt spiral is creating some soon-to-come calamity.
Just don’t take the bait.
What’s occurring right now in equities and bonds is exactly what you should expect after a ratings cut.
Once you review the evidence you’ll see the big setup at hand.
Is there more downside ahead for equities? Likely.
Should investors buy the dip? Absolutely.
Let’s unpack why.
Stocks are Falling Hard as Interest Rates Surge
Last week, I discussed the strong market breadth and how a healthy giveback was in order.
Markets finally got a reason to catch their breath.
The Moody’s ratings shock has sent major indices down hard. Since Friday, the S&P 500 is down 1.9% and small-caps are markedly worse, down 3.2%:

That’s ugly.
Much of the reason for the equity collapse is due to one culprit: rising rates.
From Friday’s close we see that the US 10Y yield has zoomed to 4.58%.
That’s a 14bps increase in 3 trading days:

As we’ve highlighted before, stocks are no match for rising rates.
When rates jump, stocks dump.
Below plots a relative return chart between the US 10Y yield and the S&P 500. It’s clear how there’s an inverse relationship between equities and yields:

Don’t make it more complicated than it really is.
Equities are trading down simply due to a rate shock.
Now that we’ve unpacked what is happening.
The valuable exercise is to shed light on why this is happening.
More importantly, there’s a tradable playbook in the weeks ahead.
USA Credit Downgrade & Forward Projections
Open up social media, and the bears offer prophecies of Revelations-style equity doom.
I’ll take the other side.
Here’s why: Today’s environment echoes the last USA debt downgrade.
If we roll back the tape to August 1, 2023, Fitch downgraded the US’s credit rating, which kicked off a wicked interest rate surge.
From July 31, 2023 to October 19, 2023 the US 10Y yield spiked 100bps, going from 3.95% to 4.95% in the span of 2.5 months.
Check it out:

That’s quite a rate shock!
And as you’d imagine, stocks didn’t enjoy it one bit.
To prove it, below are the returns of the S&P 500 after the Fitch debt downgrade. As a bonus, I’ve also included the debt downgrade by S&P from August 5, 2011 for good measure.
Notice the pattern.
Stocks are no match for a USA credit downgrade over the near-term as:
- 1-month after the Fitch and S&P downgrade, the S&P 500 fell 1.7% on average.
- 3-months later, equities are lower by 1.5%
Keep staring and you’ll find the glaring buy-the-dip opportunity.
- 6-months later stocks are up 9.7% on average
- 12-months later stocks are up 17.5% on average
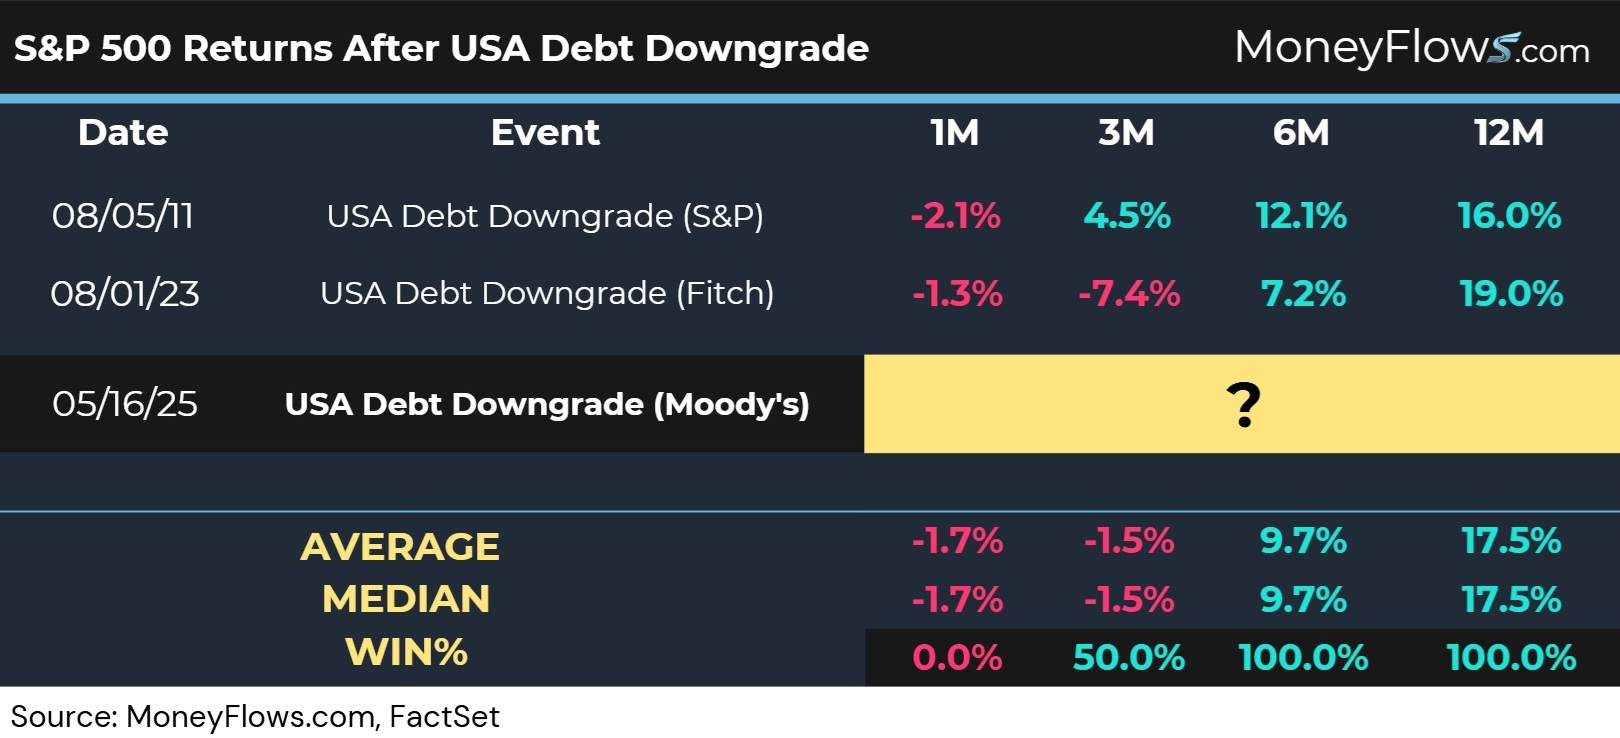
Through this lens, you should feel better about today’s situation.
In fact, assets are following this historical playbook to a tee!
But let’s dive deeper.
Let’s finish up with one last powerful datapoint.
For MoneyFlows members, I alerted everyone to this setup early Monday morning, telling our subscribers to expect downside.
I took the above study a bit further and measured how stocks behave in the weeks after a credit downgrade.
I included the S&P Small-cap 600 and S&P Mid Cap 400 for a comprehensive overview.
Below is the image shared, highlighting what we can expect from large, mid, and small-caps in the weeks ahead.
After the prior 2 USA credit downgrades here’s what occurred:
- 1-week later: large, mid, and small-caps fell 1.7%, .9%, and 1.9% respectively
- 2-weeks later: large, mid, and small-caps dropped 4.7%, 5.1%, and 6.4% respectively
- 3-weeks later: large, mid, and small-caps dumped 1.7%, 1.7%, and 3.5% respectively
But also notice the beautiful setup. All indices gained handsomely 6- and 12-months later with:
- 6-months later: large, mid, and small-caps jumped 9.7%, 8.3%, and 9.6% respectively
- 12-months later: large, mid, and small-caps ripped 17.5%, 11.6%, and 11.7% respectively
Check it out:

Wow. Hug a bear!
Folks, after a crowd-stunning rally, a healthy pullback is necessary.
The Moody’s downgrade is the reason.
Don’t buy into the fear-driven narrative…study history…and follow the money flows!
The bad news is that the current swoon likely has more downside to go.
The great news is now you have a playbook.
In the coming days and weeks, if history is any guide, you’ll want to play offense rather than defense.
Institutions will be putting money to work…and you won’t get the memo from the talking heads.
You’ll need to follow the Big Money.
Here’s your opportunity.
If you’re a professional money manager, Registered Investment advisor, or serious investor get started today with MoneyFlows PRO subscription and listen to my Monday update discussing this the debt downgrade setup.
Next time be early.
And remember…
Go with the flows!