
Summertime Stock Pullbacks: Buy the Dip
Stocks continue to defy the crowd.
The April low to July peak is the best in 5 years.
At some point, markets will catch their breath.
You’ll want to be aggressive. If you see any summertime stock pullbacks: buy the dip.
We’ve been as bullish as anyone can be throughout the crash and rip of 2025. And we still believe big gains lie ahead over the medium to longer-term.
Earnings are working…and A.I. investments continue to pile up. This is an overwhelmingly positive setup for risk assets.
That doesn’t mean stocks won’t have healthy pullbacks along the way. Anyone who’s been around for low-liquidity summers like 2023 can agree.
While no one has a crystal ball to alert us of the future, we can look to data for insights.
2 powerful studies will help us navigate should summer doldrums appear.
Stocks Struggle when the Big Money Index Falls Out of Overbought
Just 3 months ago stocks were at rock bottom as tariffs spooked many into believing a Great Depression was ahead.
We didn’t buy into that narrative. We saw some of the most violent forced selling ever…and we’ve learned that stocks tend to rally hard after those rare events.
One of our best pieces of the year came on April 10th where we highlighted 15 extreme charts for April 2025.
We believed the unthinkable was ahead…and boy did it come!
When money is surging into equities, major indices have nowhere to go but up. Here’s the Big Money Index (BMI). I’ve circled the pivot points similar to April 2025:
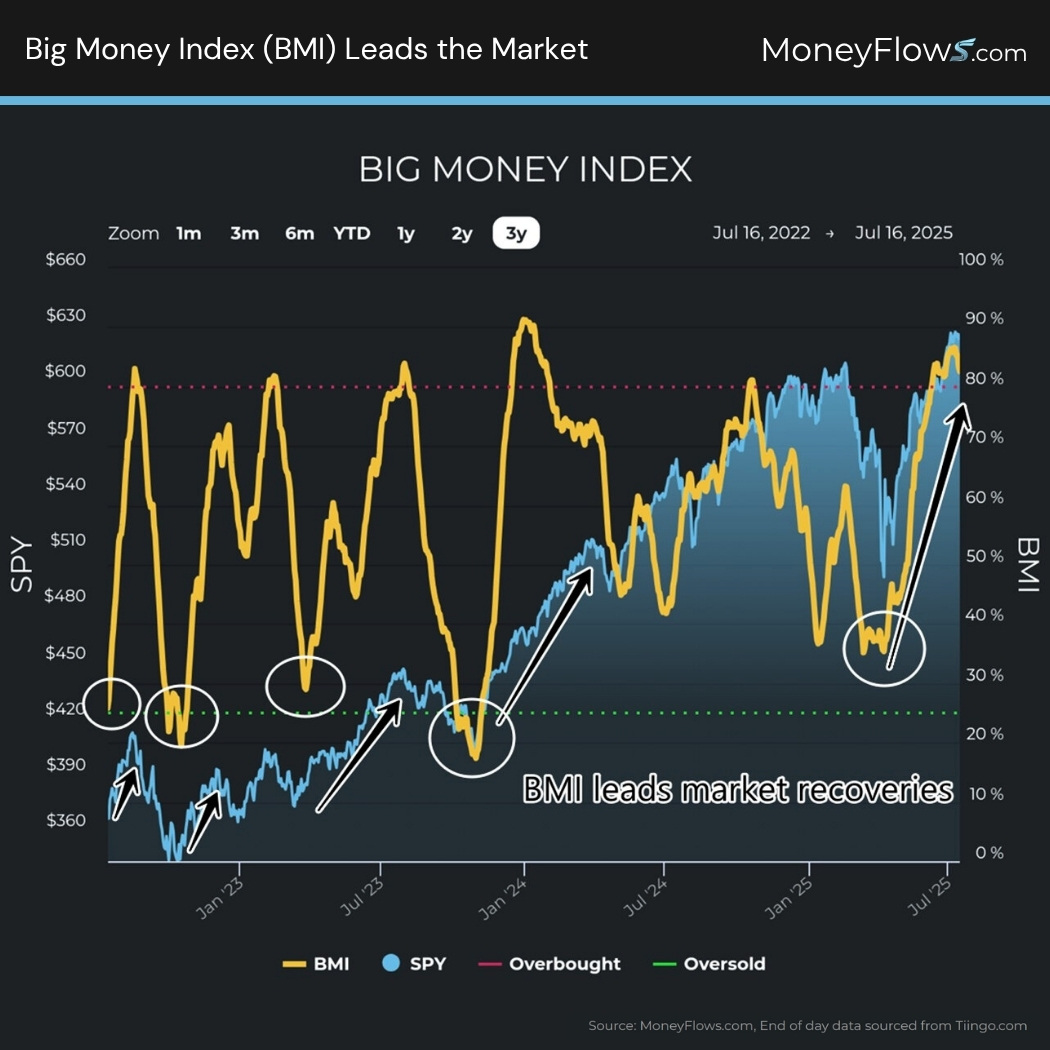
Congrats if you went against the crowd on this one. From low to peak, the S&P 500 has jumped just over 26%…one of the steepest rallies ever.
Now why would I engage in thinking a summertime pullback is possible?
- Seasonal weakness: Over the last 20 years the S&P 500 is flat in August and averages a -.6% return during September…over the last 10 years September has averaged -2% returns
- At some point the Big Money Index will fall out of the overbought zone…stocks have been no match for a falling BMI
Regarding the 2nd point, we’ve been overbought for 25 sessions, this is beyond the average 21 sessions we typically see.
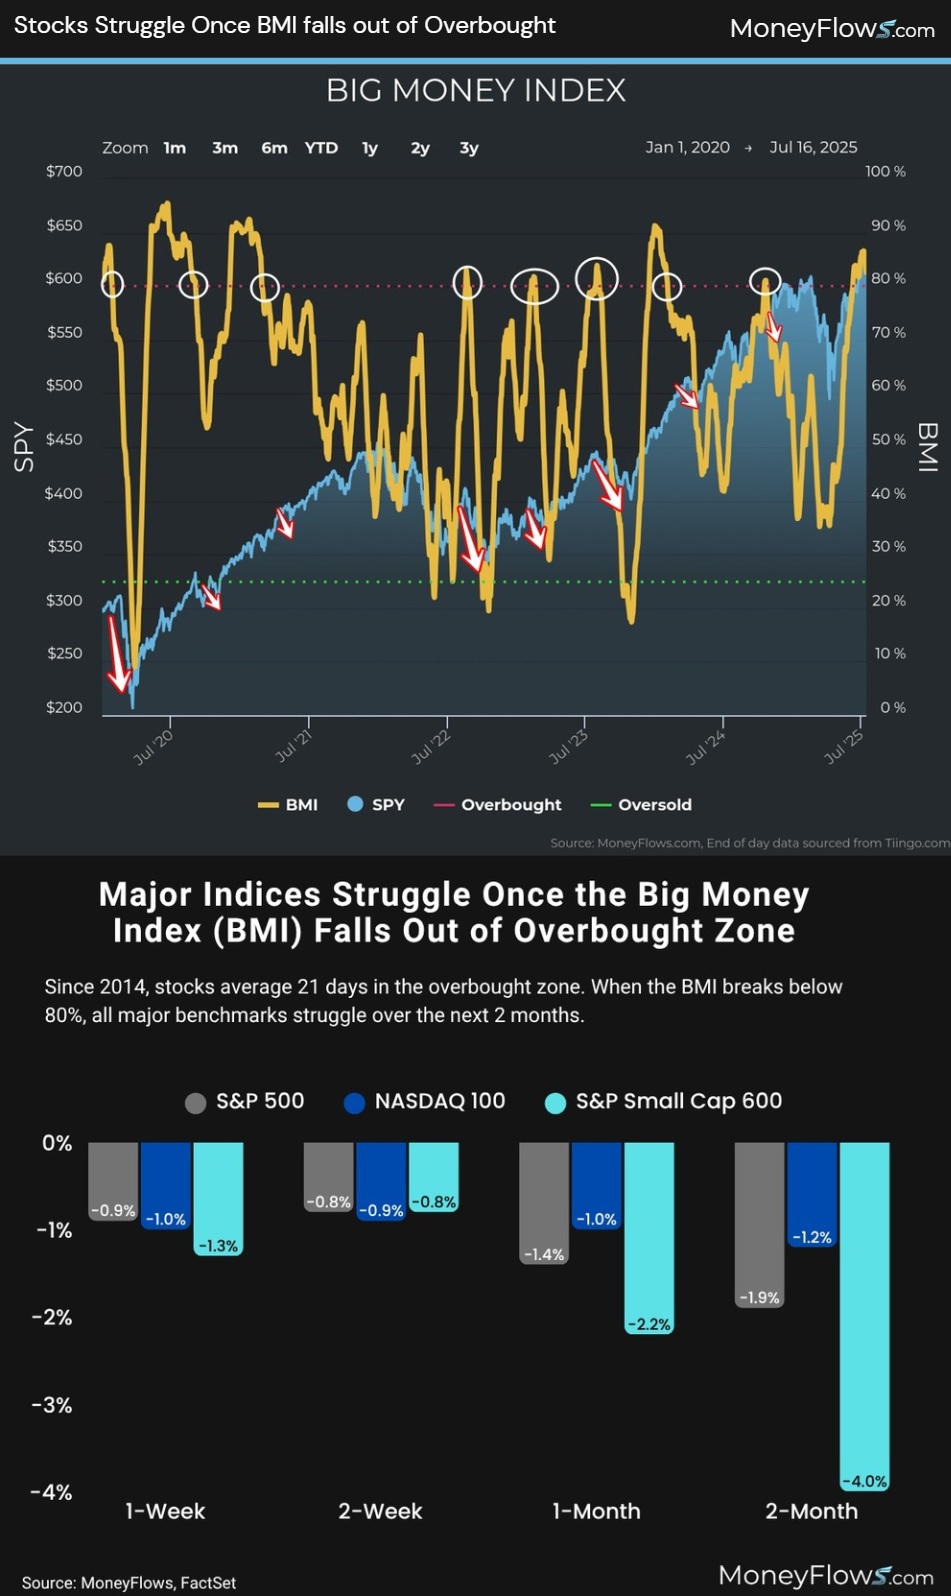
When the Big Money Index (BMI) falls out of overbought, all major indices tend to struggle with:
- 1-week returns of -.9% for the S&P 500
- 2-week returns of -.8% for the S&P 500
- 1-month returns of -1.4% for the S&P 500
- 2-month returns of -1.9% for the S&P 500
Below you’ll see prior BMI periods falling out of the red zone. I’ve included the NASDAQ and S&P Small Cap 600 performance as well:
Don’t let this potential setback alarm you…instead let it arm you.
If you see any summertime stock pullbacks, buy the dip – with both hands. This next study will help us understand why.
Summertime Stock Pullbacks: Buy the Dip after 26% Surge in 63 Sessions
Just 2 months ago we discussed market rally breadth and future projections.
We noted the 14.1% thrust in the S&P 500 over 17 days. That signal study suggested big gains follow ultra-strong market performance.
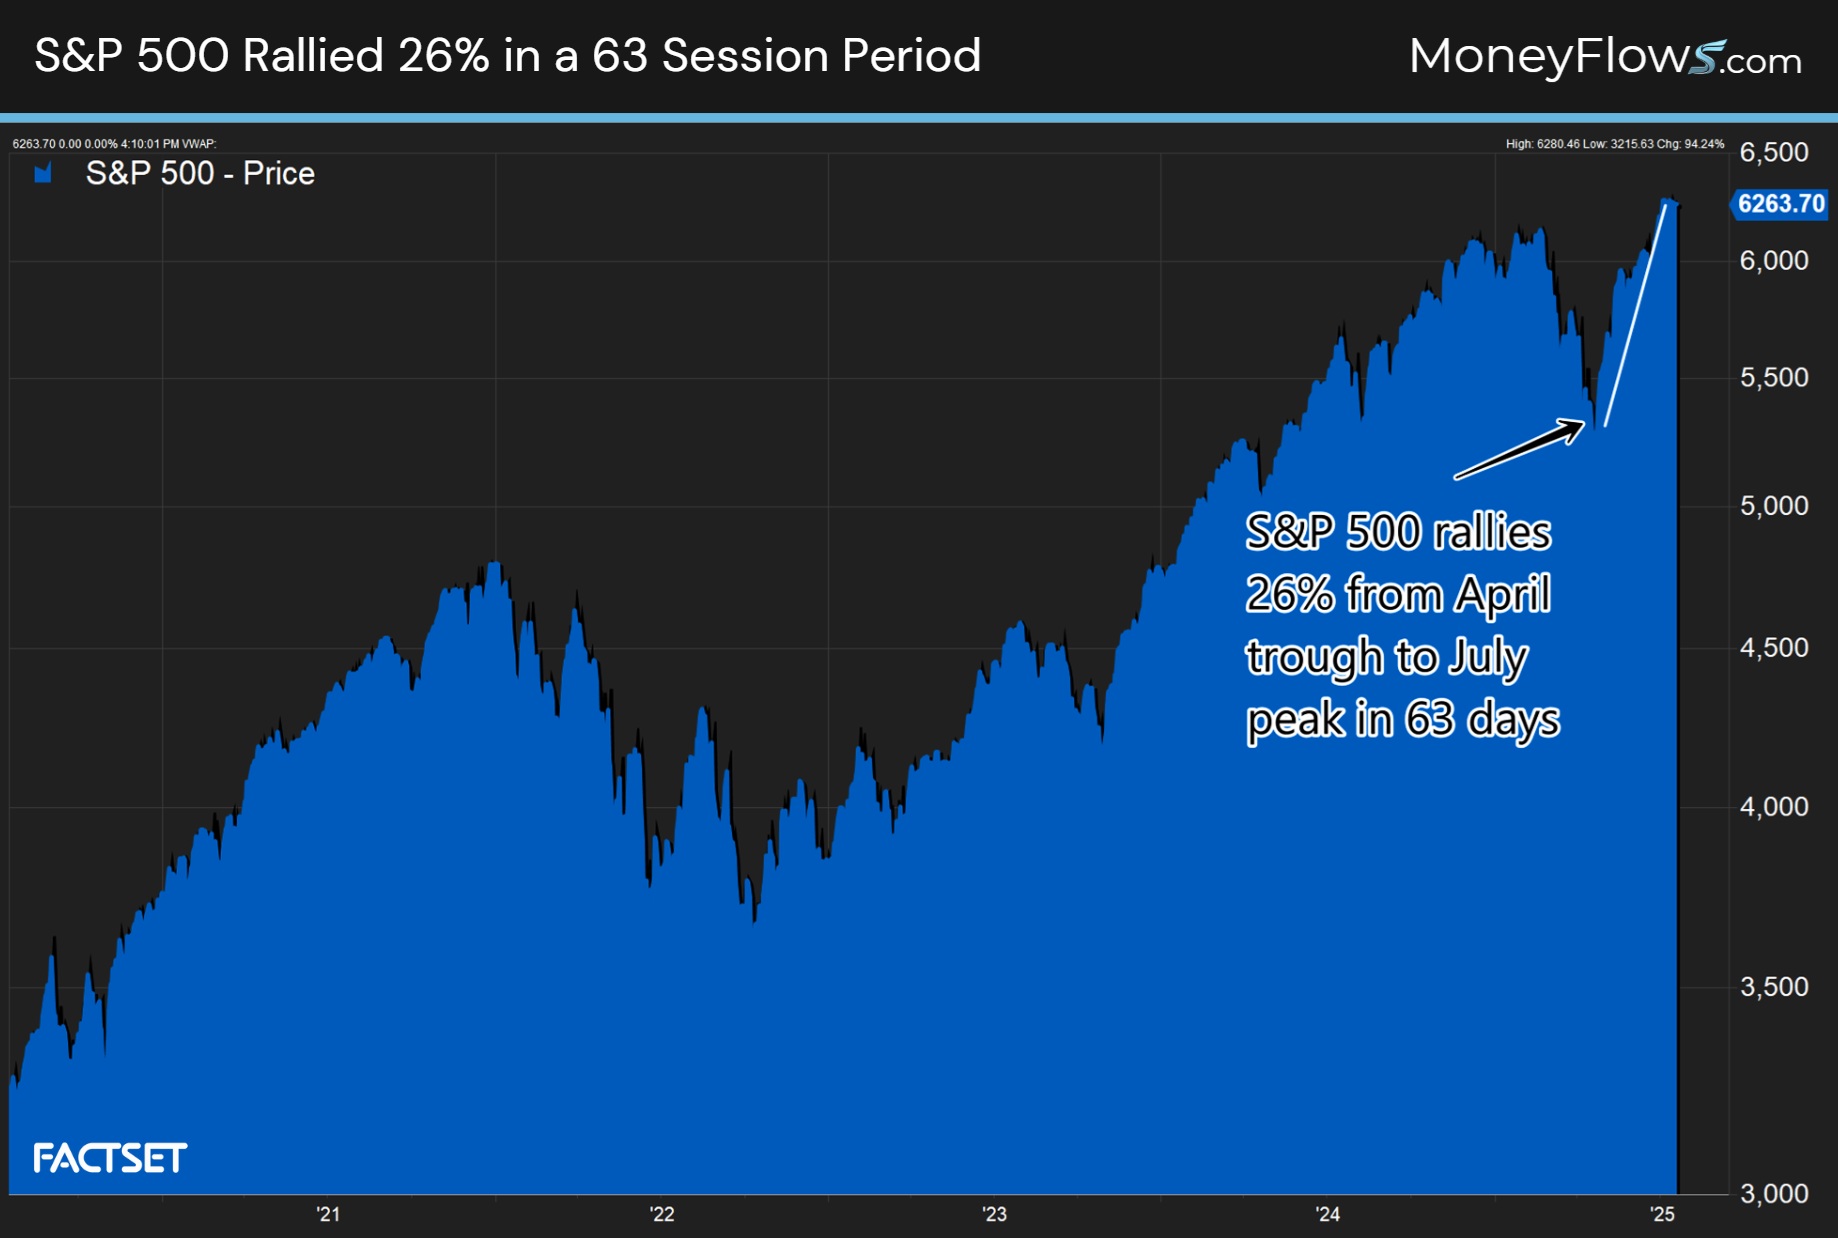
Fast forward to today and we’re staring at a 26% gain from the market lows on April 8th to the highs on July 10th.
Check it out:
If you want an incredible stat to share, it’s this. Since 1984 there’ve only been 20 periods where the S&P 500 gained 26% or more in a 63-session period.
The last handful of times it occurred was in July of 2020 coming out of the COVID-19 crash. Before that it was 2009 when stocks were healing from the GFC.
And before that it was January 1999.
But the million-dollar question is what comes next.
You’ll want to hug a bear!
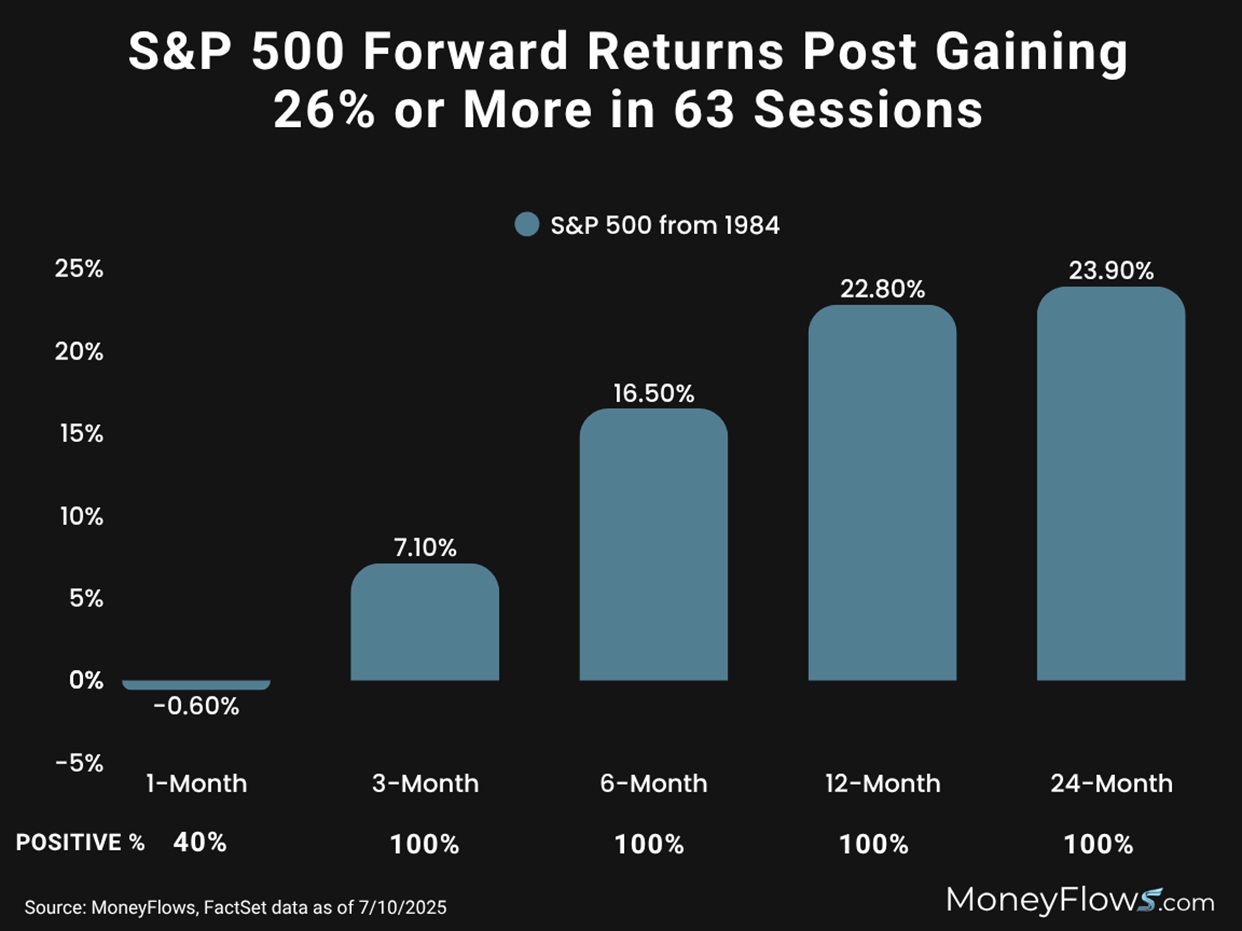
When the S&P 500 gains at least 26% in 63 trading sessions here’s what comes next:
- 1-month later stocks fall .6%
- 3-months later stocks jump 7.1%
- 6-months later equities surge 16.5%
- 12-months later equities leap 22.8%
It’s important to note that 3-months after this signal, stocks have never been lower:
That’s a chart if you ask me!
Look, pullbacks are common. And if the Big Money Index falls out of overbought, expect some giveback in your portfolio.
Throw in the fact that summers can get dicey and you’re staring at a great time for markets to find an excuse to give back some of their monster gains.
But don’t get too fearful. The S&P 500 just rocketed 26% in 3 months…that’s ultra rare. Stocks tend to sputter the following month, before ripping higher.
Always be prepared for anything in markets…and be armed with cold hard data.
Buy any summertime dip.
Ride the rip!
If you want to learn more about our proprietary indicators and how we find the best stocks in the market, check out our PRO subscription.
If you’re a money manager or RIA and want portfolio solutions, reach out about our Advisor solution here.
Lastly, if you’d like to read our content from the market low in April, find it here.
Have an amazing week!