
Strong Earnings Send Huge Capital into Small-Caps
by Jason Bodner All, Big Money Insights Weekly, StocksIn 1972, the CIA quietly funded a program that sounds like science fiction.
Physicists Hal Puthoff and Russell Targ at Stanford Research Institute studied an artist named Ingo Swann, who claimed he could perceive distant locations given only geographic coordinates.
In 1973, they asked him to describe Jupiter before NASA’s Pioneer 10 flyby. He described a faint ring around the planet. Six years later, Voyager confirmed it. Another participant, Pat Price, provided descriptions of a Soviet weapons facility later verified by satellite imagery.
The Stargate Program ran twenty-three years, cost $20 million, and was declassified in 1995.
Whether you believe in remote viewing is beside the point. Most see what is directly in front of them. But sometimes a trained observer, or a well-calibrated instrument, can see what everyone else is missing.
That’s essentially what good flow data does for markets.
It strips away headlines, fear, and narratives about what stocks should be doing and measures what investors are actually doing.
This week, the surface looked complicated. Underneath was a different story.
What the Surface Showed
Iran’s Strait of Hormuz remained unresolved, sending oil up 5% on Monday. SpaceX reported its first post-IPO earnings, nearly doubled revenue to $7.8 billion, and still dropped 13.6% as investors winced at $16 billion in quarterly cap-ex.
Yet by Thursday, the S&P 500 drove to a record high.
The Nasdaq 100 added 1.15% as back-to-back inflation readings made a September rate cut less likely. Money markets priced less than a 40% chance of a hike.
Meanwhile, the Russell 2000 set a record, suggesting the rally is expanding beyond the mega-cap names that dominated earlier this year.
The market absorbed everything thrown at it and kept climbing.
What MoneyFlows Data Showed
Technology and healthcare accounted for 52% of all institutional inflows this week, 167 of 320 total.

Healthcare has posted nine consecutive weeks of net inflows. Technology posted its second straight strong week as AI names continued gapping higher following last month’s Aschenbrenner liquidation event.
But the most interesting number came from where the money went.
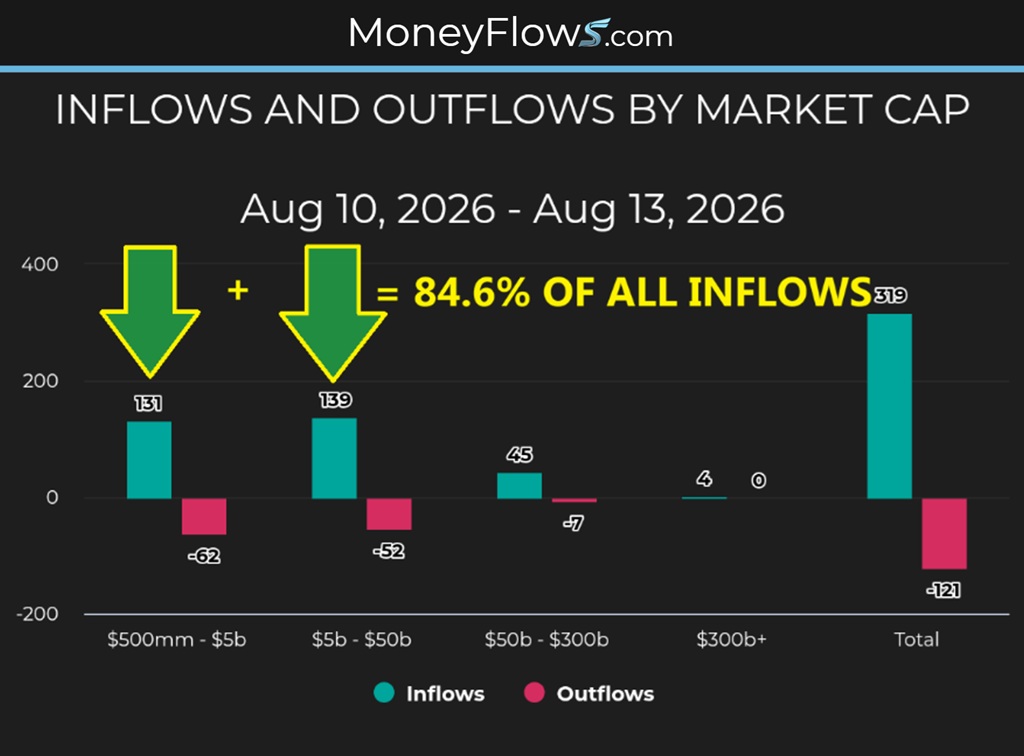
Small and mid-cap companies worth between $500 million and $50 billion accounted for 84.6% of all inflows.
Mega-cap names above $300 billion attracted just four inflows, or 1.3% of the total.
When institutions get nervous, they typically hide in the biggest, safest, most liquid names.
Right now, they’re doing the opposite.
Strong Earnings Send Huge Capital into Small-Caps
Money is flooding into smaller, higher-growth companies. That’s one of the clearest risk-on signals in months.
The score data also tells us about the quality being bought.
Among the names seeing the strongest recoveries, 139 stocks carried fundamental scores that barely moved through the July selloff, averaging 66% in June and still 66% in August.
Their overall model scores compressed from 68 to 56 under July’s selling pressure. They’re now moving back toward 64 as prices recover.
The average bounce from the July low is nearly 10%.
That doesn’t look like an indiscriminate short squeeze. It looks like quality companies squished by forced selling being repriced toward where their fundamentals say they belong.
The Earnings Backdrop
With 88% of S&P 500 companies reporting earnings, 86% beat earnings estimates and 76% beat revenue estimates.
The blended earnings growth rate is 50.4%, the highest since Q2 2021.
LSEG shows 98% of healthcare, 93% of technology, and 88% of financials companies beat estimates: one of the highest beat rates on record.
Exclude large one-time gains at two major technology companies and blended growth still comes in at 32%, the second consecutive quarter above 25% and seventh straight quarter of double-digit growth.
Two sources. Same conclusion.
Corporate America is delivering.
Sector Spotlight
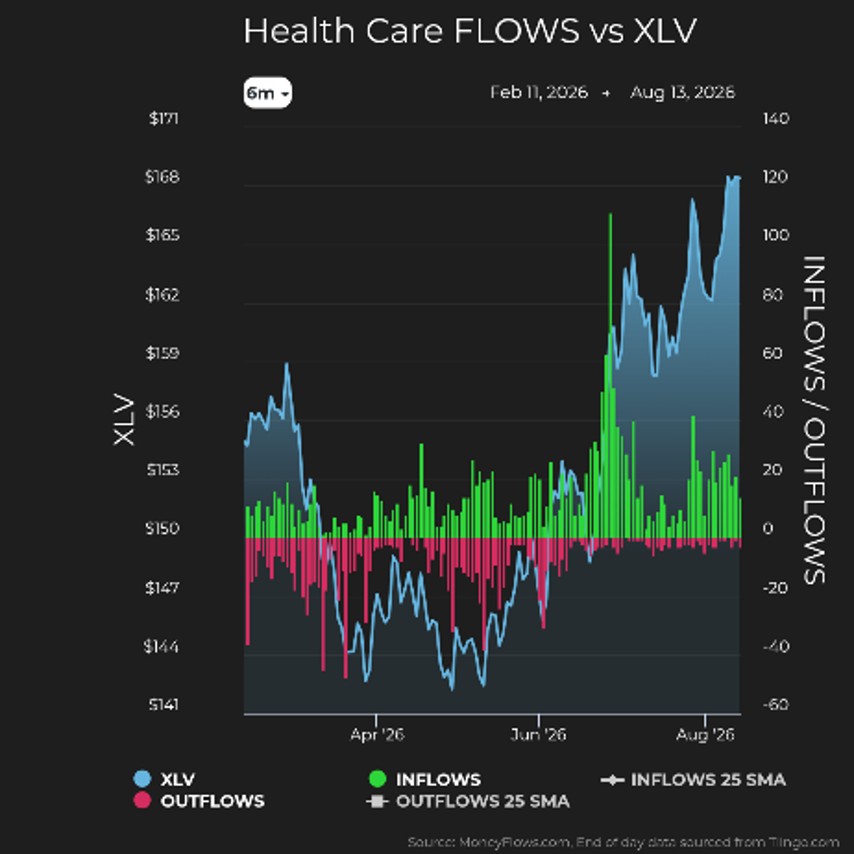
Healthcare led all sectors at 75 net inflows, a nine consecutive week streak. It saw 82 inflows against seven outflows, led by medical devices and specialty pharma rather than the biotech names that dominated earlier this summer.
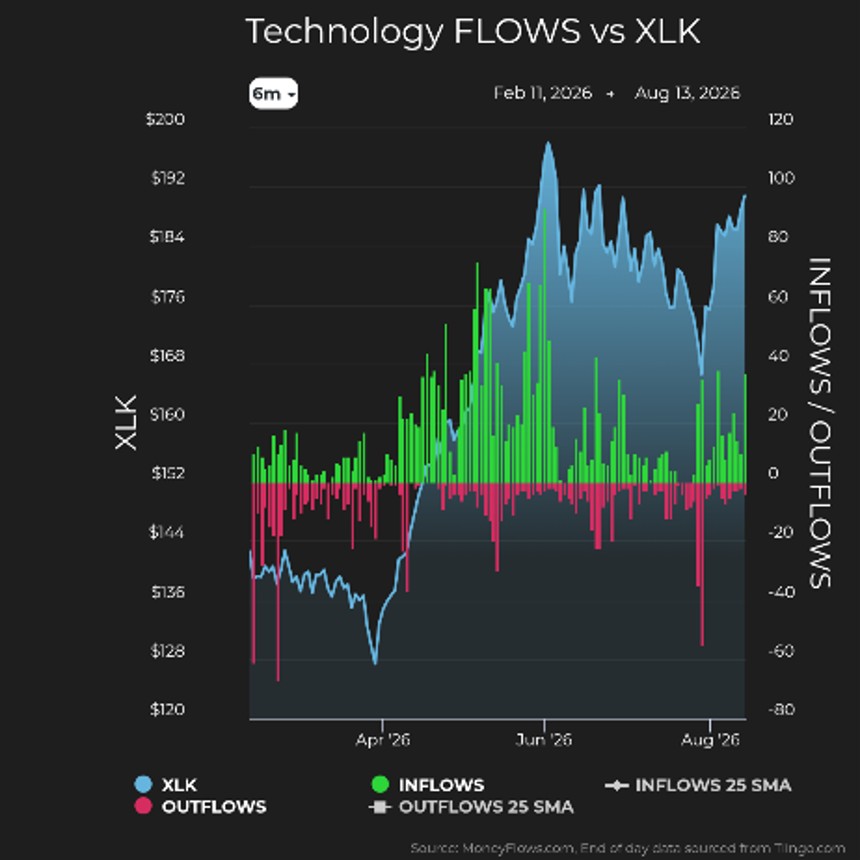
Technology followed closely at 73 net inflows, with 85 inflows against 12 outflows. Buying concentrated in enterprise software, cloud infrastructure, cybersecurity, and data platforms.
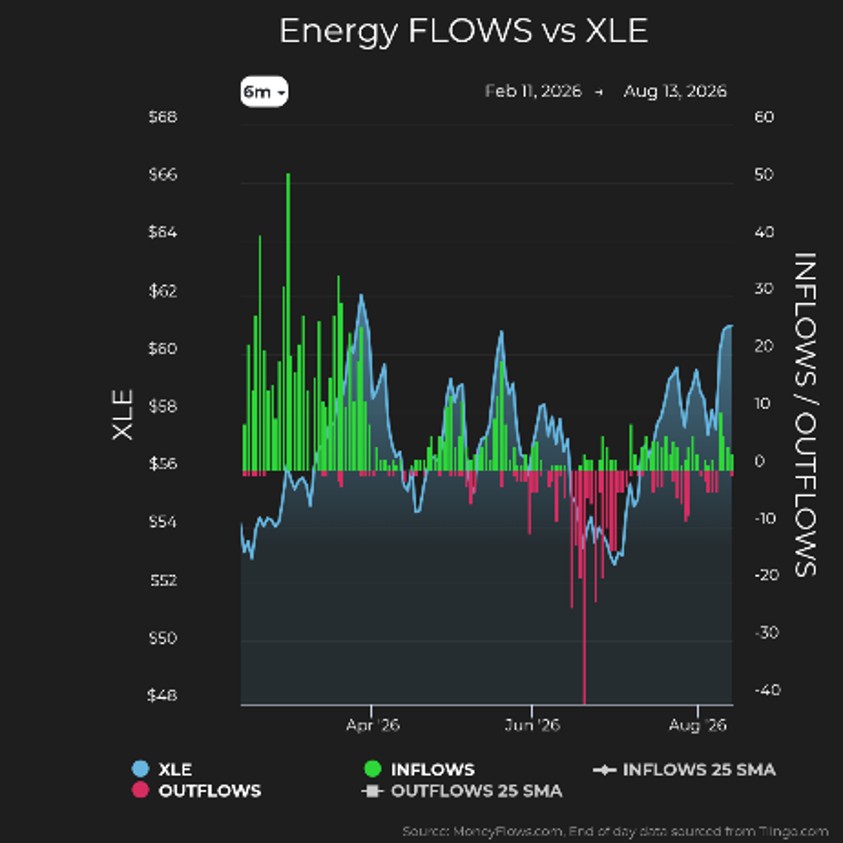
Energy returned positive at plus 22, but downstream refiners led again, not producers.
Companies like Marathon Petroleum and Phillips 66 profit from the spread between crude costs and refined product prices, not just oil performance itself. That’s a more sophisticated bet than “oil is going up, buy energy.”
Industrials and materials were positive.
Utilities tell the story in reverse.
Of 55 stocks in our utility universe, seven saw outflows this week. That’s 12.7% of the admittedly small sector sold in a week.
The fear trade isn’t fading. It’s being reversed.
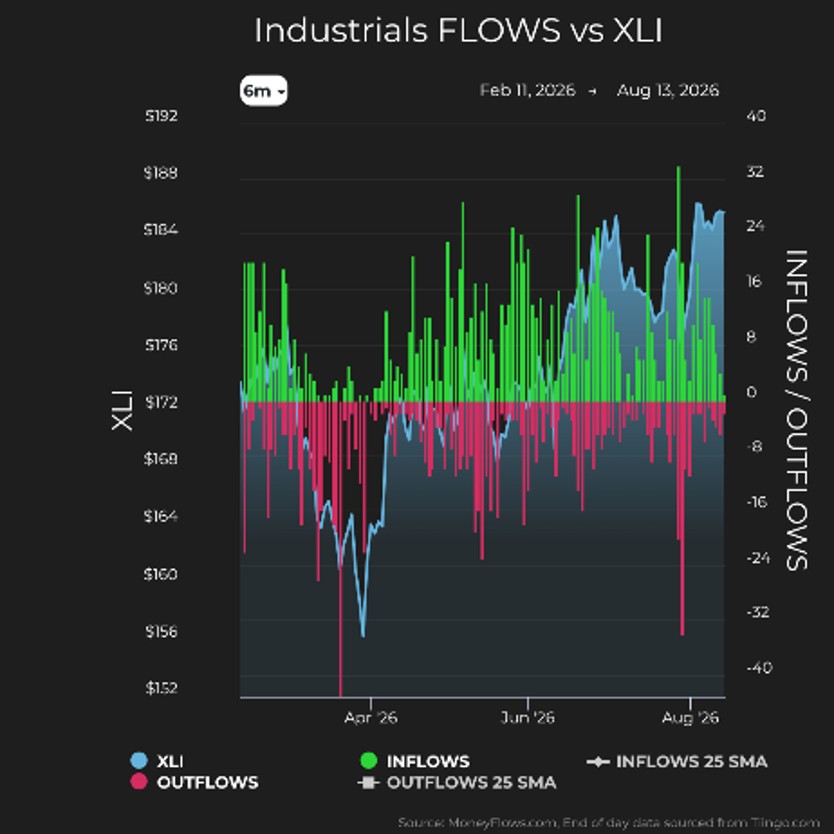
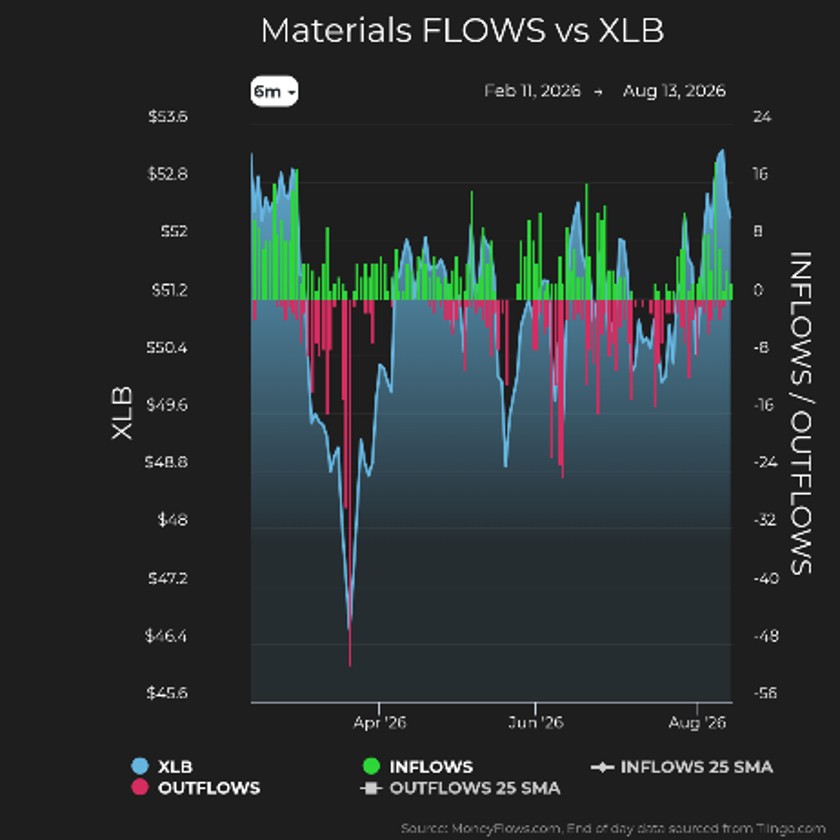
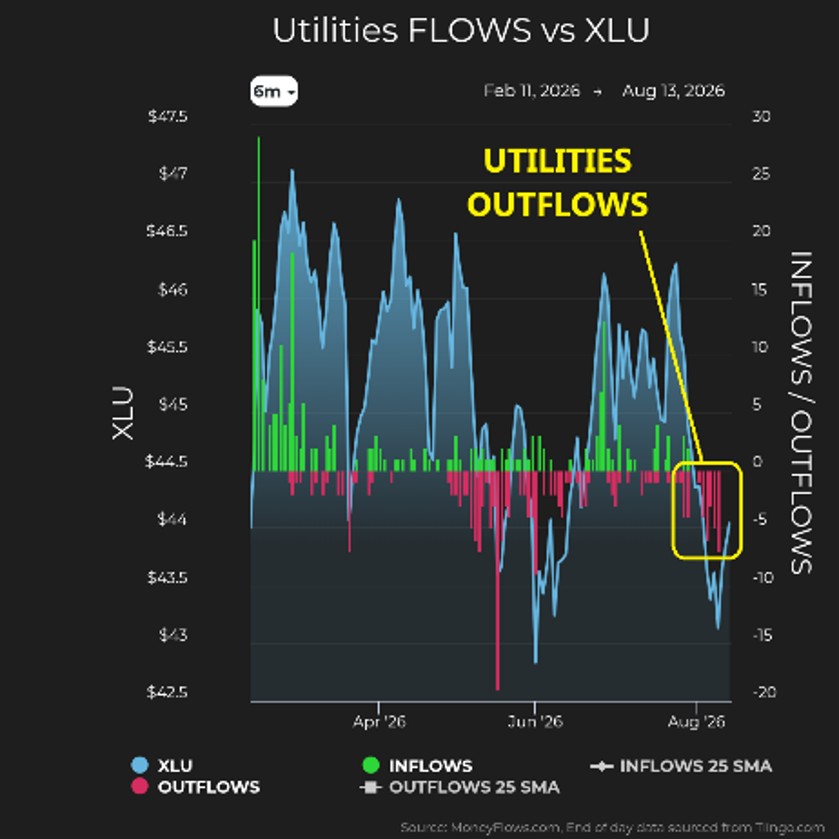
The rotation is consistent: growth leads, defensives retreat, and quality is rewarded over safety.
August Is Defying the Script
August is historically the second weakest month of the year. That weakness is more pronounced in midterm election years.
And yet the S&P 500 is pushing toward records. Small caps are breaking out. Flow data shows institutional accumulation rather than retreat.
Three independent datasets, the historical snap-back study, seasonal calendar, and midterm election pattern, pointed toward near-term choppiness.
The market is saying something else.
When a market absorbs unresolved geopolitical tension, climbs to records, floods money into small caps, and produces its best earnings season since 2021, something important is happening beneath the surface.
The headlines tell us what to worry about.
The money tells us what investors are doing.
That brings me back to Ingo Swann.
You don’t have to believe he could see Jupiter’s rings to understand the lesson. Markets are filled with things everyone can see: oil, wars, the Fed, inflation, earnings, red screens and green screens.
I care about what’s harder to see.
Where is money going?
Right now, it’s going into technology, healthcare, smaller companies, higher-growth companies, and fundamentally strong stocks compressed during July’s forced selling.
And it’s leaving defensive utilities.
That is measurable.
As Epictetus wrote, “it is not what happens to you but how you react to it that matters.”
August has thrown plenty at this market.
So far, its reaction has been to keep climbing.
That’s the signal I’m paying attention to.
If you’re a serious investor or money manager, get started today.
Our PRO subscription showcases daily flows on stocks and gives you access to our weekly Outlier 20 report.
This is the report that has found EVERY SINGLE ONE of our Outlier stocks.
Enjoy a click-through experience unlike anything out there.
Professional money managers and RIAs looking for additional portfolio solutions including ETF flows & ranks and your own Portfolio Tracking tools, please reach out about our Advisor Solution and Emerging Advisor Program.
Have a great week!
***Lastly, join me, Jason Bodner, LIVE, August 25-28, 2026, at the MoneyShow Masters Symposium in San Francisco.
You don’t want to miss this! Click the image below to reserve your spot.