
Market Breadth is Deteriorating
Major indices break higher day after day.
That said, plenty of outflows have been noted recently.
Under the surface, market breadth is deteriorating.
2025 has taught us that anything is possible with markets. We’ve gone from a market crash to market exuberance in record fashion.
Incredibly the S&P 500 Technology Sector has jumped 50% from the April 8th lows.
A.I. investment continues to accelerate.
Owning the best companies is paying off.
Earnings season has been spectacular for many equities. Just last night Meta Platforms (META) and Microsoft (MSFT) unleashed powerful beats and raises. (Disclosure I own MSFT and META in personal accounts)
And it isn’t just the stalwarts that are working.
There are a handful of other discrete monster winning stocks that our data finds early like Celestica (CLS) …which has gained over 1100% since first initiated on our Outlier 20 Report.
The last few months have created one of the best stock-picking environments in years…but eventually it’ll cool down.
I suggested 2 weeks ago, be on the lookout for a potential healthy Summertime pullback.
Our data signals less market participation…if this trend continues, get ready to buy the dip.
Big Money Index (BMI) Could Fall Out of Overbought Soon
The ultimate power law in markets is supply and demand. When demand outstrips supply, stocks have nowhere to go but up.
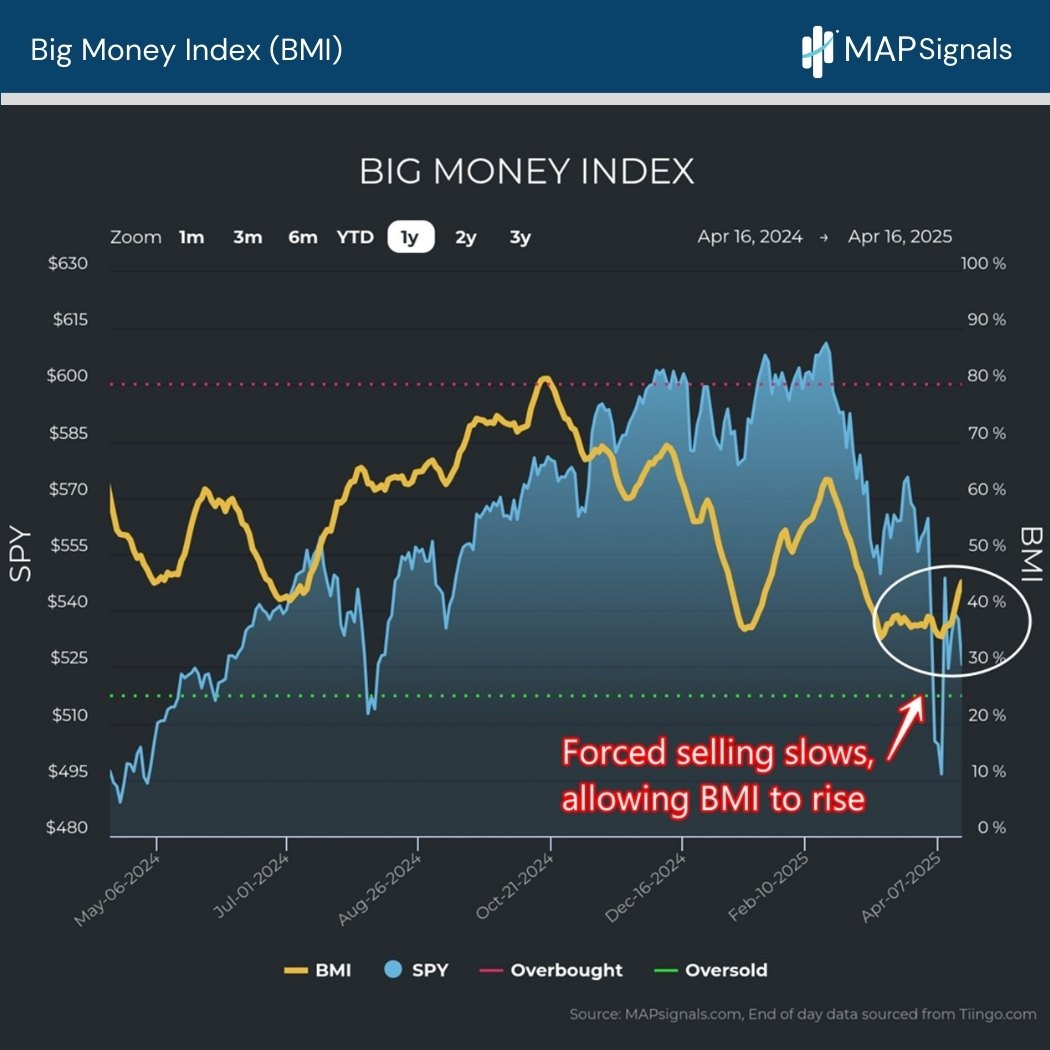
This is the main reason we were constructive at the market bottom in April. Capitulation had stopped and that often precedes wicked rallies.
In mid-April we showcased this chart in our piece about the S&P 500 death cross. While the media was bearish, our indicators signaled risk-on.
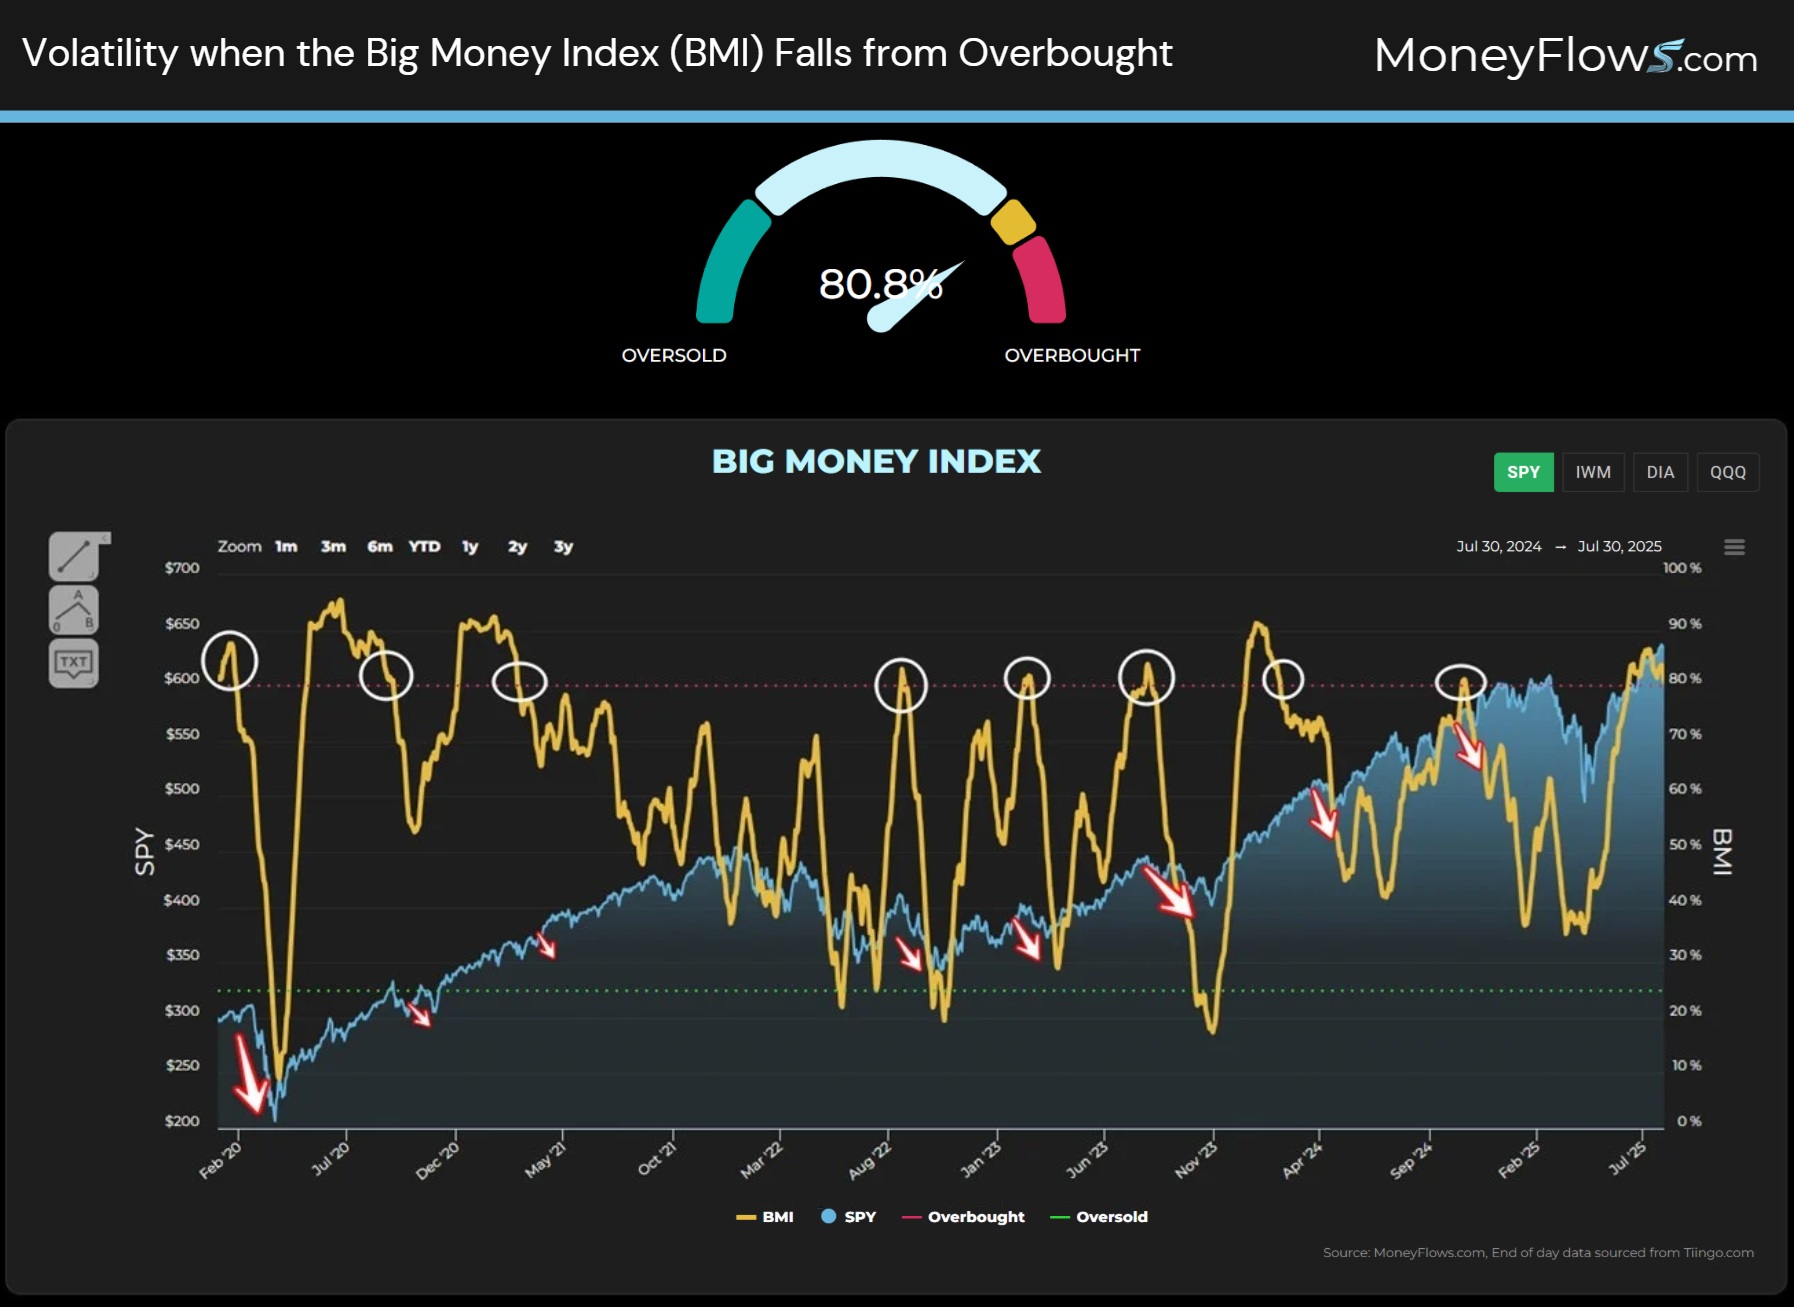
Since April, our BMI has vaulted to overbought for 35 days. This is drastically longer than the 21-day average.
Interestingly, the BMI has fallen to its lowest level since early June. It currently sits at 80.8%…slightly in red territory.
It’s when the BMI falls out of overbought that volatility tends to arrive. Below I’ve circled prior falls out of overbought:
Now, before we go into why a fall from overbought is important, let’s understand why our data is potentially shifting.
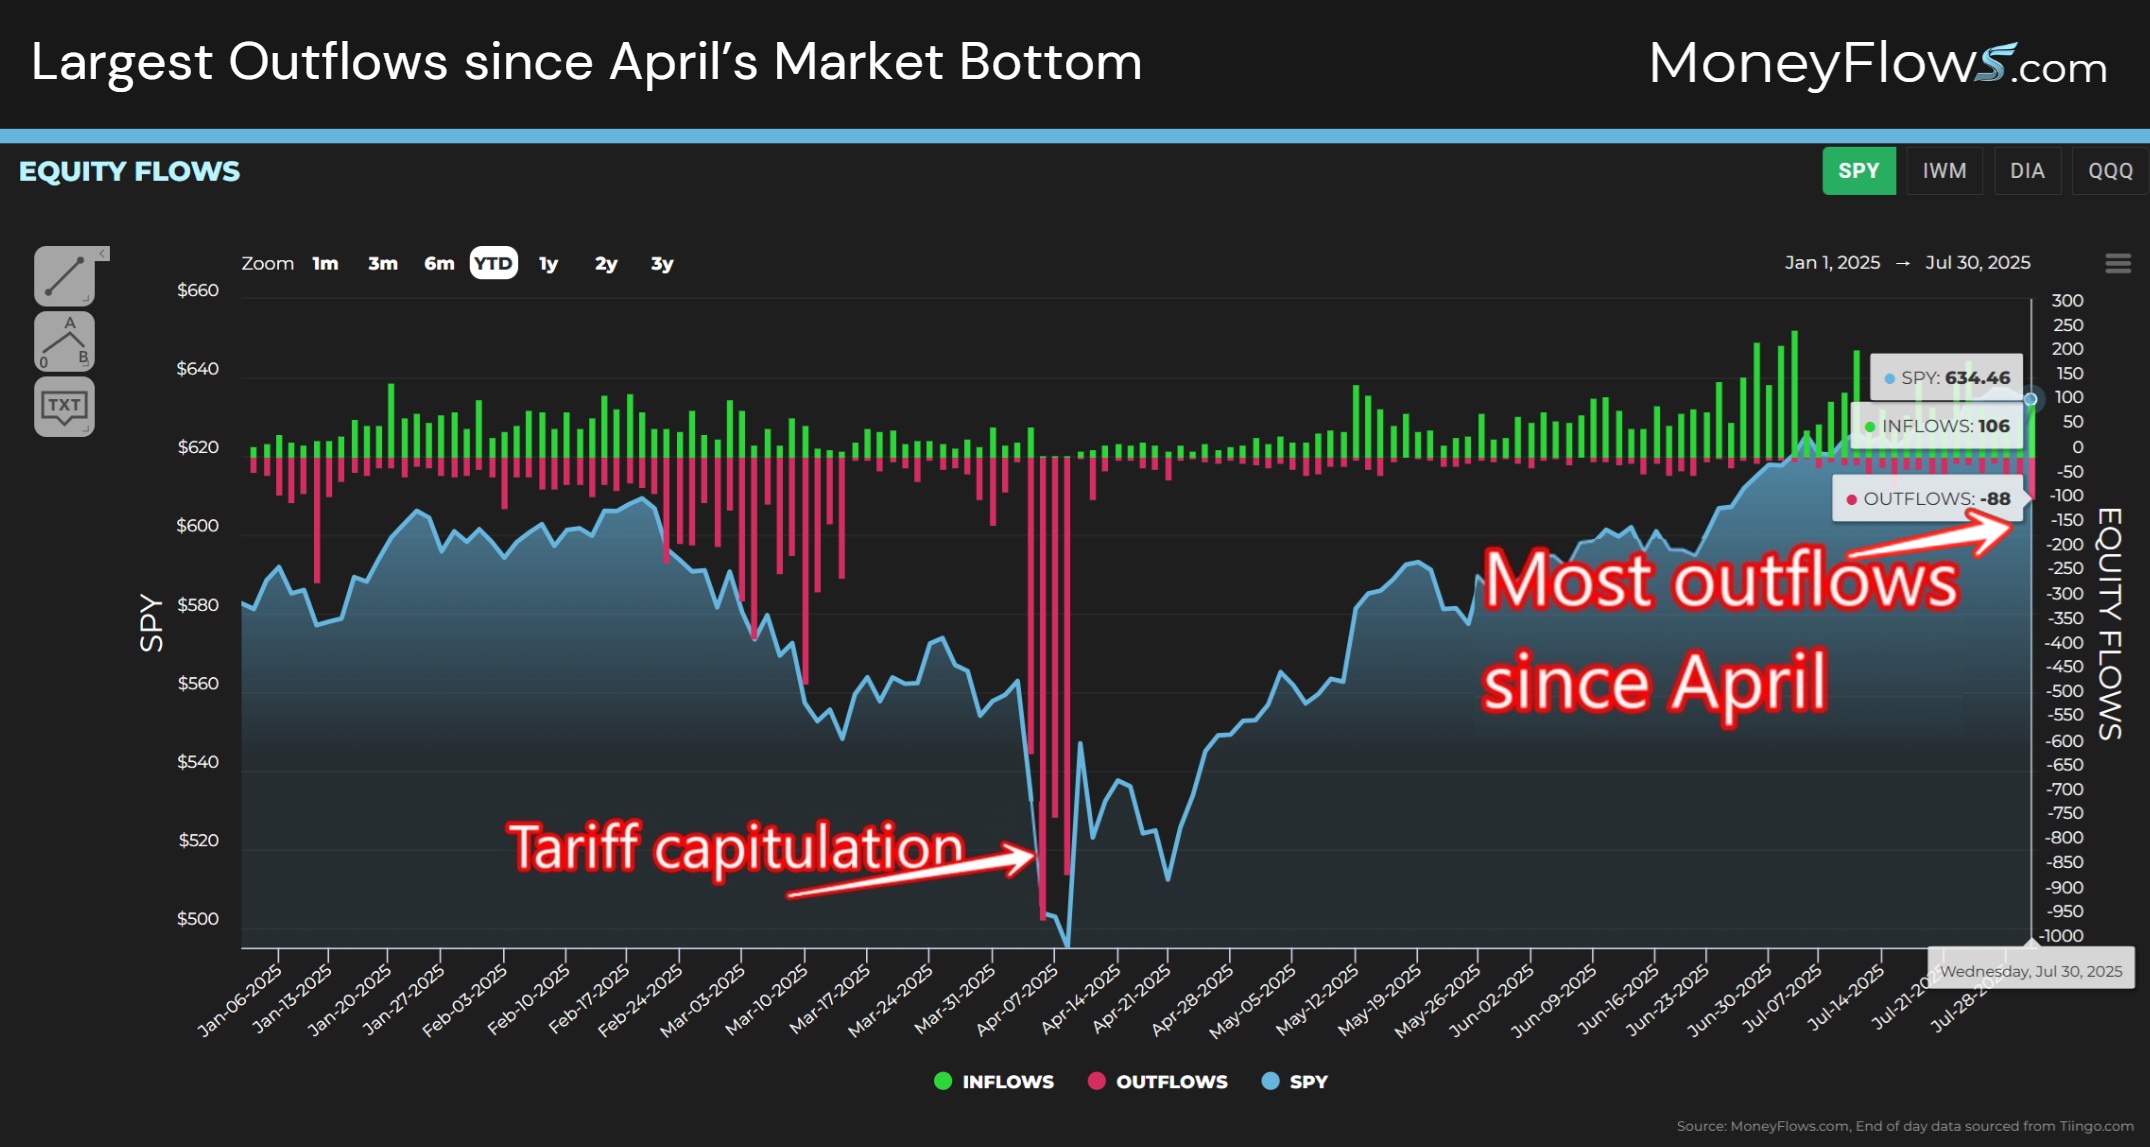
It all boils down to outflows picking up.
Incredibly, yesterday saw the most outflows since the April market bottom! Wednesday clocked 106 inflows and 88 outflows:
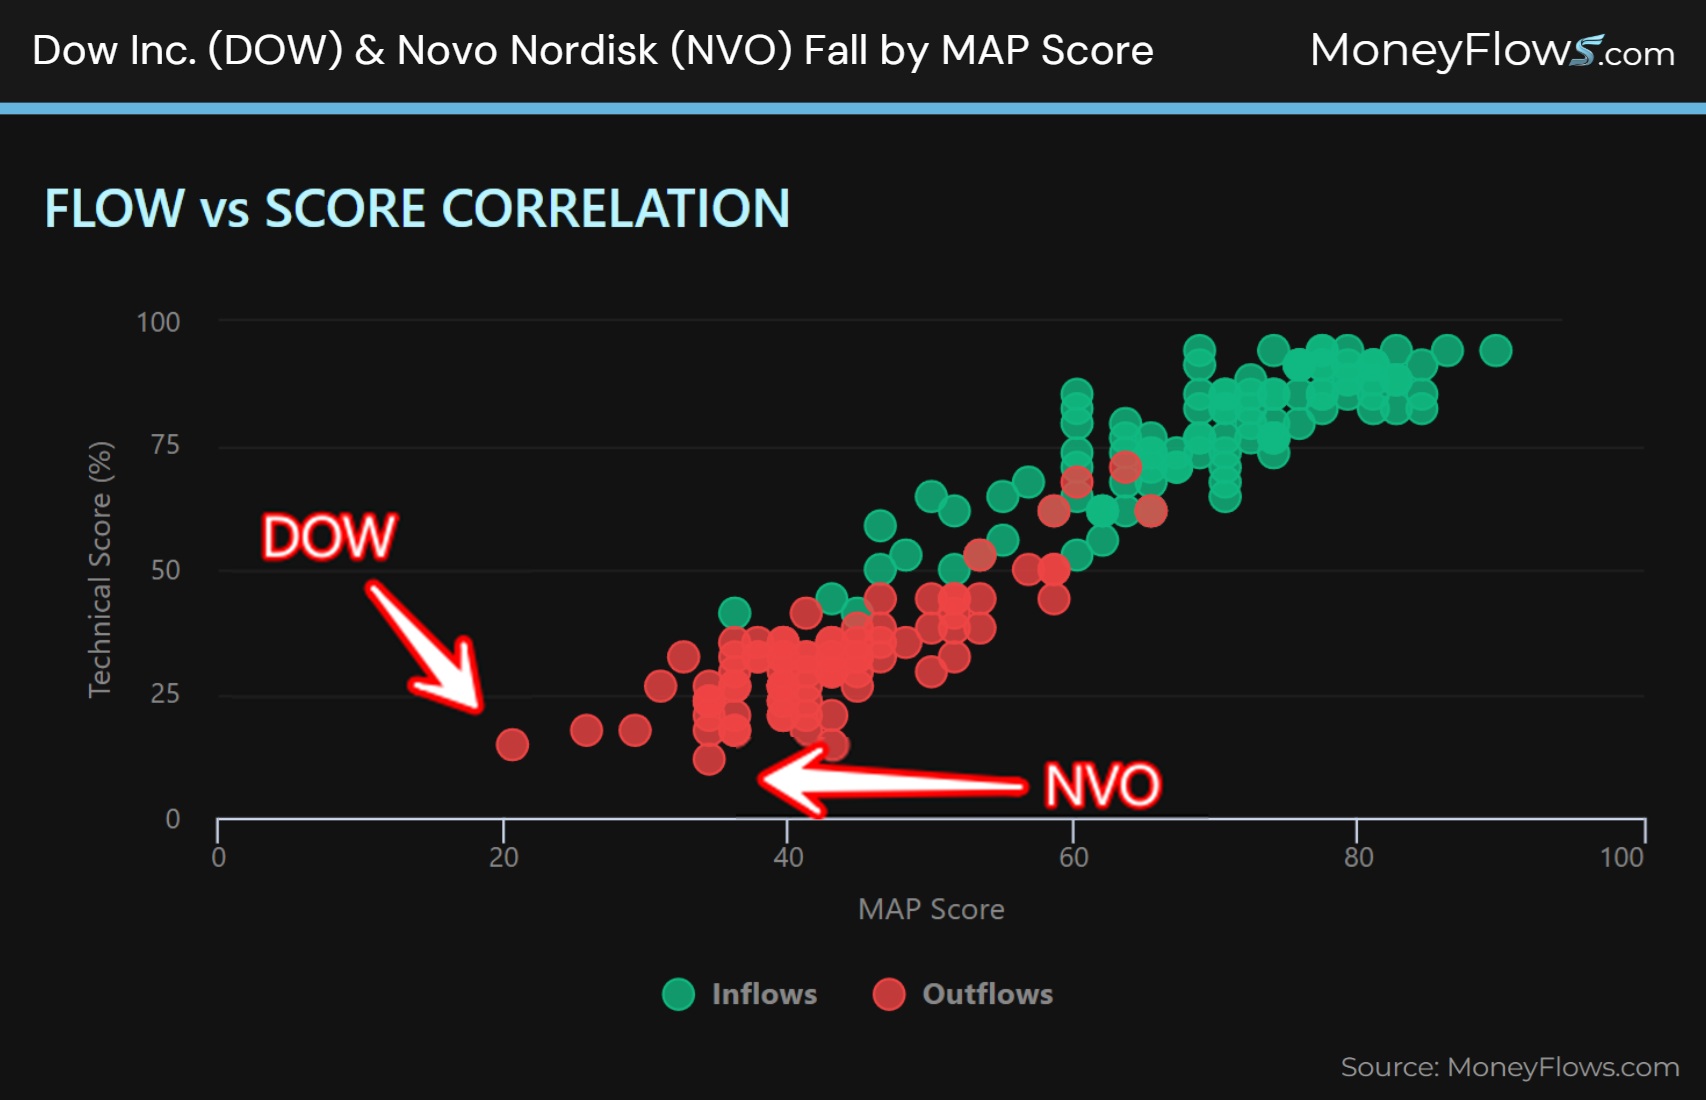
Let’s visualize the recent flows by MAP Score. Here’s yesterday’s snapshot of inflows and outflows.
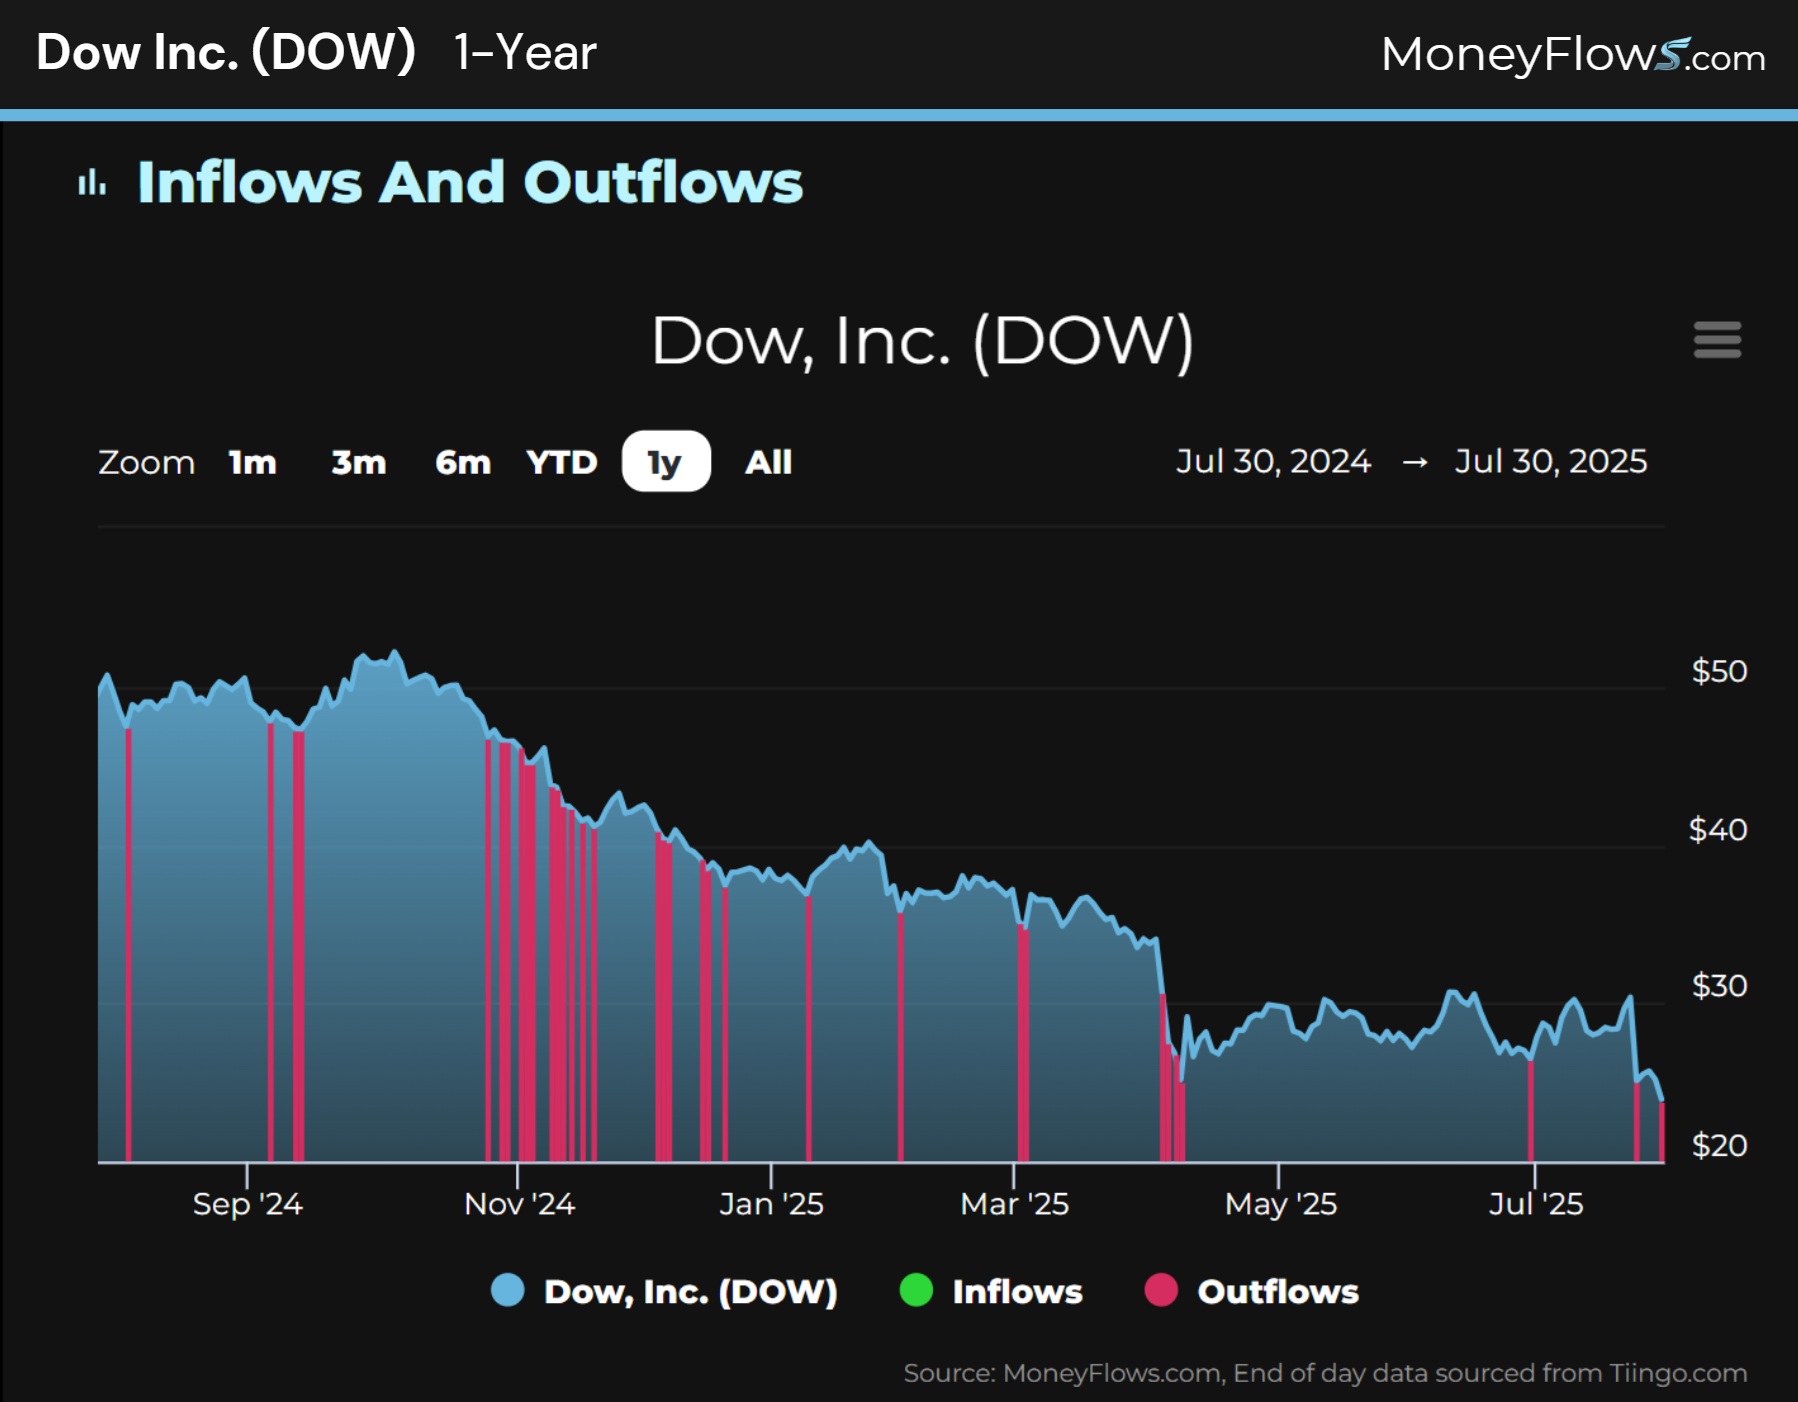
I’ve highlighted Dow Inc. (DOW) and Novo Nordisk (NVO) as falling in the lower threshold of scores:
Here’s the 1-year chart of DOW. It’s been sold hard all year:
Follow the flows!
Now let’s unpack why a fall from overbought tends to spell equity weakness near-term.
Stocks Suffer When Market Breadth is Deteriorating
Two weeks ago, we discussed how stocks are no match for a Big Money Index (BMI) falling out of overbought.
A falling BMI indicates that inflows are slowing, and outflows are growing. That’s what it takes for a healthy cool off period.
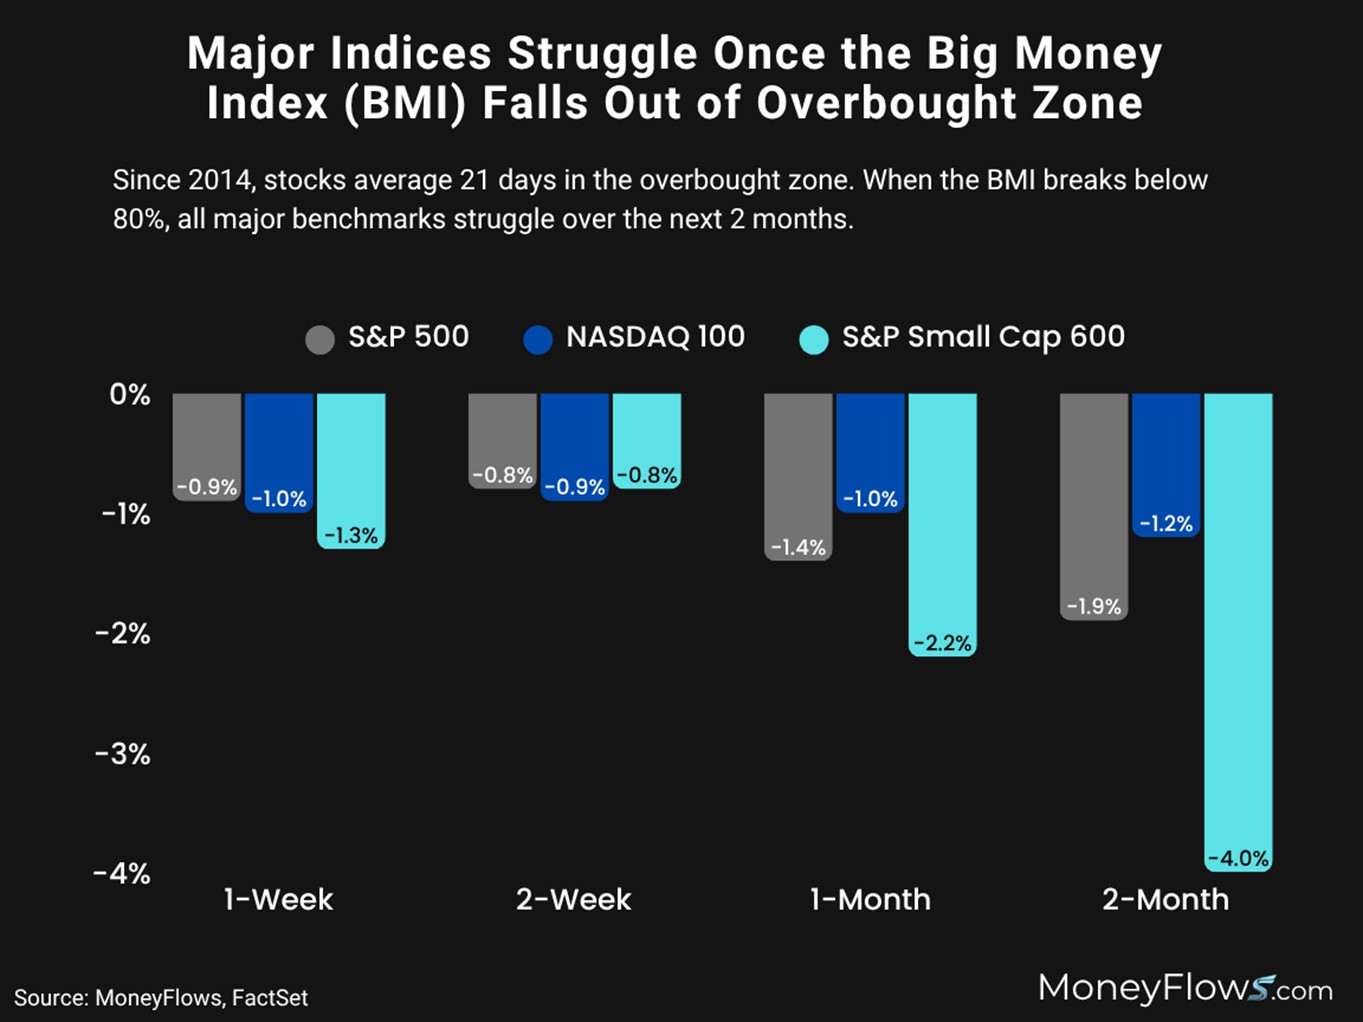
When we plot major index returns post the last day of any overbought BMI, you’ll notice that large and small caps tend to fall.
2-months after the BMI exits the red zone, the S&P 500 falls an average of 1.9%, and the S&P Small Cap 600 falls 4%:
Now, this isn’t the end of the world…
It offers a great opportunity to buy on any potential pullbacks…and we know that August and September tend to show seasonally weak trends.
So, how should you play it?
First, follow the BMI…if it starts to head lower, you’ll know that more stocks are under distribution.
Second, focus on where the outflows are hitting: it could be small caps…it could be healthcare, or energy stocks, etc.
Third, start getting a buy list ready now. Once the tide goes out, you’ll want to be armed with an all-star stock list.
This is where MoneyFlows can help!
We’ll be out front once our data shifts to risk-off. And as we head into the summer months of August and September, now is a great time to upgrade your research.
Get started by becoming a PRO member today. Contact us here for more information, if you’re a money manager wanting portfolio insights.
Market breadth is deteriorating.
MoneyFlows can help you make it an opportunity!