Government Shutdowns and Stock Market Performance
In less than a week, the U.S. government could face a funding gap.
Should investors worry?
Let’s unpack the relationship between government shutdowns and stock market performance.
Let’s face it. There’s always something to worry about with markets.
Wars, interest rates, inflation and more have pressured investor psyche over the years.
Back in April, pundits connected dots on how tariffs would derail global trade and send stocks into a protracted bear market.
We looked at the evidence then and made one of our biggest calls ever to buy stocks.
Being equipped with cold hard data is a weapon during uncertain times.
In that same vein, we’ll look to history for guidance on what to expect during and after government shutdowns.
Odds are you’ll be surprised at the findings.
But first let’s check in on the Big Money Index (BMI) for a gauge on current money flows.
Big Money Index (BMI) Stalls as Outflows Spike
Our market North Star has been chopping around recently as dispersion is seen under the surface.
When the BMI falls, it indicates participation has declined. The latest 74% reading remains in a healthy range:
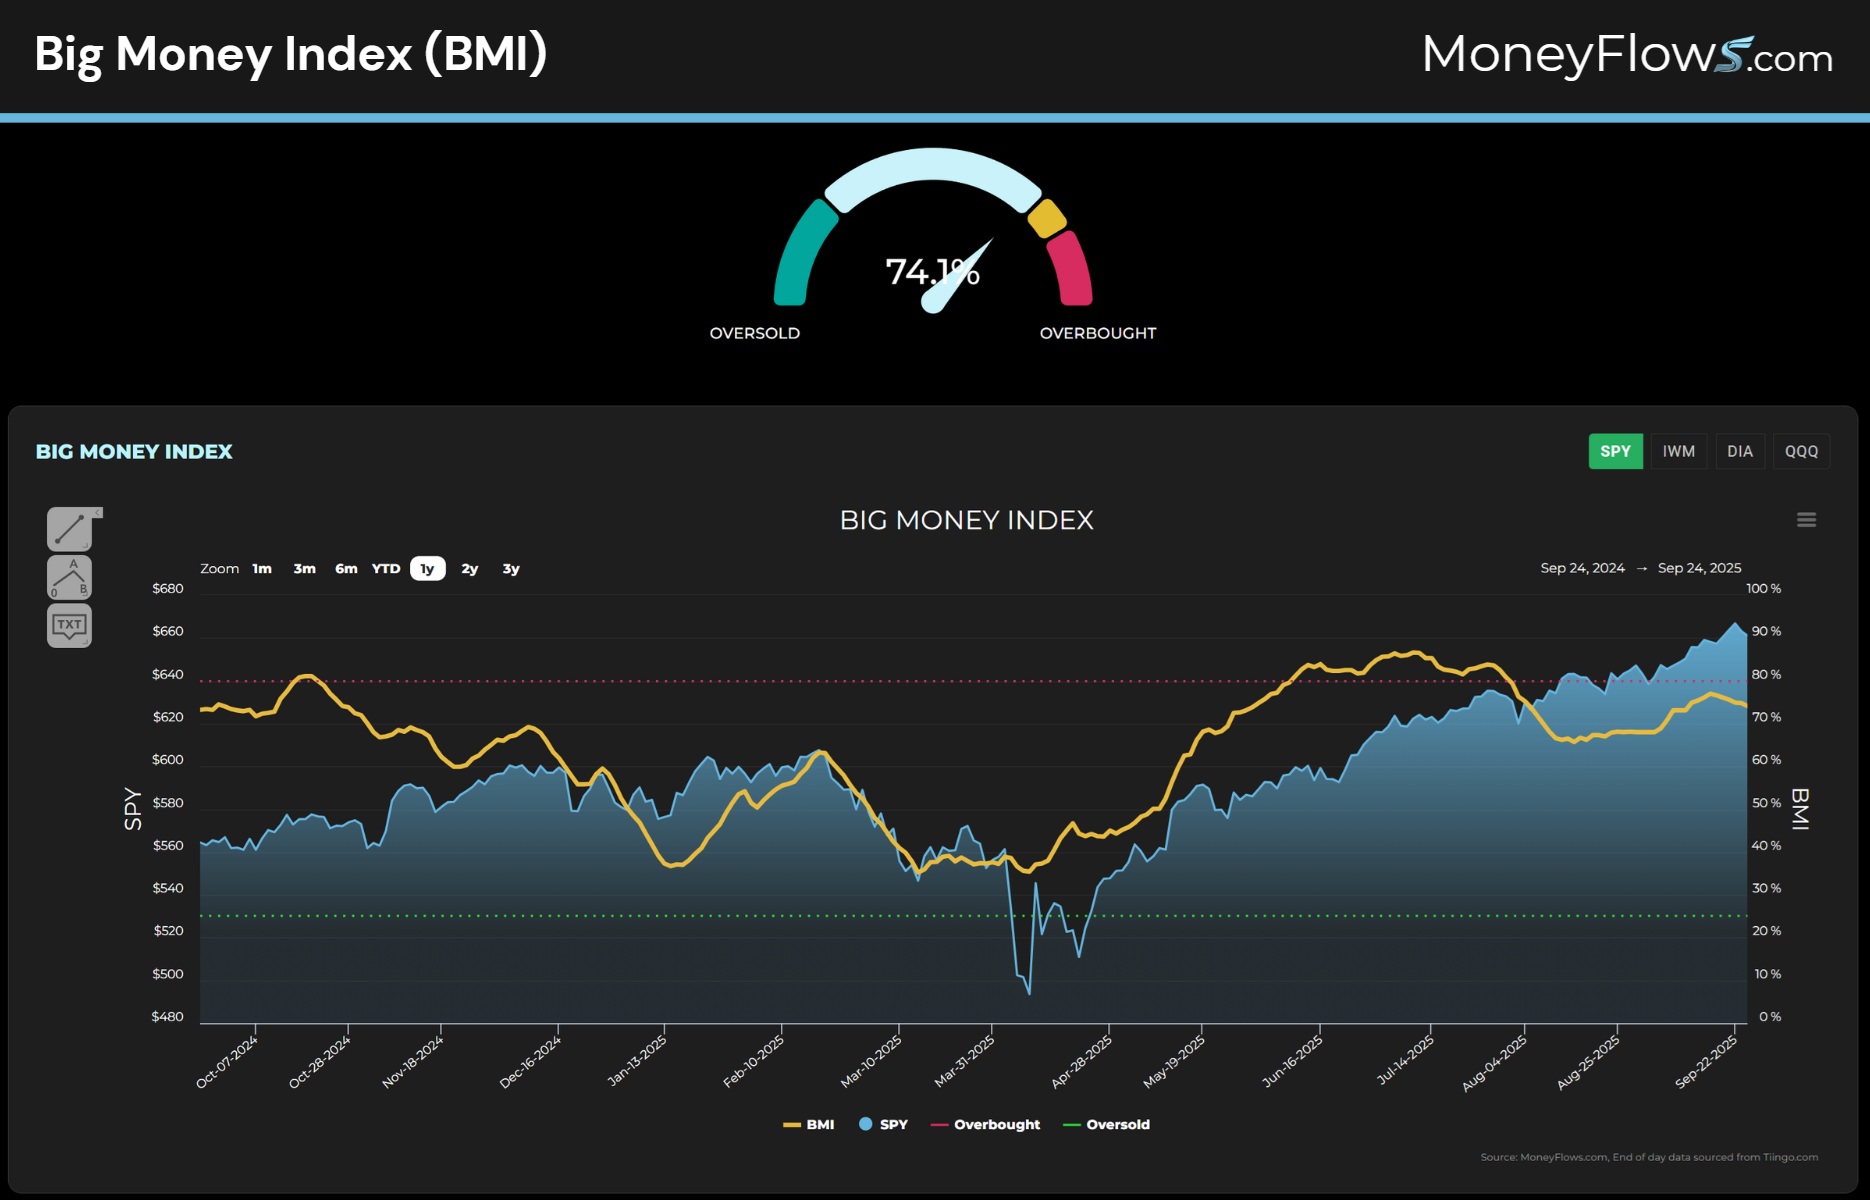
That small downtick highlights a pickup in red.
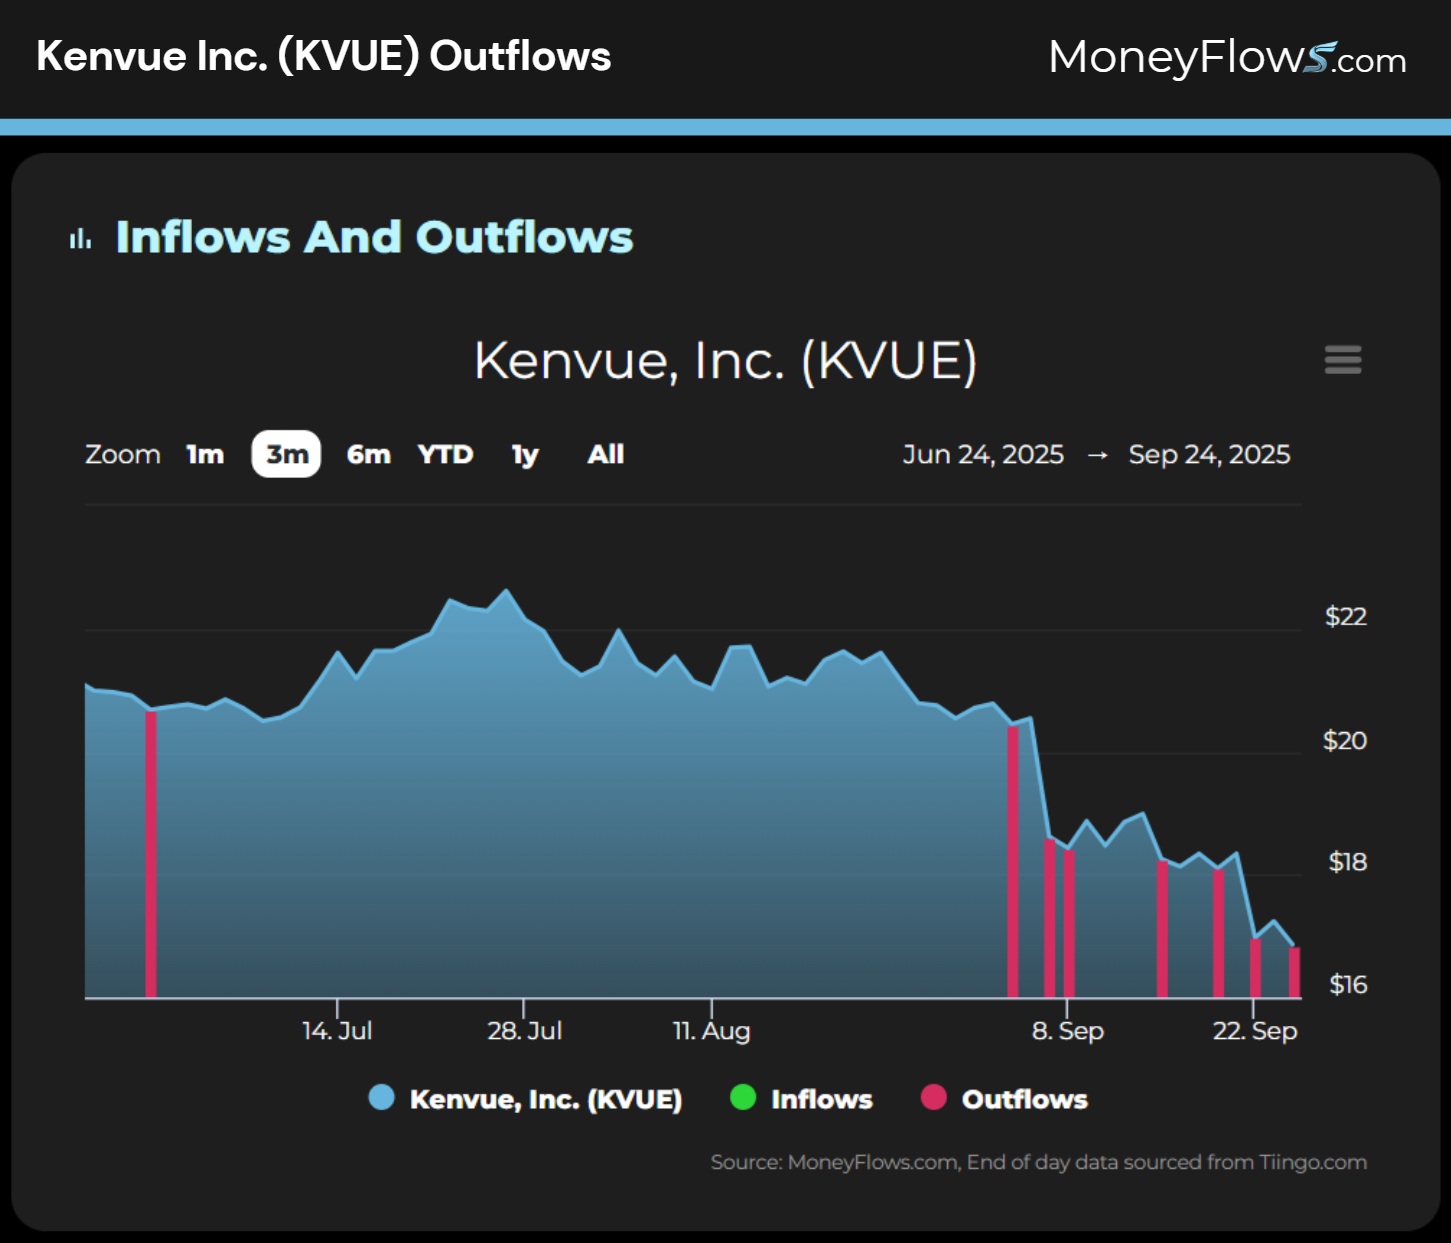
Below you can visualize all of the equity outflows this week relative to inflows. I’ve singled out Kenvue (KVUE) as a ticker under relentless pressure:
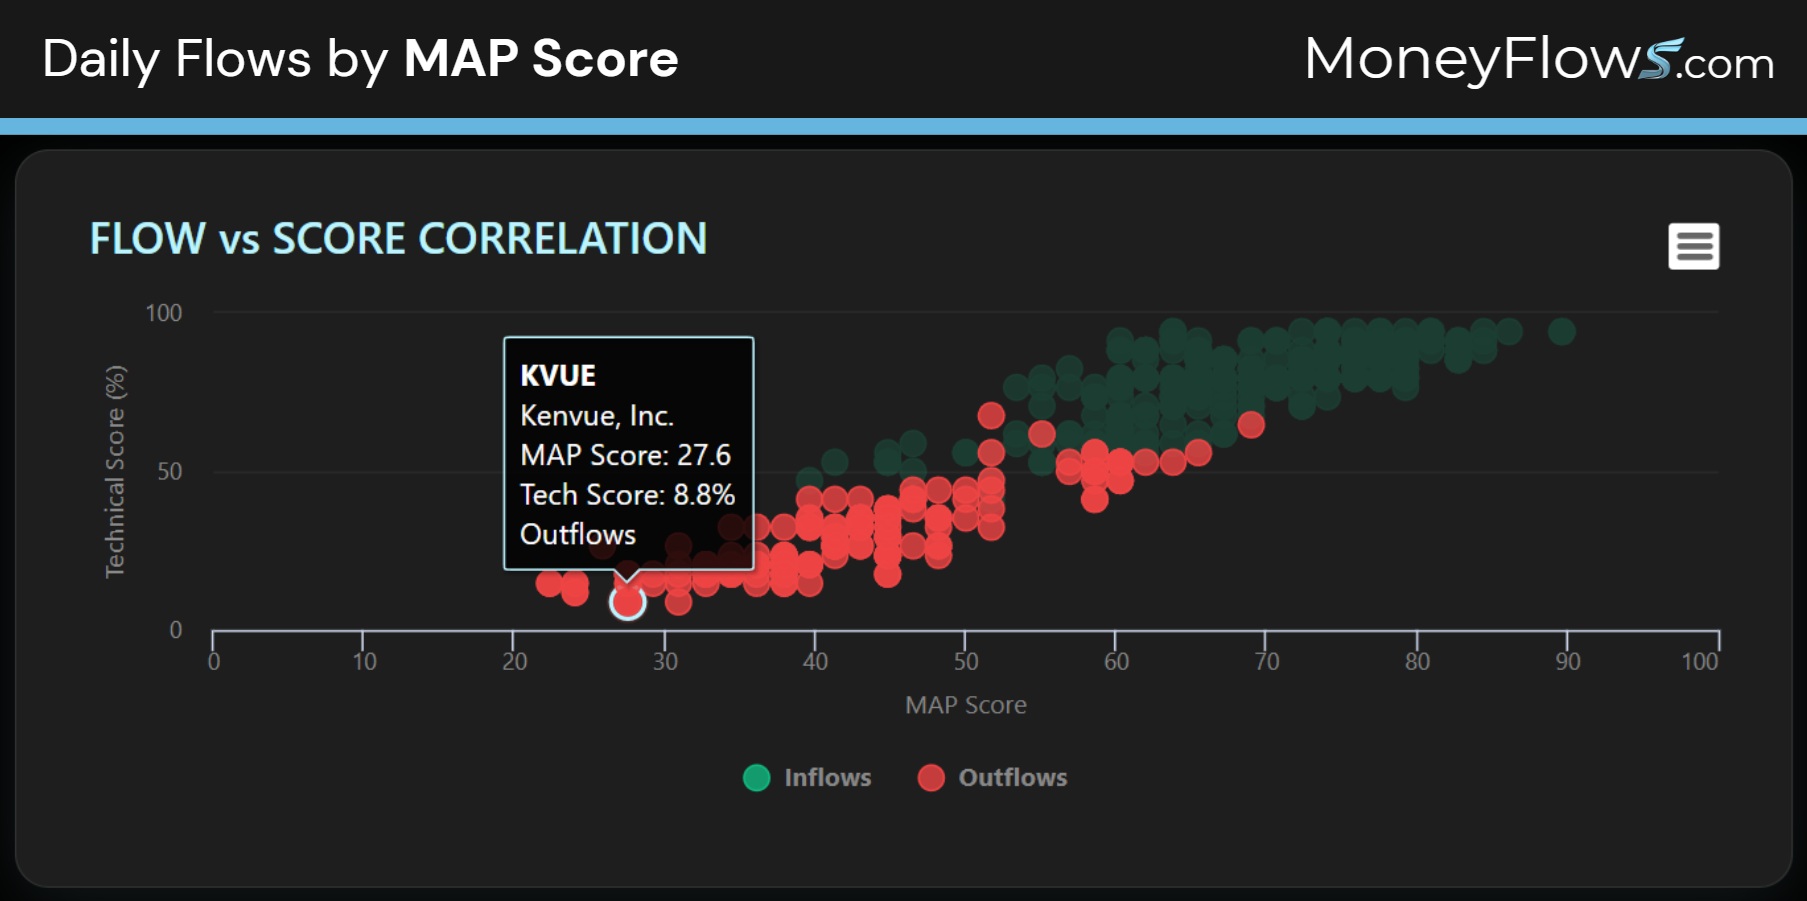
This selloff has been in place for months. The latest Tylenol controversy has added further pressure to the shares:
Idiosyncratic stories have caused more stocks to reach the sell-block recently.
And the latest headline worry is the Federal funding gap.
Let’s now size up this latest worry.
Government Shutdowns and Stock Market Performance
Back to late 1978, we located 16 government shutdowns.
Looking at recent history, I’ve plotted the last 3 government shutdowns over the S&P 500:
- September 30, 2013
- January 19, 2018
- December 21, 2018
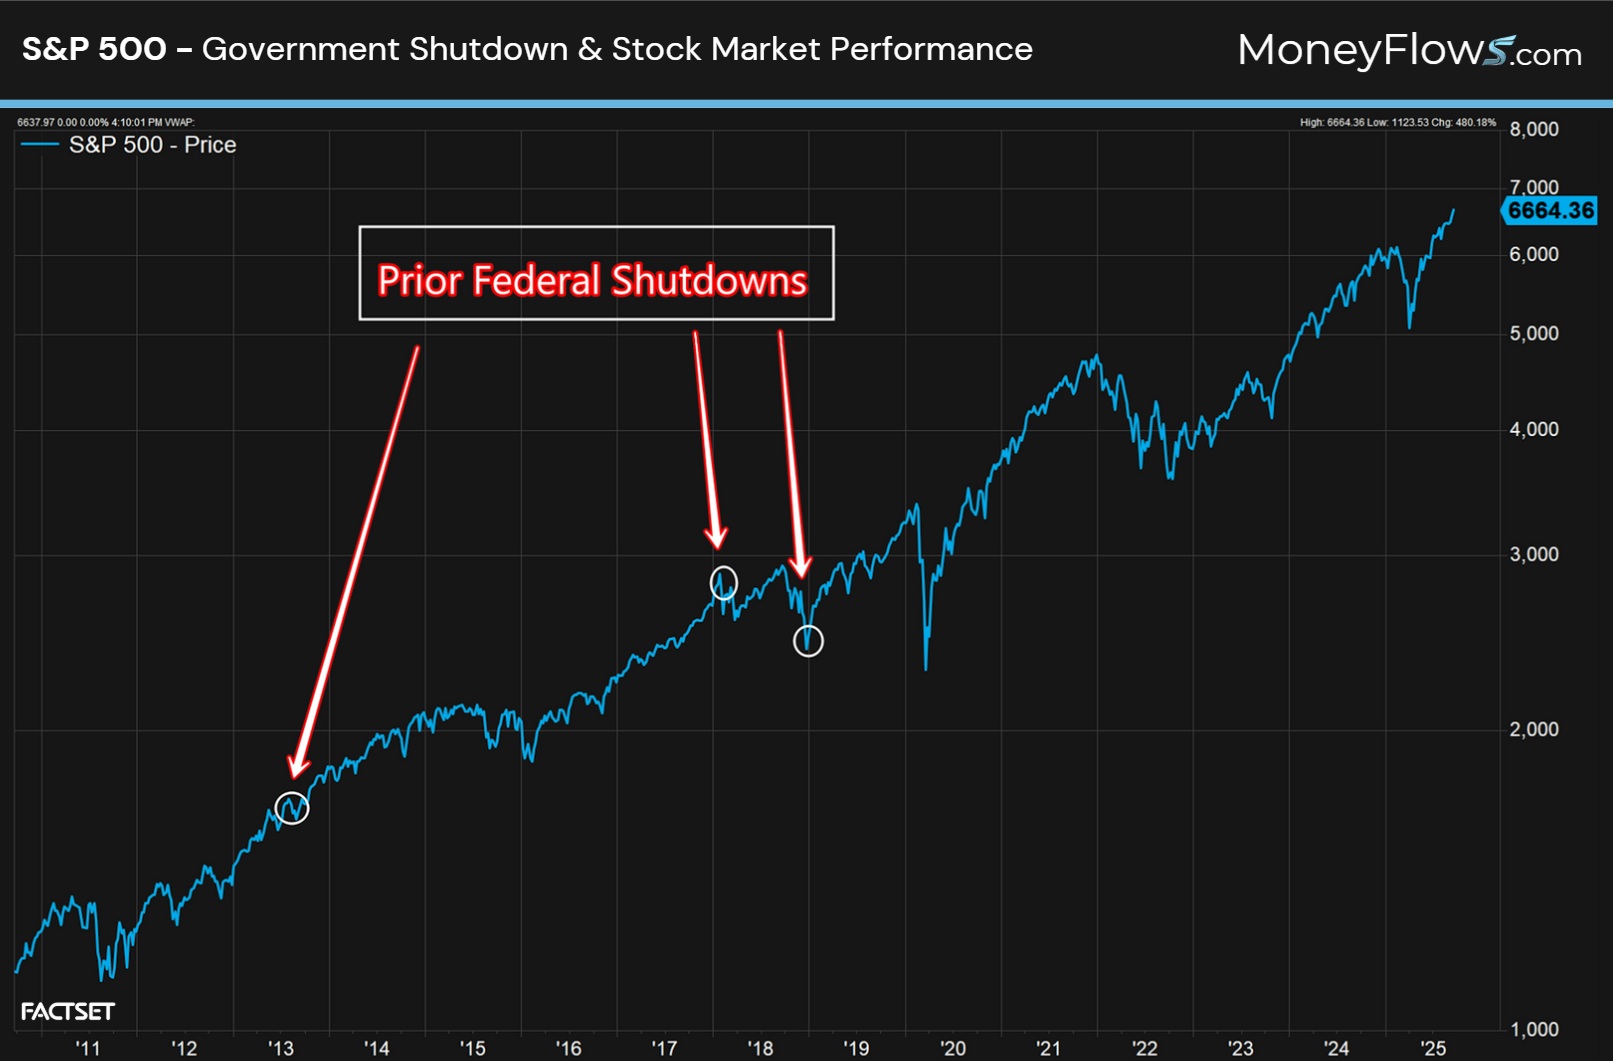
Now to the naked eye, it appears that these brief moments in history haven’t meant the end of the world.
And that’s correct!
In fact, government shutdowns have been a rather bullish setup. Let me explain.
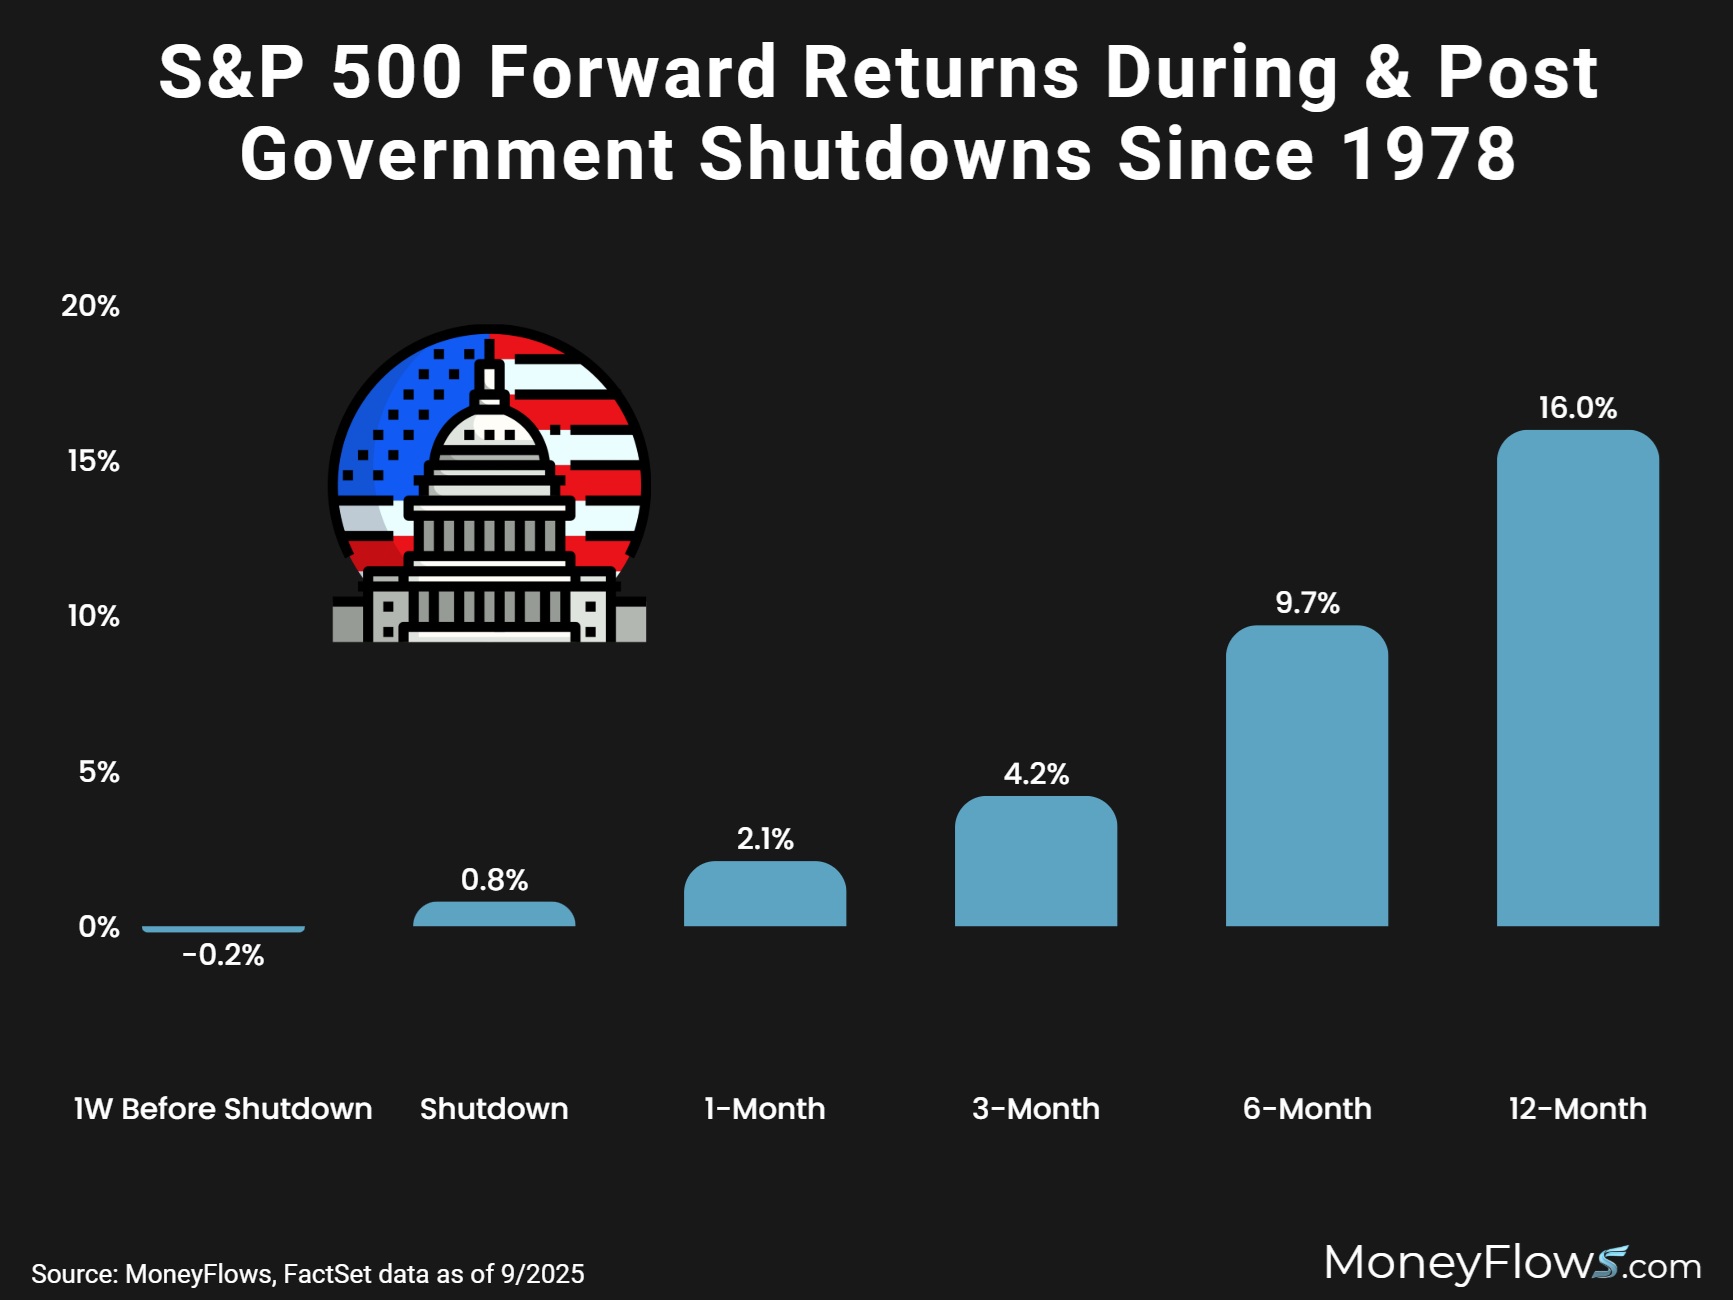
Since 1978, here’s how the S&P 500 has performed during and after a government shutdown:
- The average time during a shutdown is 12.5 days. Stocks return an average .8% gain during the actual shutdown
- 1-month post a shutdown stocks gain 2.1% on average
- 3-months later markets jump 4.2%
- 6-months later equities climb 9.7%
- 12-months later stocks gained 15 out of 16 times with average gains of 16%
Additionally, I’ve included how stocks perform one week heading into a shutdown. Stocks on average have suffered -.2%:
If you’re skittish right now, don’t let it be because of a federal funding gap. Historically it’s been a great time to buy any pre-shutdown selloffs.
Just make sure you’re betting on stocks loved by institutions and growing their sales and earnings.
Those are the types of stocks that are thriving in 2025.
Our process not only scores thousands of stocks each day, but we showcase the best of breed. Those are the outliers all over our research reports week after week.
We find outlier stocks early that are not on the lips of the media…like Agnico Eagle Mines (AEM) and Sportrader (SRAD).
Become a PRO member today to up your research as we head into yearend.
If you’re a money manager, our Advisor solution offers portfolio analytics and ETF flows.
Keep it simple.
Go with the flows!
***Lastly, Oct. 16th -18th, join co-founder Jason Bodner LIVE in Orlando at the MoneyShow TradersExpo as he presents: Using MoneyFlows to Identify Winning Investments.
Click the image below to register now. You don’t want to miss this!