
Forced Flows and the Blowoff Top
The crowd is finally in agreement.
Investing in stocks is a great idea.
This has the potential to ignite forced flows and a blowoff top.
It’s simple. The biggest returns come from buying when the crowd is most fearful.
At the market low on April 10th, I gave a presentation suggesting a breath-taking rally is ahead.
You can review most of the slides from that presentation here.
I didn’t make that bold claim using feelings. That conclusion arrived through evidence and past experiences.
At MoneyFlows, we’ve seen forced selling many times. Those rare capitulation events tee up massive crowd-stunning rallies…like we’re witnessing today.
The 6.2% gain for the S&P 500 in the month of May is the best in 35 years…and it isn’t a fluke.
Monster Mays occur after nasty macro events…and they preface more gains ahead.
Today, I’m making the case that the party isn’t over just yet. I believe an epic blowoff top could be around the corner.
If I’m right, forced buying will send stocks soaring, followed by a healthy pullback.
And we’re introducing a brand-new signal that will alert members when the blowoff top triggers.
Let’s unpack why you need to prepare, now.
S&P 500 Gains 6.2% in May, Signals More Gains Near-term
The popular Wall Street adage to sell in May and go away was flipped in 2025.
Stocks zoomed last month with the S&P 500 jumping over 6%, its best May performance going back to 1990:
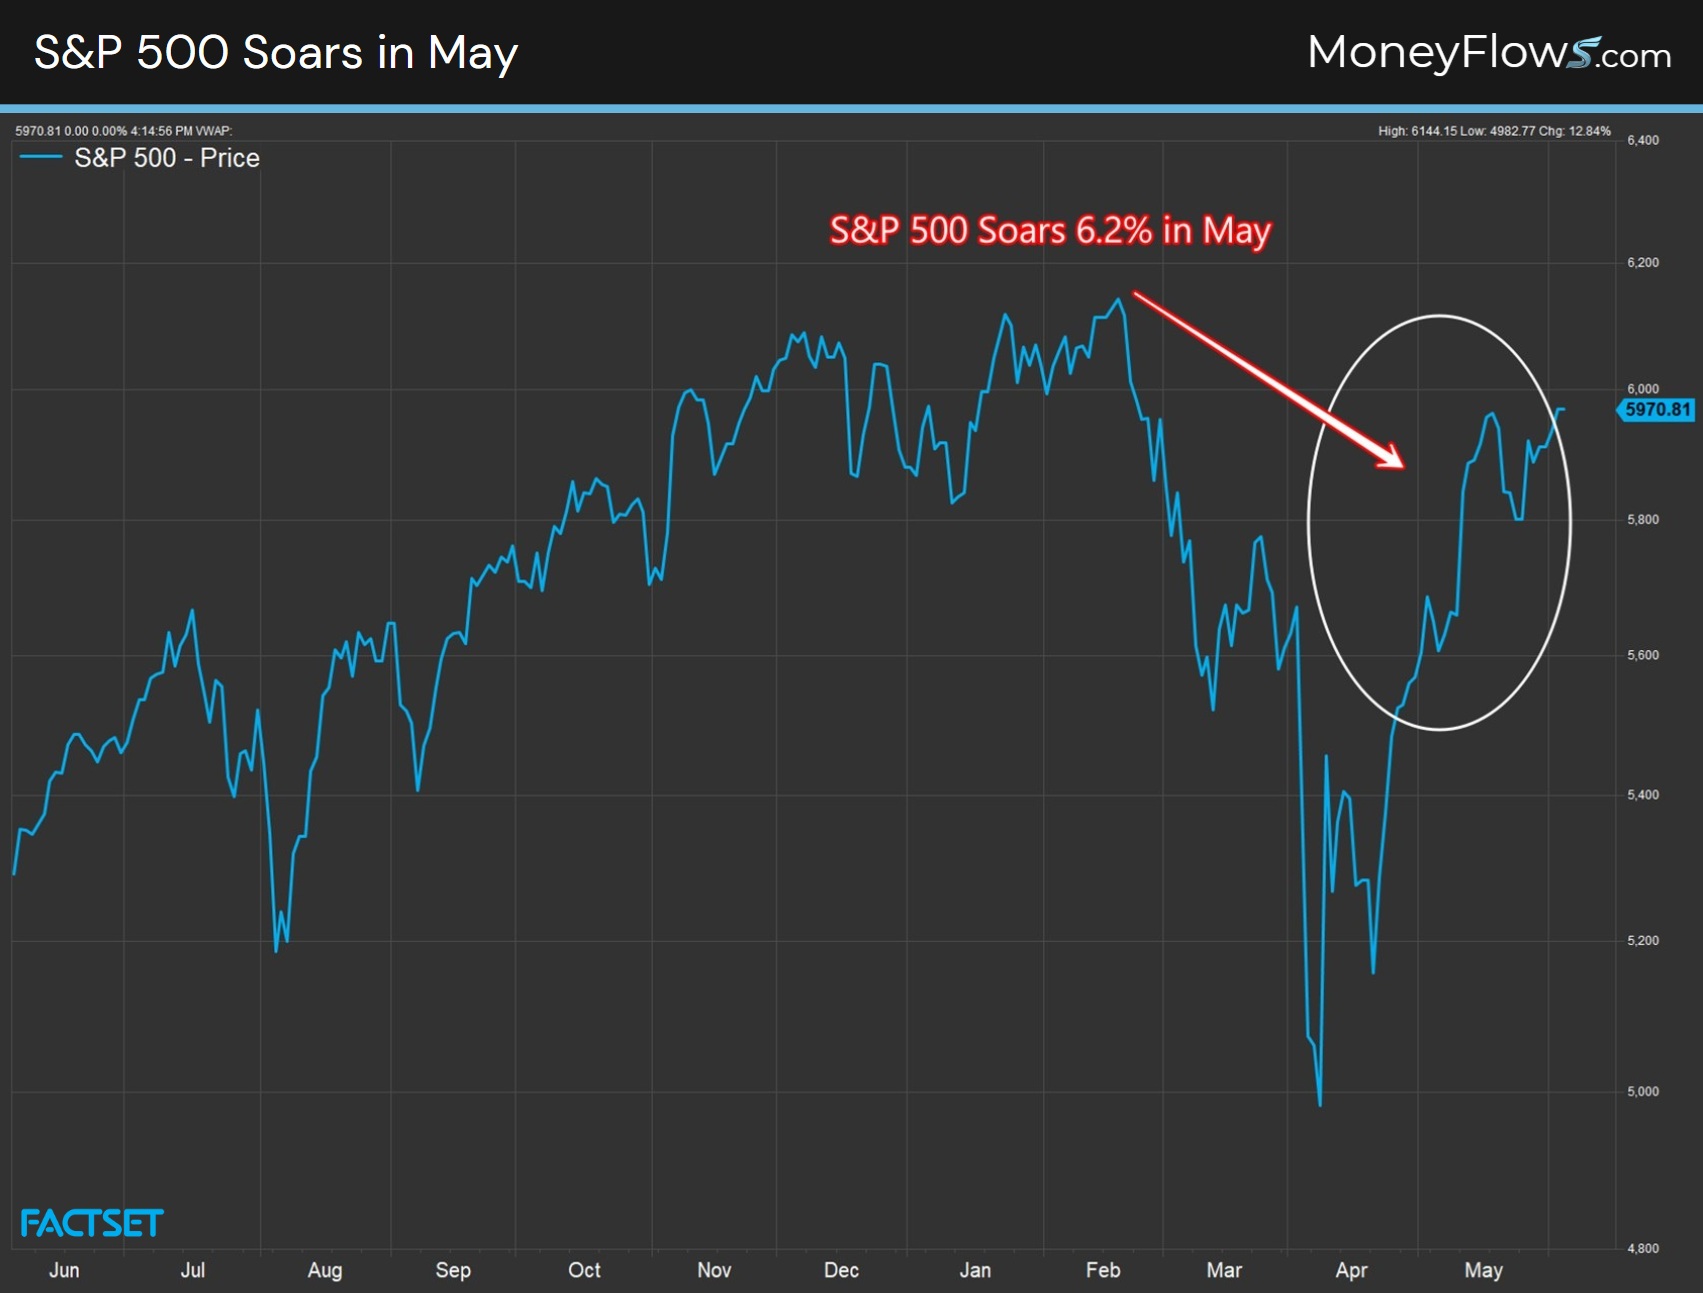
Conventional wisdom could have you believe it’s time to lock in profits. Not so fast…
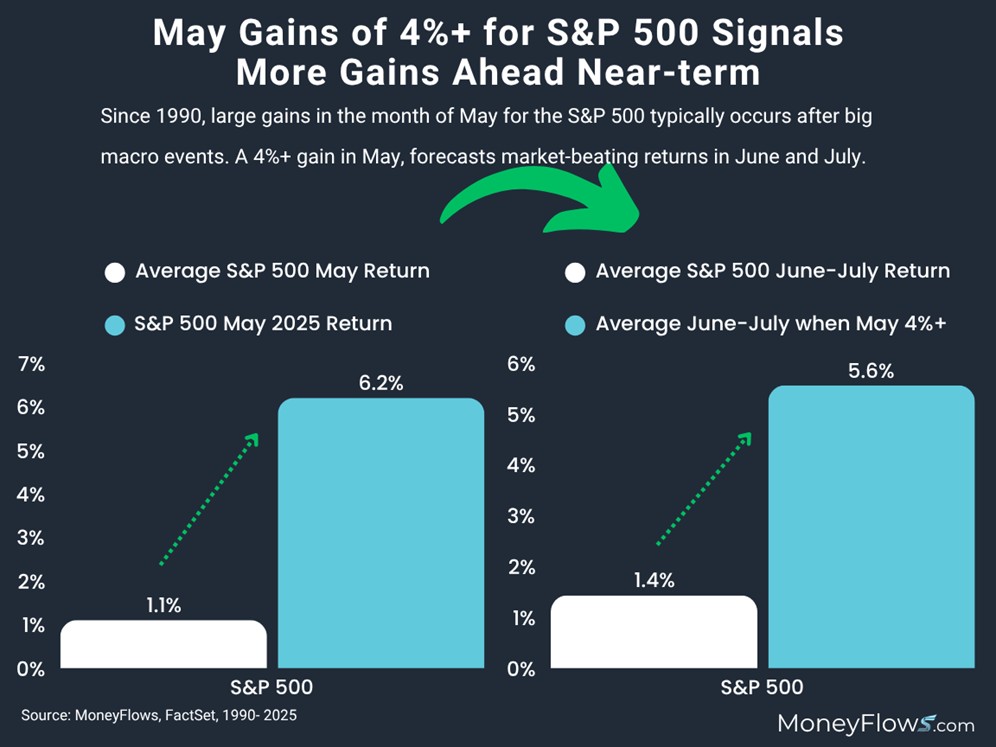
When you study history, you learn a couple of things about big outlier May returns:
- First, power-thrust Mays tend to arrive after a big macro quake
- Second, they forecast market-beating gains in the following months
Let’s focus on the former. Back to 1990, the S&P 500 gained 4%+ on just 6 occasions.
The last 3 instances include: 2009 just after the GFC, 2020 just after the COVID-19 crash, and 2024 when investors realized the sure-to-come recession didn’t materialize.
But here’s the juicy truth.
When the S&P 500 gains 4% or more in the month of May, the following June and July gain an average of 5.6%, much greater than the typical June and July average of gain of 1.4% for all periods:
Enjoy the ride folks.
Now let’s take a deeper look at why I see a blowoff top as a possibility.
Forced Flows and the Blowoff Top
You need to look backwards to see the future.
It’s important to understand where we were, where we are, and where we are going.
First, let’s cover where we were just 2 months ago.
In early April, most pundits were telling you that tariffs were going to upend global trade, send inflation surging, and wreck the economy.
We were telling you why it was a good idea to buy into the fear.
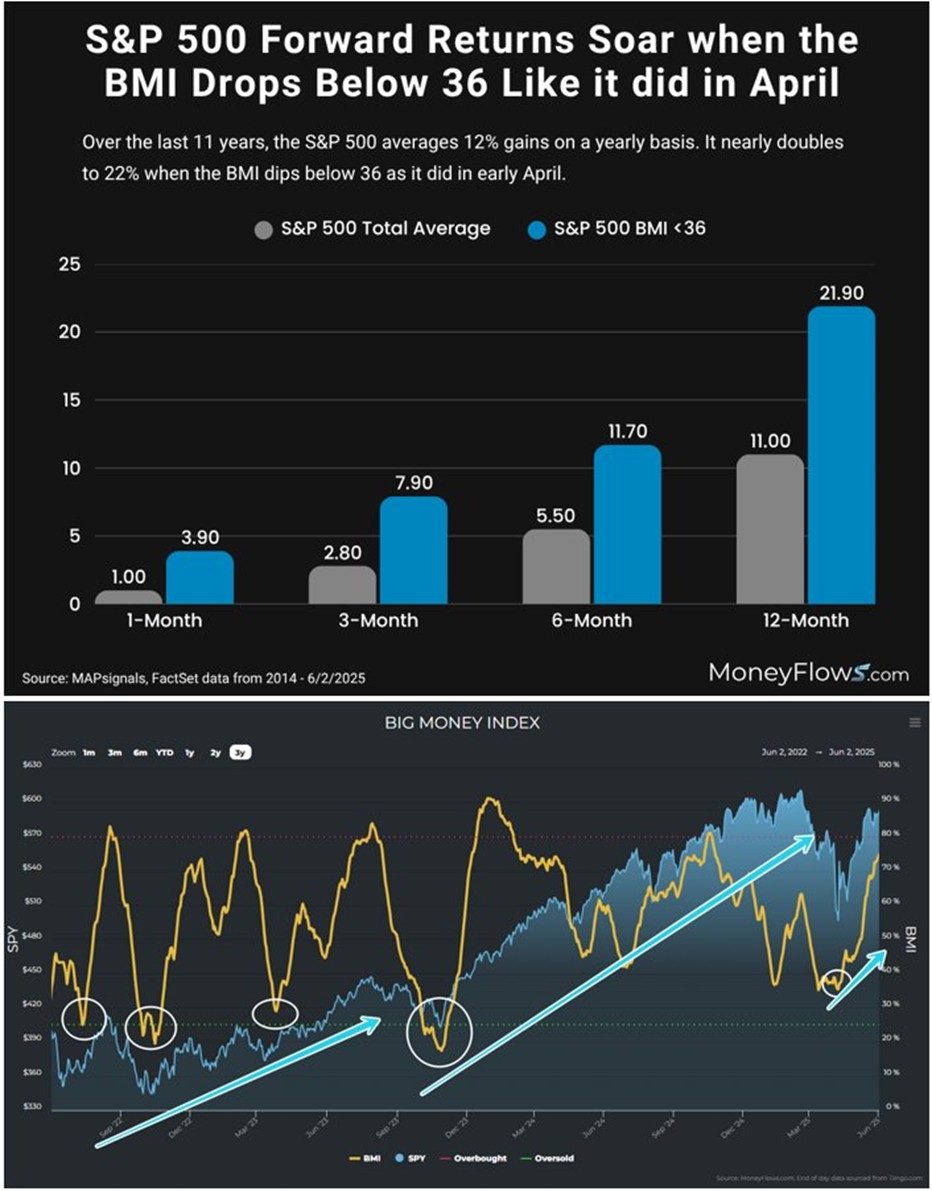
Money was coming out of stocks violently. The Big Money Index (BMI) fell below 36. If you are stunned at the latest equity rally, don’t be.
Since 2014, when the BMI falls below 36 like it did during the Tariff crash, stocks soar.
Below showcases the forward returns of all periods of the S&P 500 vs periods when the BMI is below 36.
It’s clear. The lower the BMI falls, the bigger the forward expectation for stocks:
Now where are we today?
We are approaching the overbought zone. At the latest measure, the BMI is overheated at 75%:
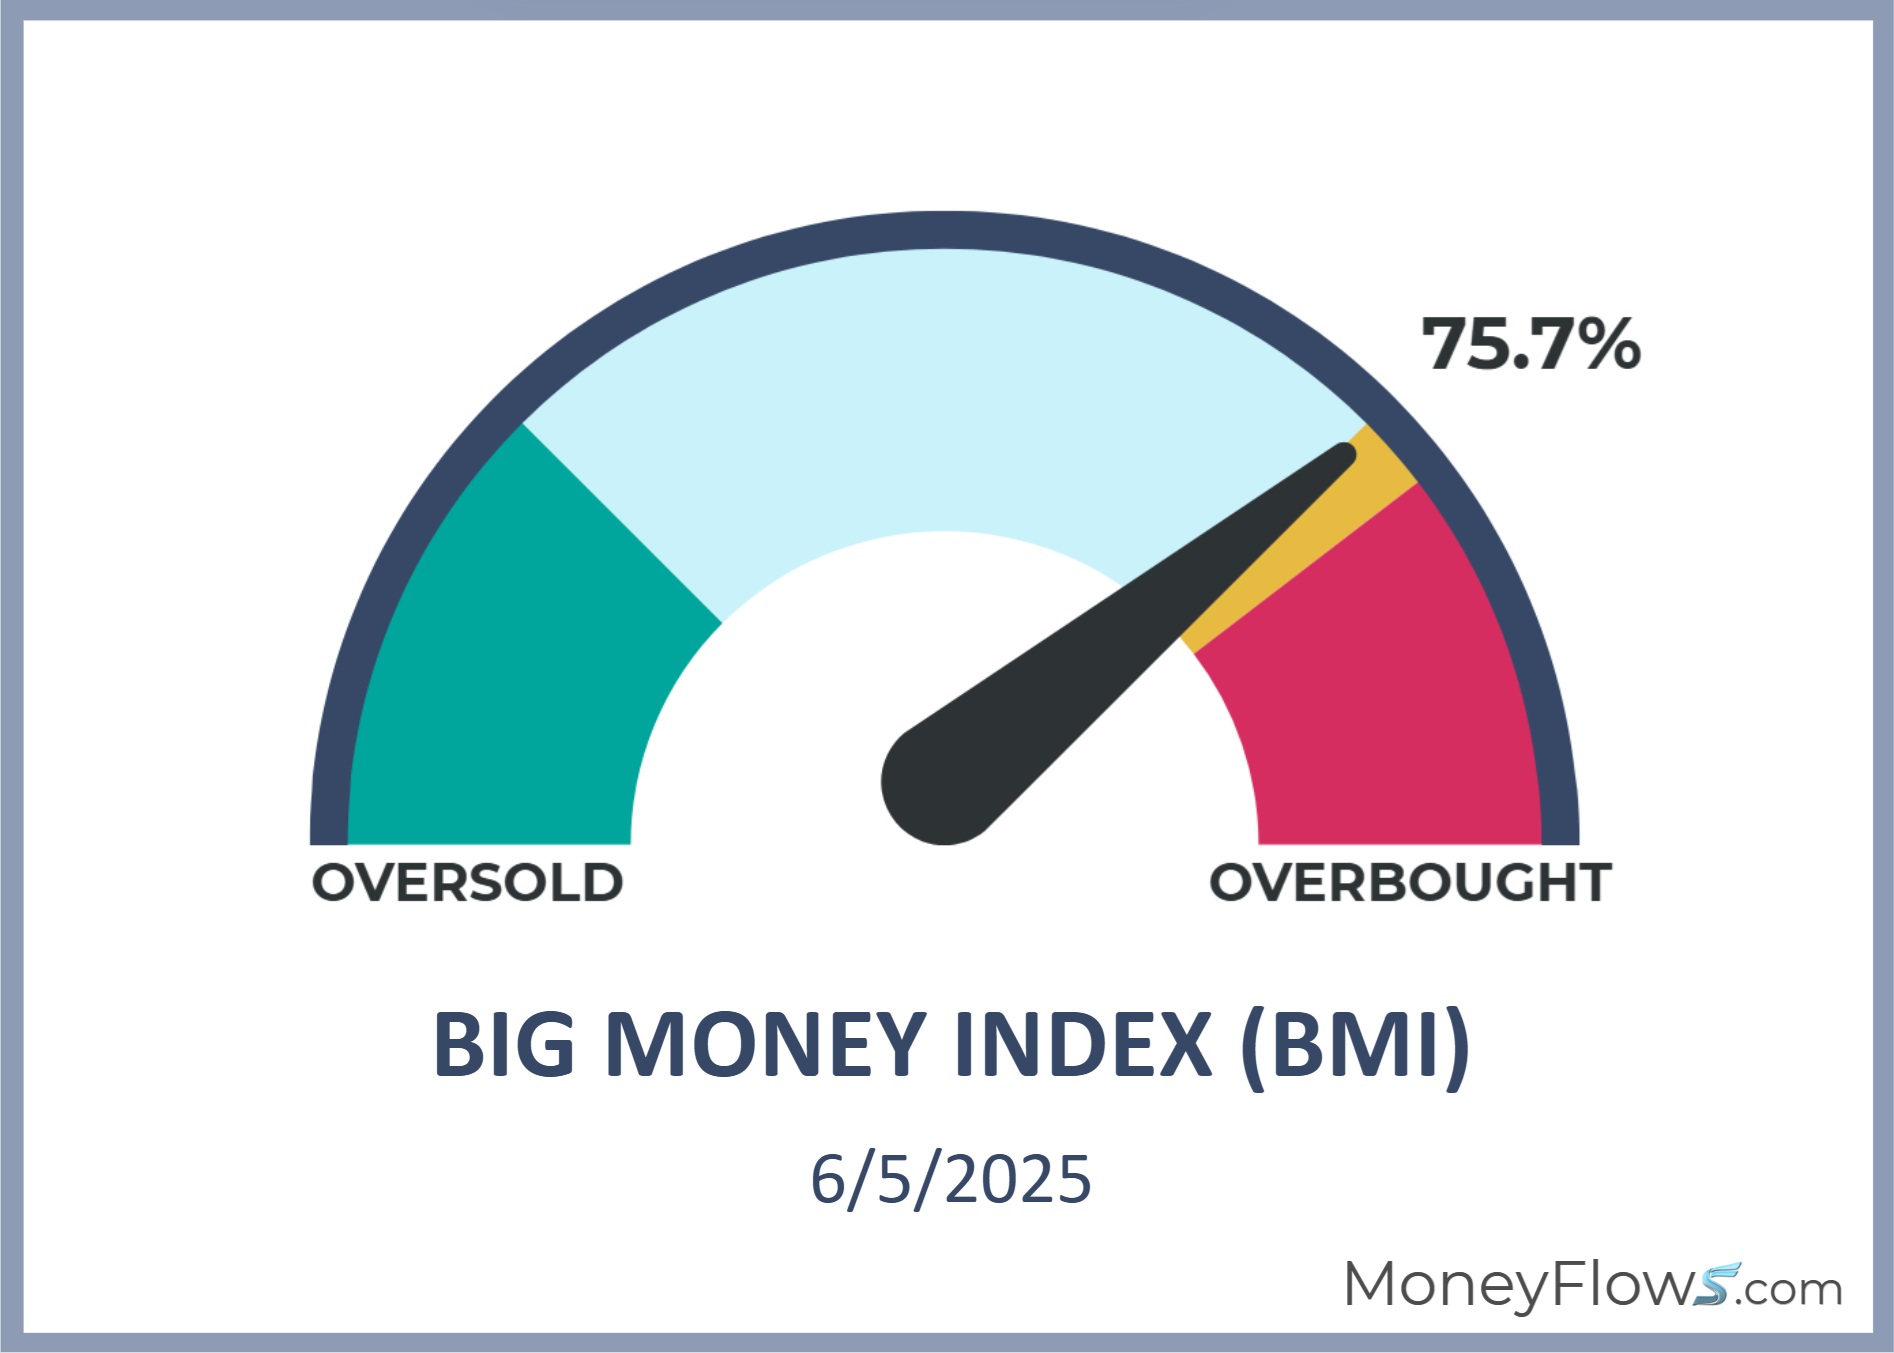
Last week I told you to prepare for extreme overbought conditions. After forced-selling events like early April, violent risk-on periods follow and hang around for a while.
To understand where we are going, let’s review our equity flows chart. This is how we’ll spot a blowoff top.
Below is our Equity Flows chart. Off to the right I’ve circled today’s action given it’s a healthy amount of money chasing stocks.
Off to the left we see large green waves of unstainable inflows…those are unhealthy forced buying periods, indicating blowoff tops:
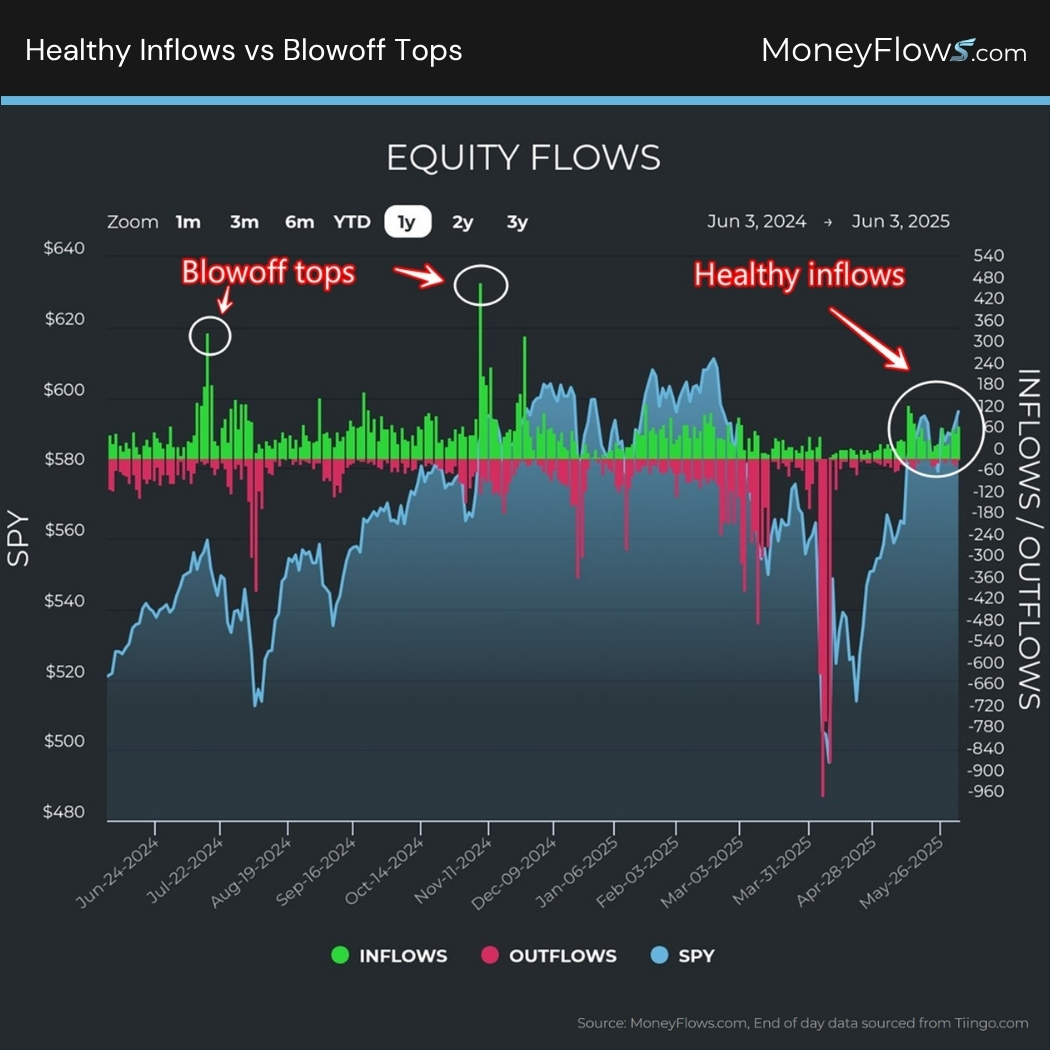
Folks, these blowoff tops are rare and are defined as 400+ inflows in a single session.
We call these discrete blowoff tops as Forced Flow Triggers (FFT). Below shows you the last 3 times we saw these forced buying episodes:
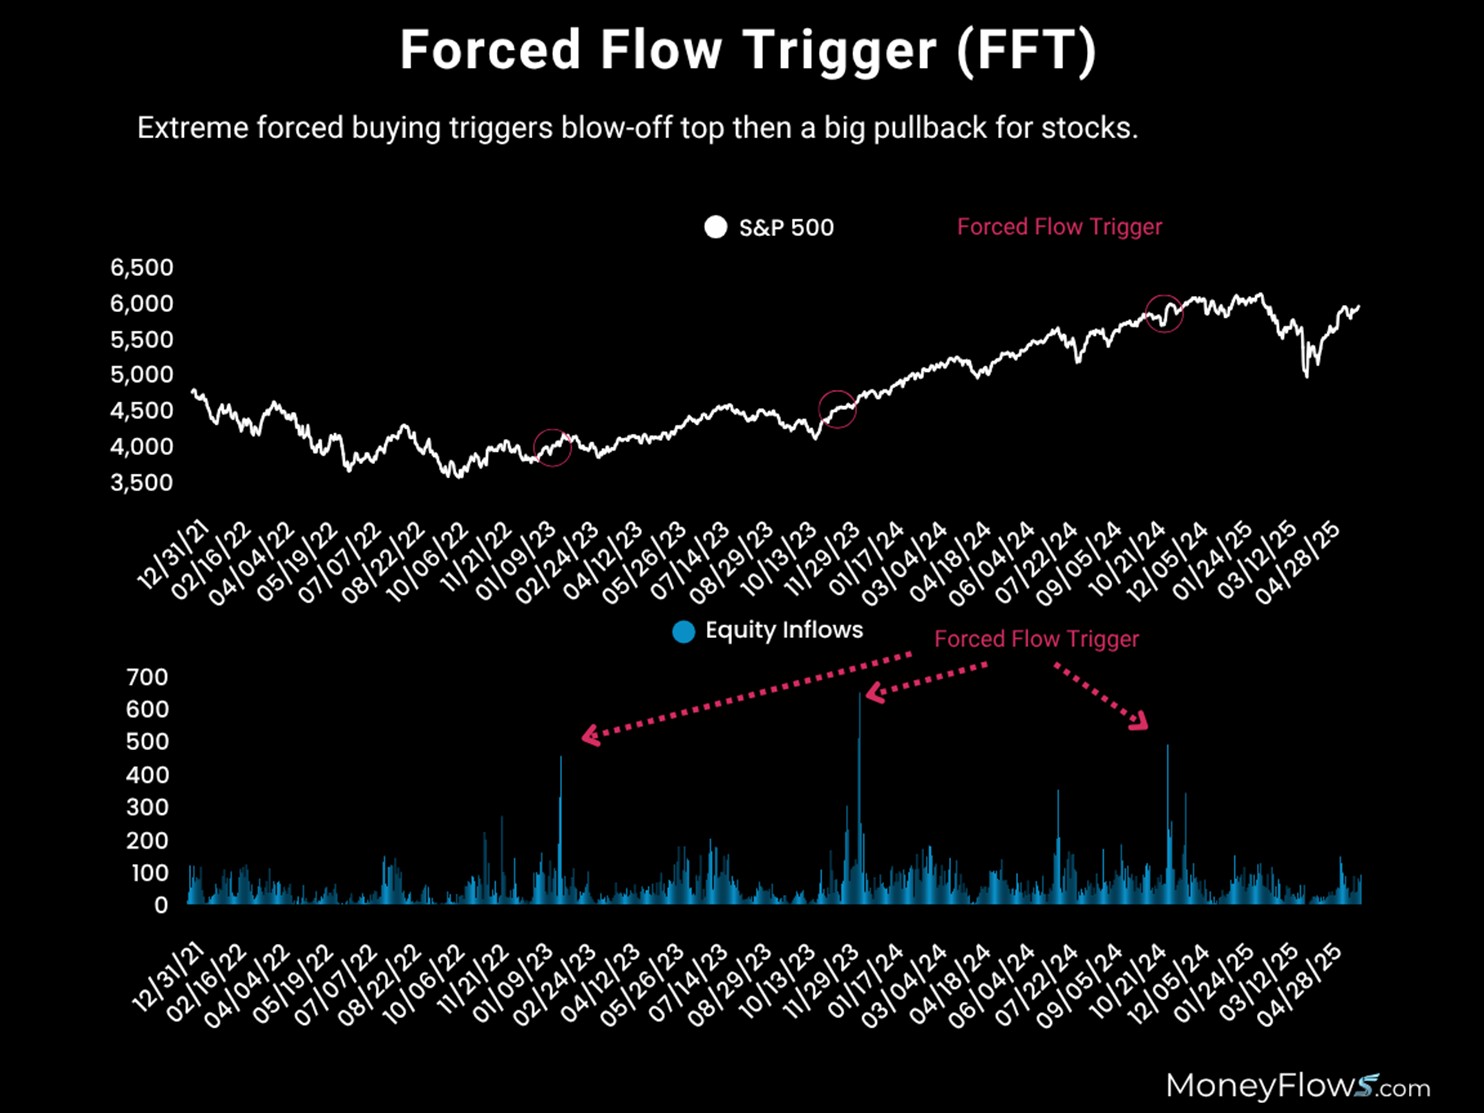
To the naked eye, it may not appear like a market event, but it is.
What happens to before and after a Forced Flow Trigger is important to understand…and prepare!
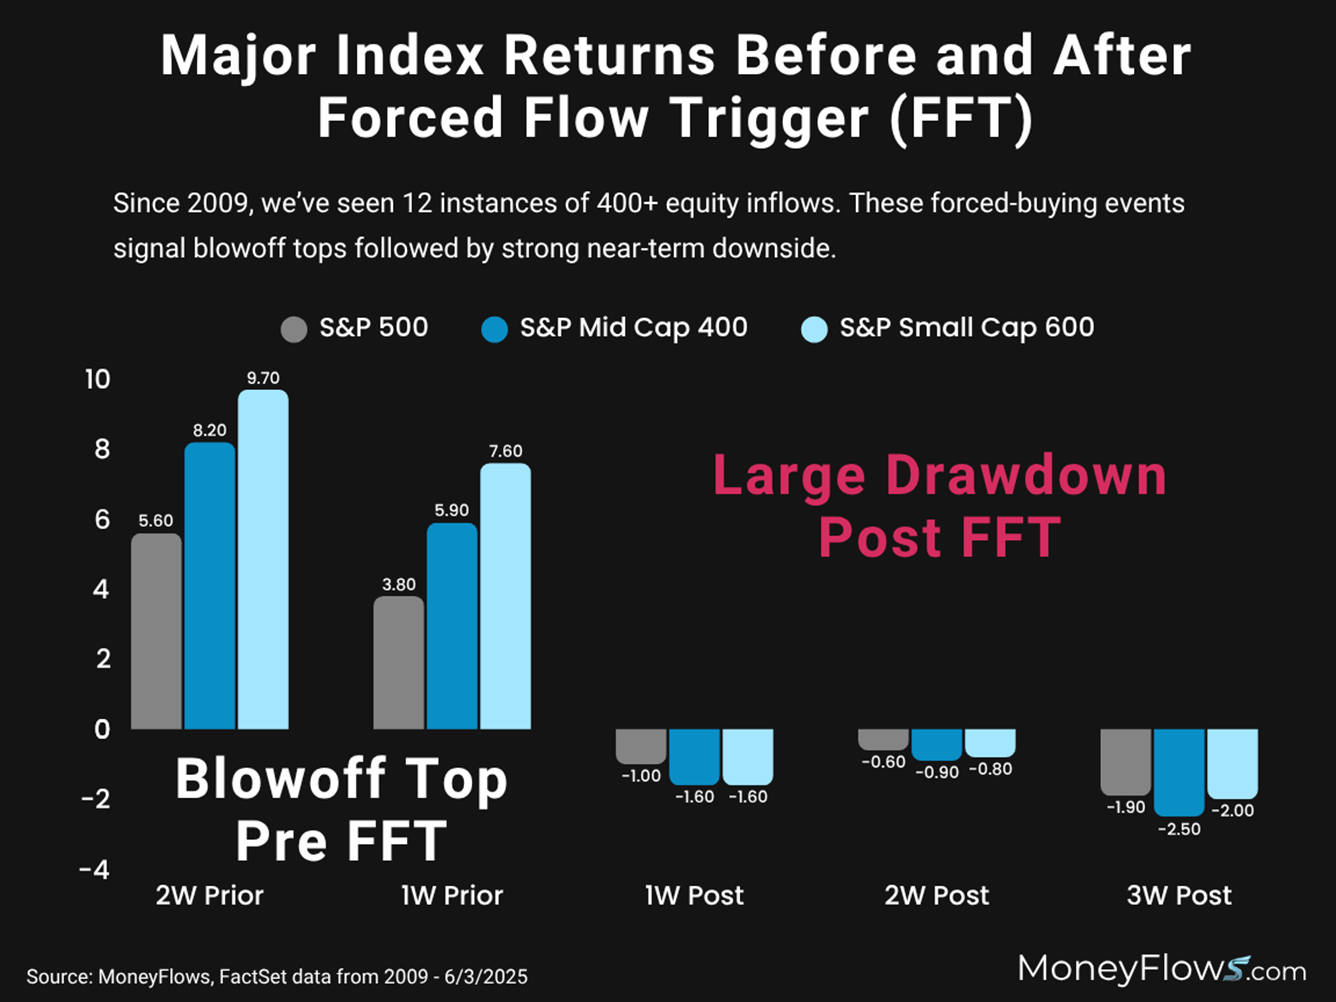
Below lists out the dozen FFT signals since 2009. Leading up to these events, all major indices soar 2-weeks prior with the S&P 500 gaining 5.6%, S&P Mid Cap 400 jumping 8.2%, and the S&P Small Cap soaring 9.7%.
But the party ends once peak enthusiasm hits. After the rare FFT hits, stocks fall for 3-weeks on average:
This is a big deal.
If major indices jump 5%+, you can bet your top dollar that high-quality growth stocks under heavy institutional accumulation will jump magnitudes more.
And when the hangover hits, an index falling 2.5% means growth stocks will fall 10%.
That’s the way it works.
This is the event we believe is ahead.
The great news for you is we put together a video highlighting the list of top growth stocks in our data to zero-in on right now. This is available to PRO Members.
Many of these stocks are not on the radar of the mainstream media…but the flows are there!
As a bonus, you can also watch me break down the this writeup in detail here.
As a reminder, our data had our members get bullish 2 months ago simply due to our unique process loved by professional traders.
Our data will signal the next blowoff top. Join that discussion with us on X!
Can you invest without MoneyFlows?
Maybe…but I can’t recommend it!