
Equities Thrive Amidst Rising Rates
One of the biggest talking points for investors is rising yields.
Pundits say it’s a cause for concern.
Just don’t buy into it.
Today, we’ll demonstrate that equities thrive amidst rising rates.
Equities have had a rough start in September. The S&P 500 kicked off the historically volatile month with a -.69% slide.
Much of that pullback was attributed to rising interest rates. Headlines that the Trump Administration’s tariffs are illegal without congressional approval sent the US 30Y yield to nearly 5%…it’s highest reading since July.
Given the worrisome narrative on high rates, I went back and studied how stocks perform in different interest rate environments, dissecting both 30Y yields and 10Y yields.
If you’re of the belief that high interest rates are a stock market killer…think again.
We’ll challenge that narrative with cold hard evidence…my bet is the findings will surprise you.
And as a bonus, we’ll cover one area of the market under healthy institutional support.
Plenty of stocks are attracting capital when you unpack the money flows.
Equities Thrive Amidst Rising Rates
Stock markets have had to deal with elevated rates since the Fed began its inflation fight in the early 2020s.
What has surprised many is how resilient equities have been in recent years. We’ve been on record many times telling investors to buy stocks even in the face of high interest rates.
That stance was born out of historical evidence.
We are reinforcing that view today.
Here we can see how the US 30Y yield clocked a 2-month high this week at 4.97%:
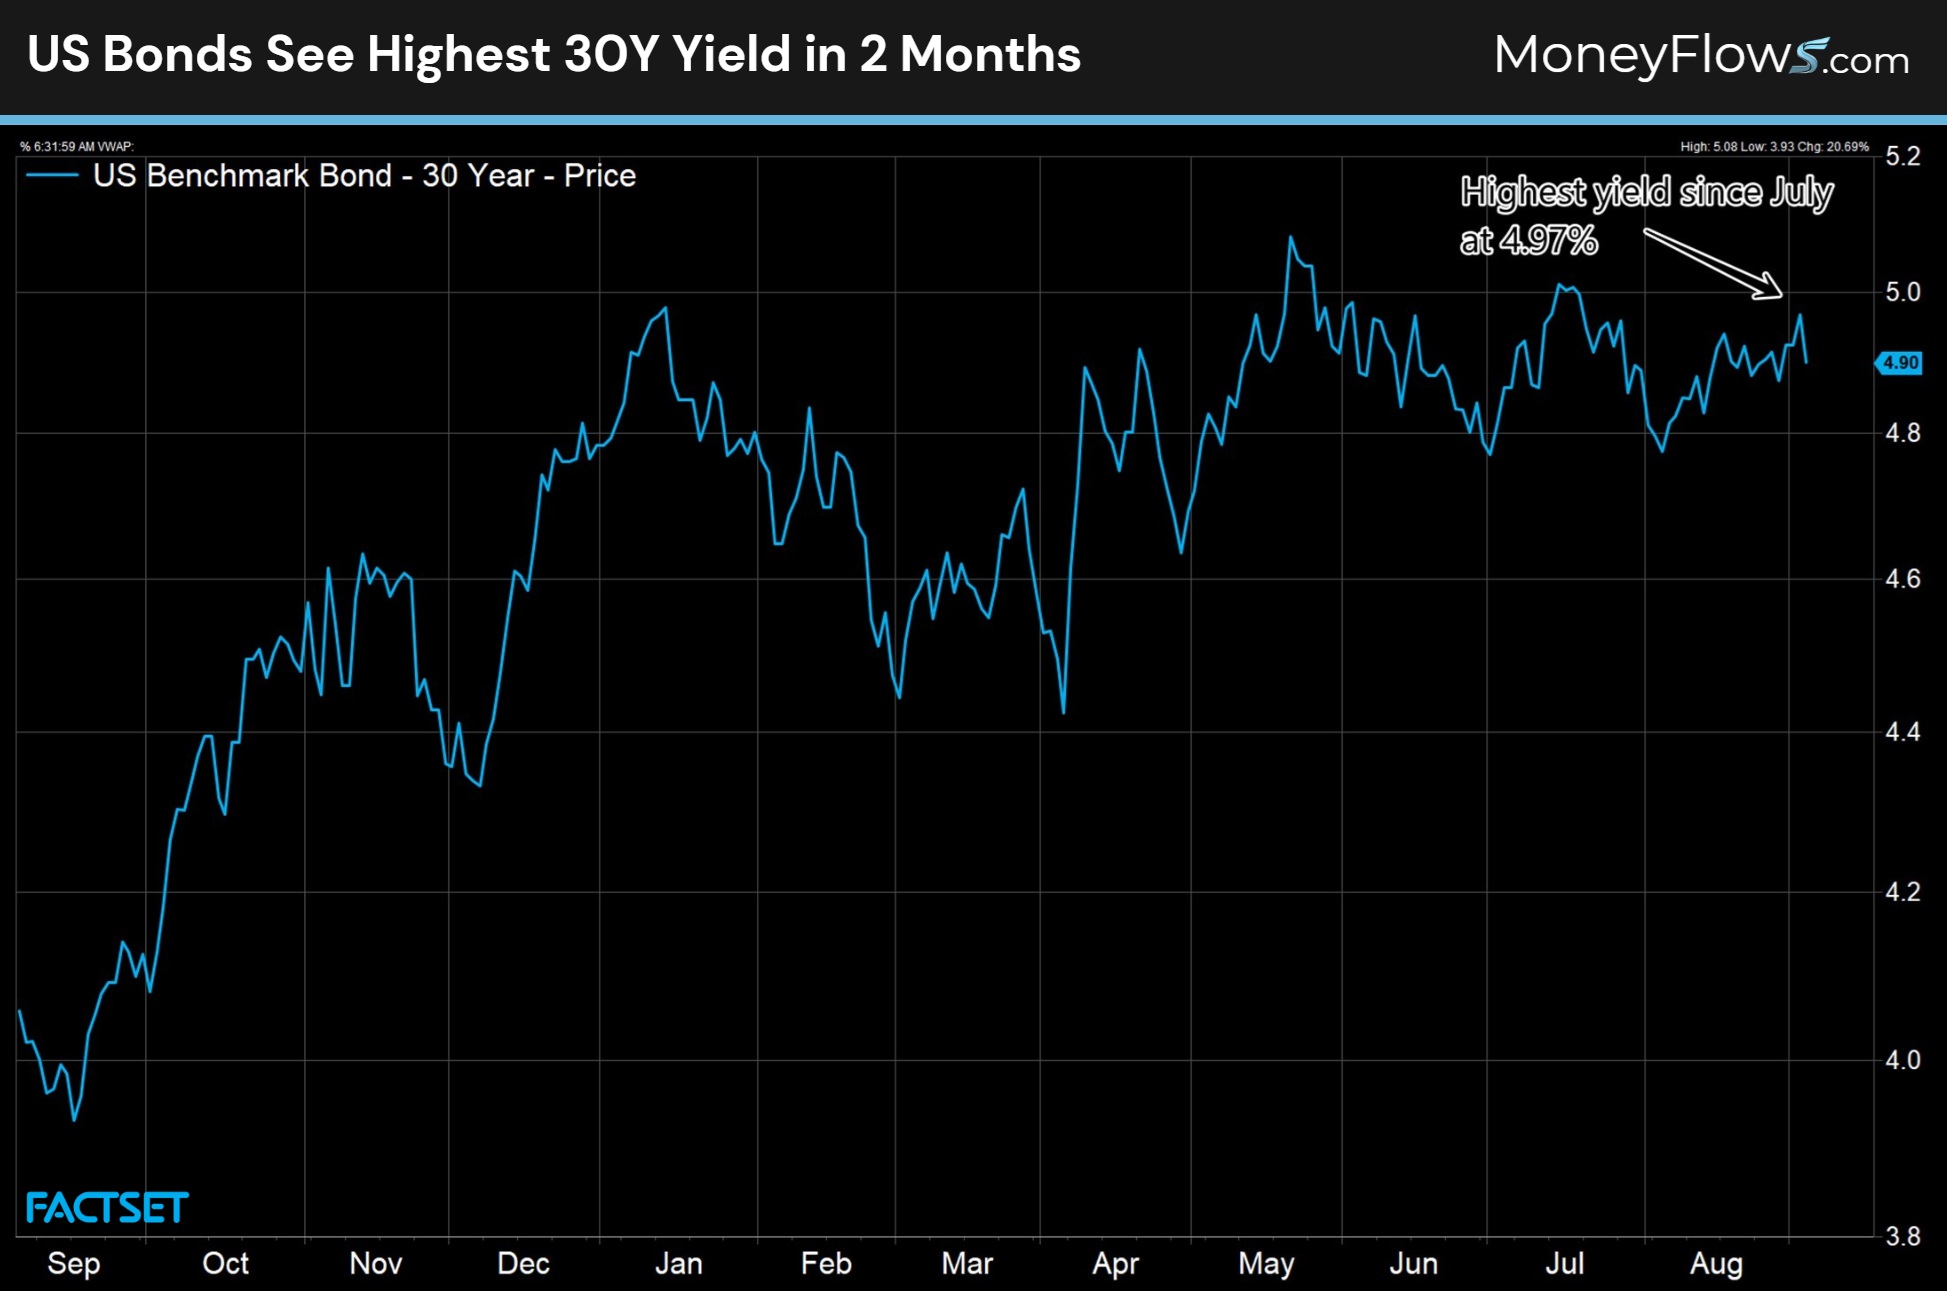
Many have stated that the 5% barrier spells equity doom and gloom.
Yesterday I needed to find out if that’s true. Can equities withstand high interest rates?
Turns out, they can…and often do.
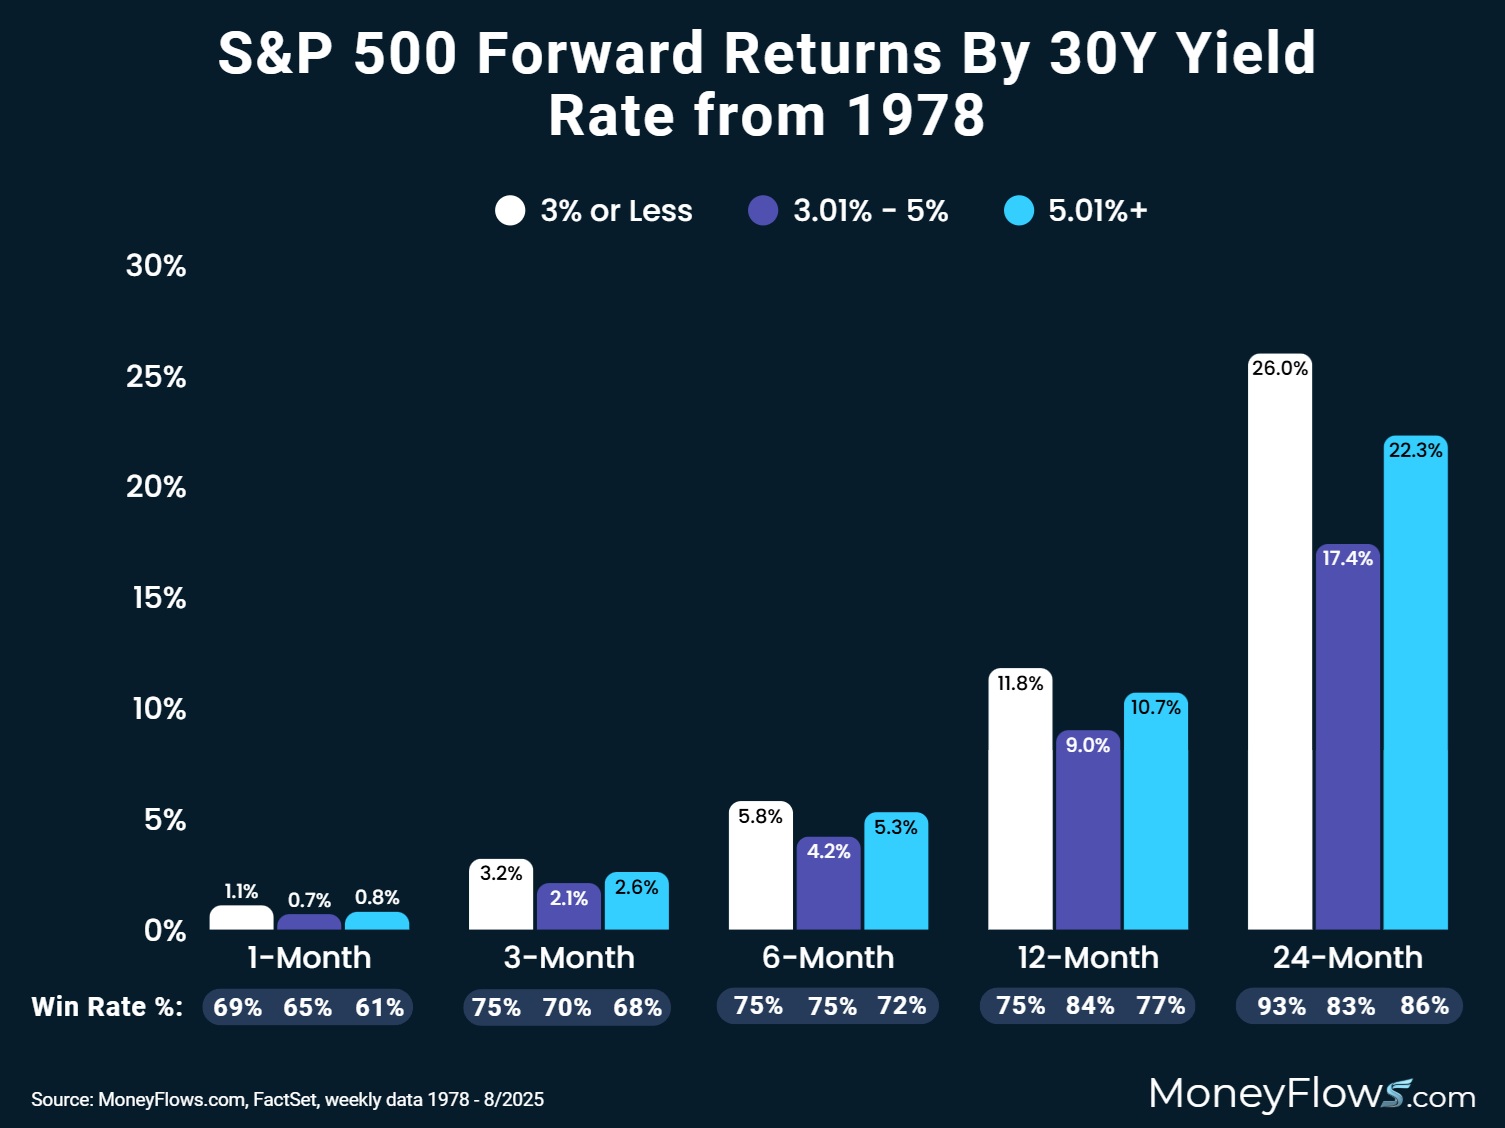
Using weekly data from 1978, I plotted the S&P 500 forward returns based on different US 30Y yield rates.
As you’d imagine, lower yields do have the expected forward equity returns. When 30Y yields are 3% and lower, the 12-month average return for SPX is 11.8%.
But what about rates between 3.01% – 5%? Large caps do well still with 12-month average gains of 9%.
Even further and more importantly, when 30Y yields break above 5%, the S&P 500 averages a gain of 10.7%.
Bottom line: Don’t sell stocks just because long-end rates are rising!
Let’s keep going.
The bears have also rattled the cage on rising 10Y yields.
While the 10Y yield hasn’t garnered as much attention, let’s take a look at what history says about climbing yields.
The recent spike took the 10Y rate to 4.27%:
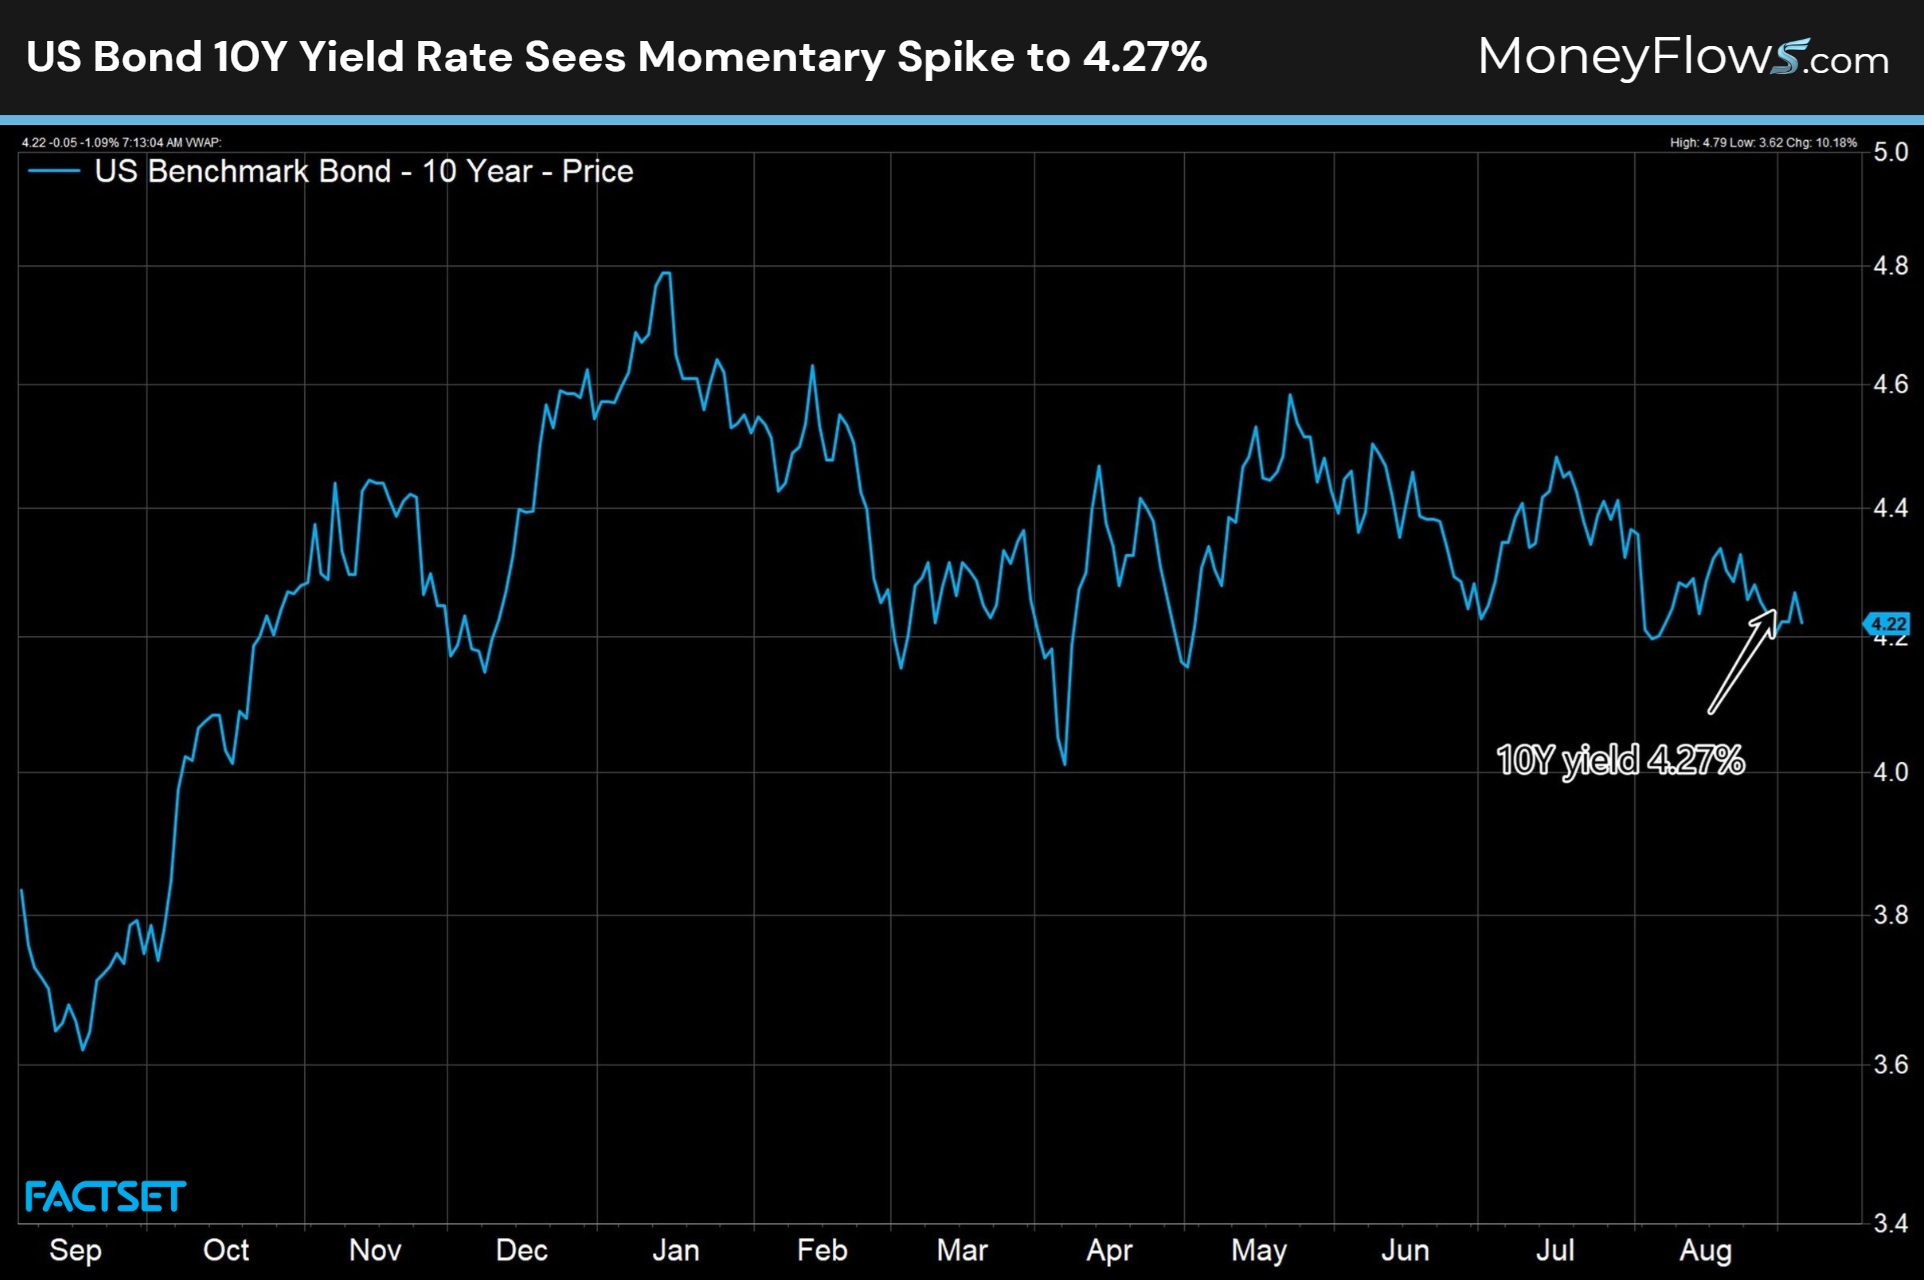
While yields aren’t spiking now, let’s use a similar framework to the prior study.
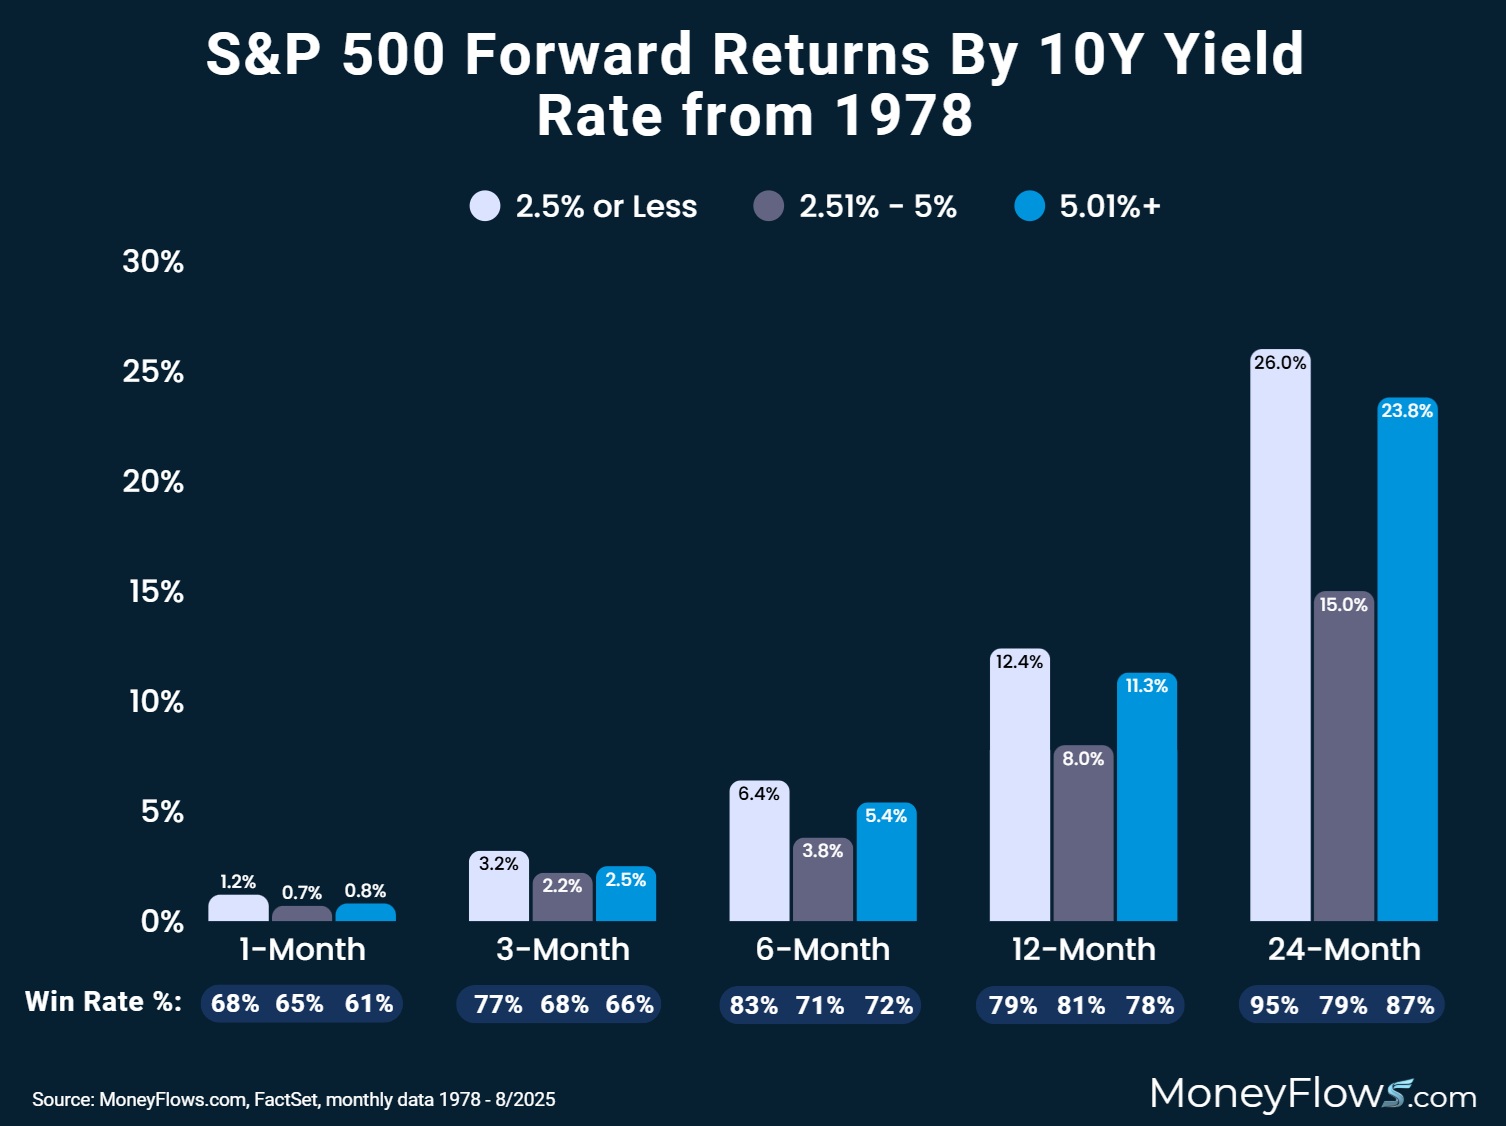
Using monthly data from 1978, rates below 2.5% do in fact favor strong equity returns with the S&P 500 gaining an average of 12.4% twelve months later.
The lowest expected returns are when 10Y yields fall into the 2.51% – 5% range, with the S&P 500 gaining 8% 12-months later.
Here’s what may surprise you: When 10Y yields break above 5%, the S&P 500 has historically gained 11.3% in the following 12-months:
Q: So, can equities thrive amidst rising rates?
A: Absolutely. There’s no practical correlation between high rates and equity performance.
Investors are better off focusing on high-ranking stocks enjoying constant inflows. That’s how you’re going to generate alpha.
Here’s one awesome way to spot outlier stocks using ETF flows.
How to Find Outlier Stocks inside ETFs
MoneyFlows data tracks and ranks nearly 1000 ETFs every day.
This unique data allows us to spot powerful flow trends that often last for months.
Using one of our newest modules for our Advisor subscription, we can dive into ETF inflows and break out the best ranking stocks under heavy accumulation.
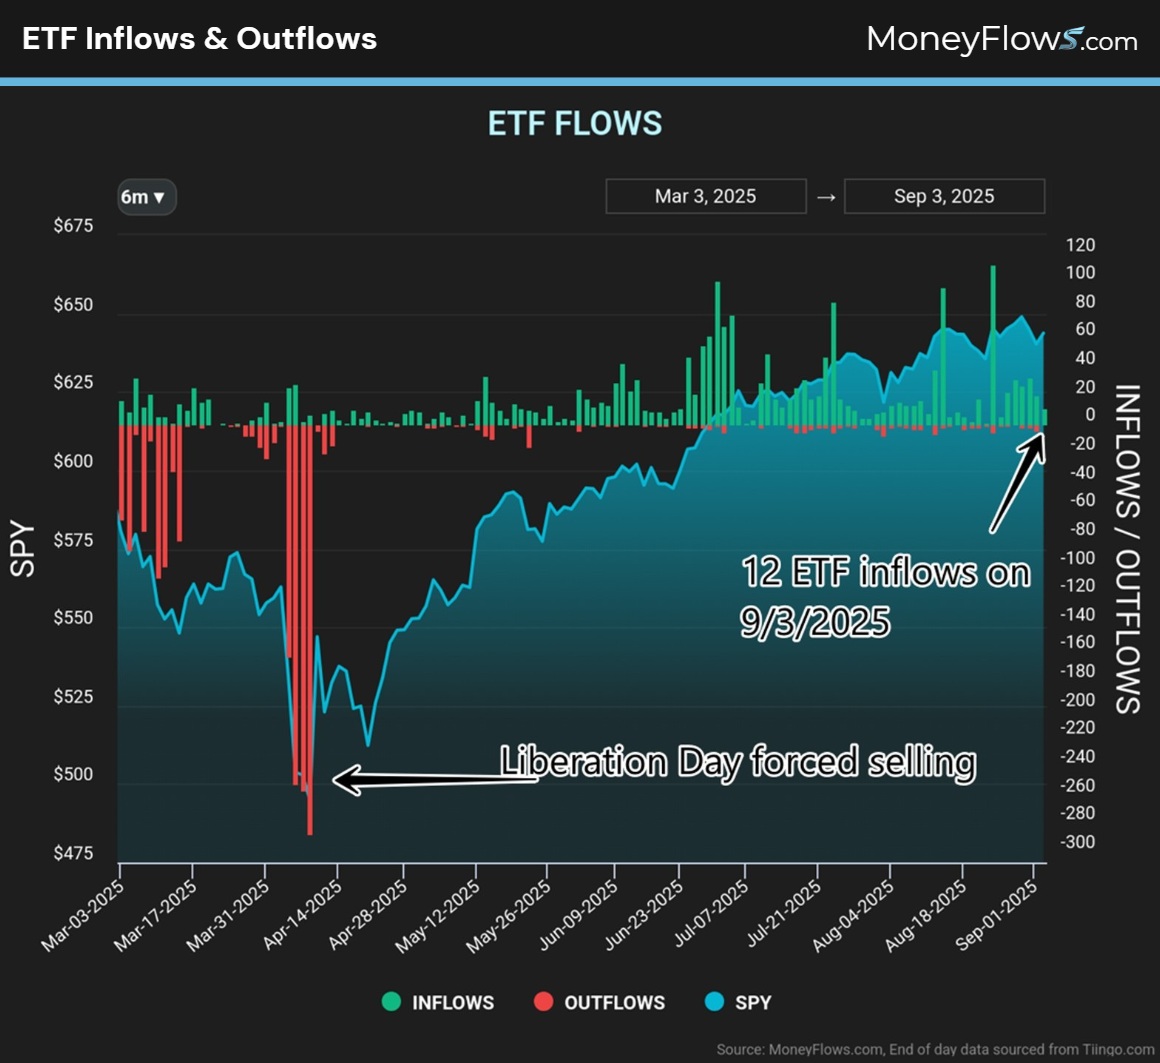
Yesterday saw 12 discrete ETF inflows:
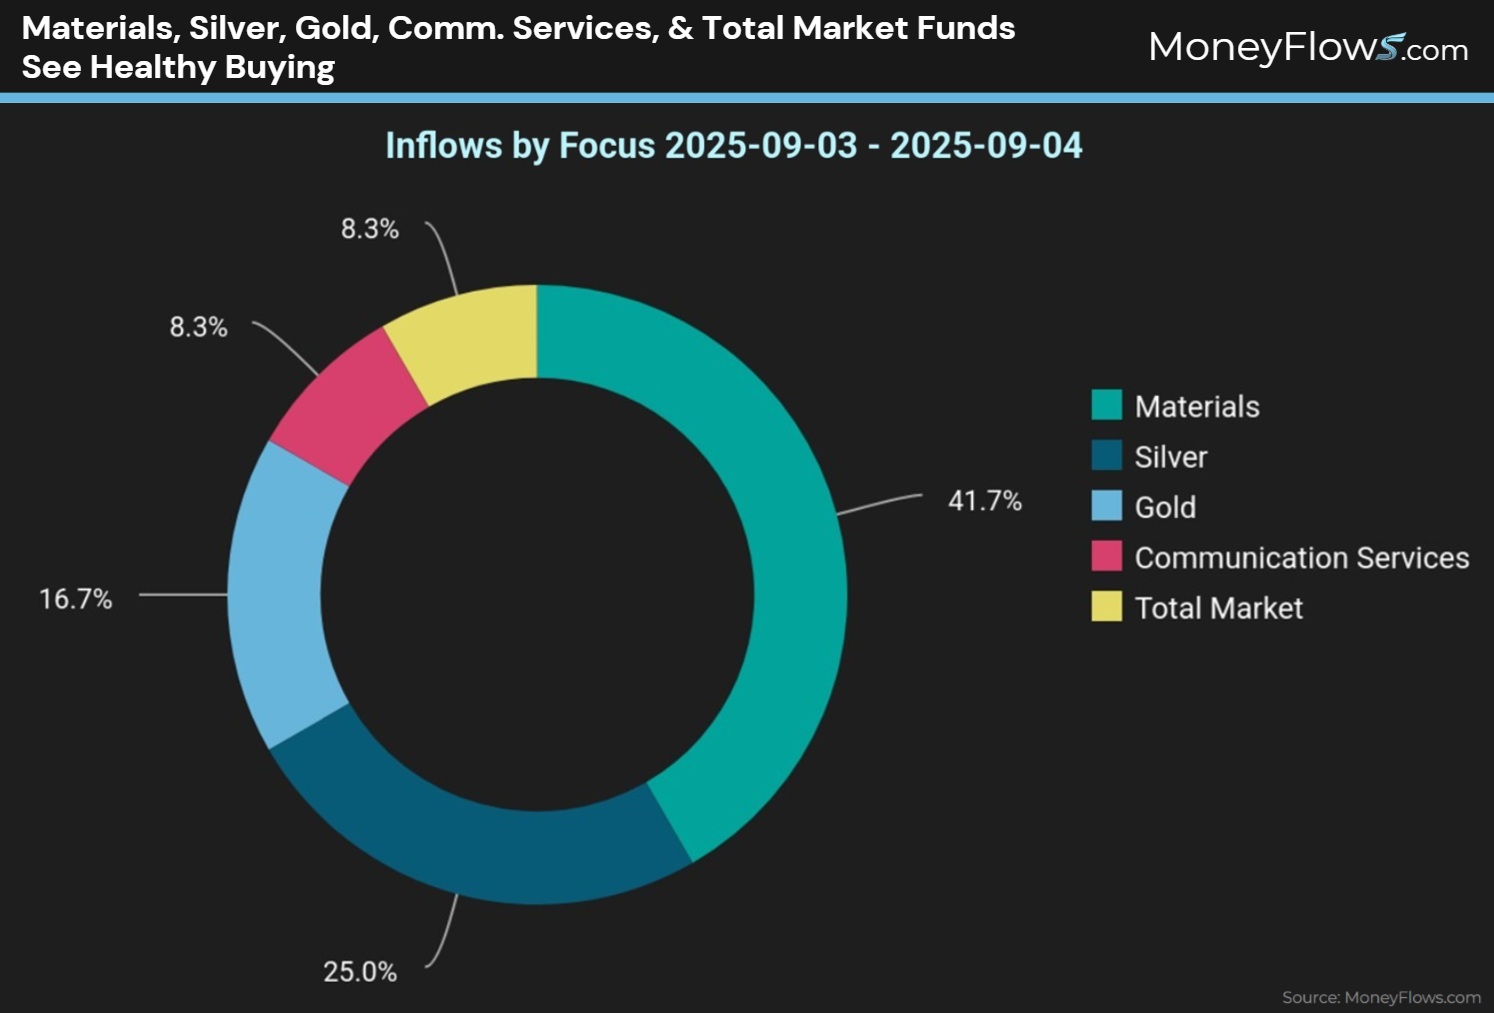
Let’s unpack those dozen inflows by focus and theme.
Here we find that Materials, Silver, Gold, Comm. Services, and Total Market funds saw healthy buying:
Let’s focus on gold as it’s been a big theme in our data. Back in May we stated that you should buy the dip in gold…hopefully you did!
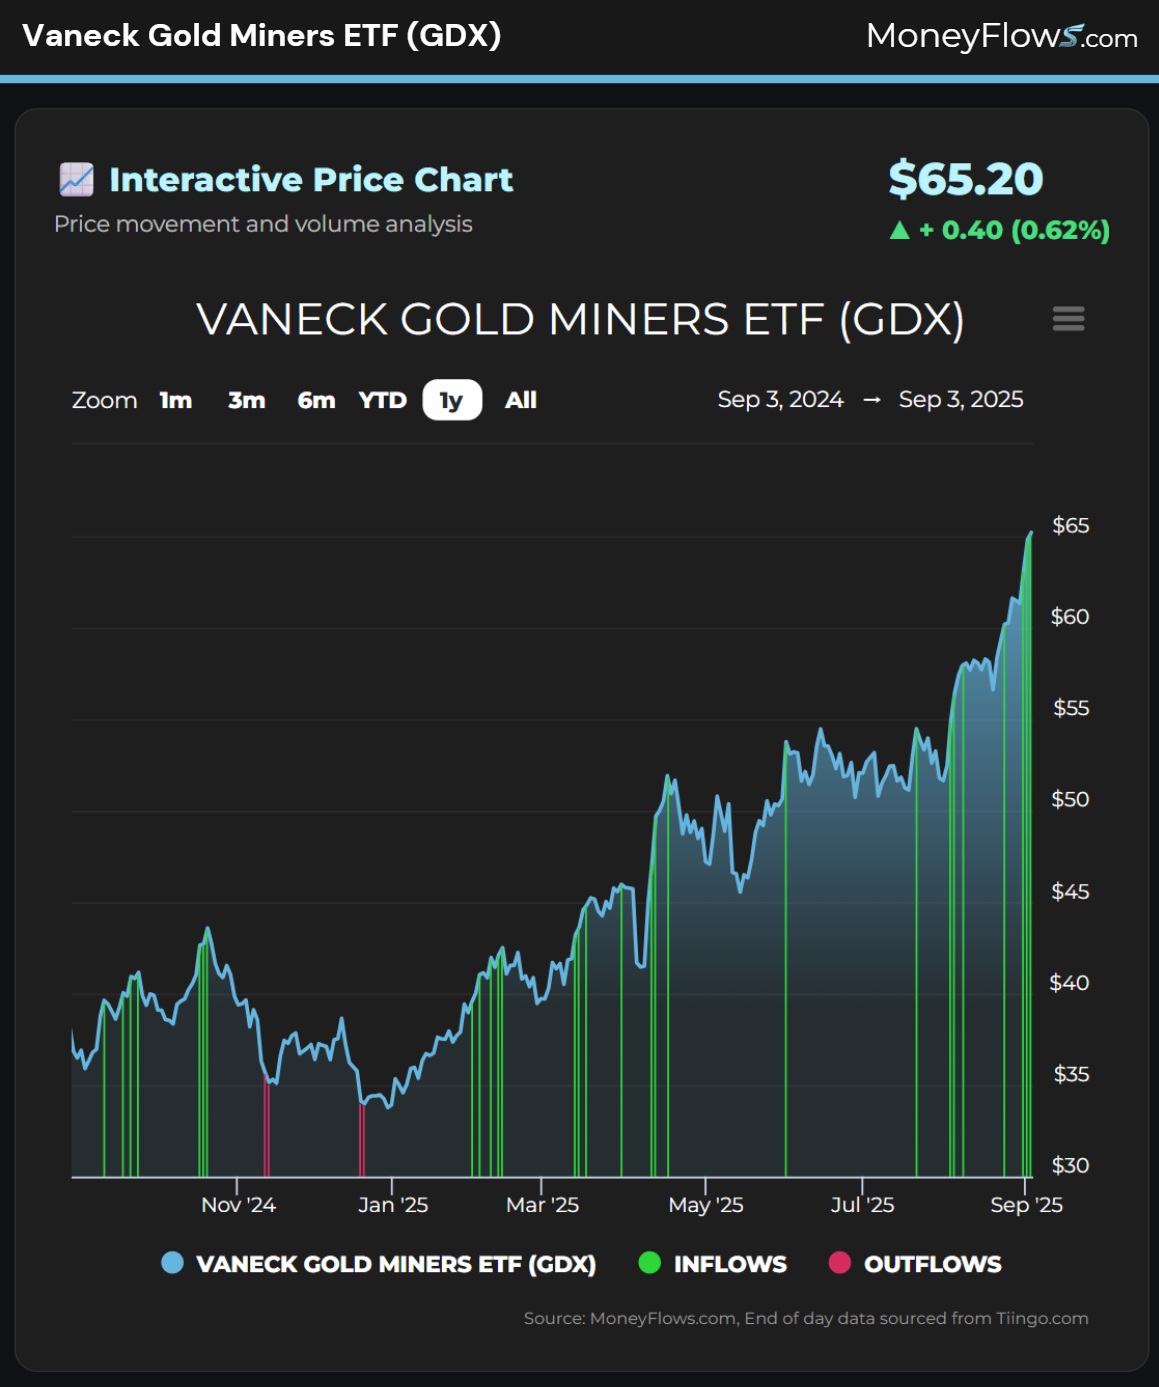
One of the gold ETFs that were accumulated yesterday was the Vaneck Gold Miners ETF (GDX).
Incredibly, this fund hasn’t seen any outflows in 2025…gold miners have attracted non-stop inflows:
Now here’s where alpha can be made using the MoneyFlows portal.
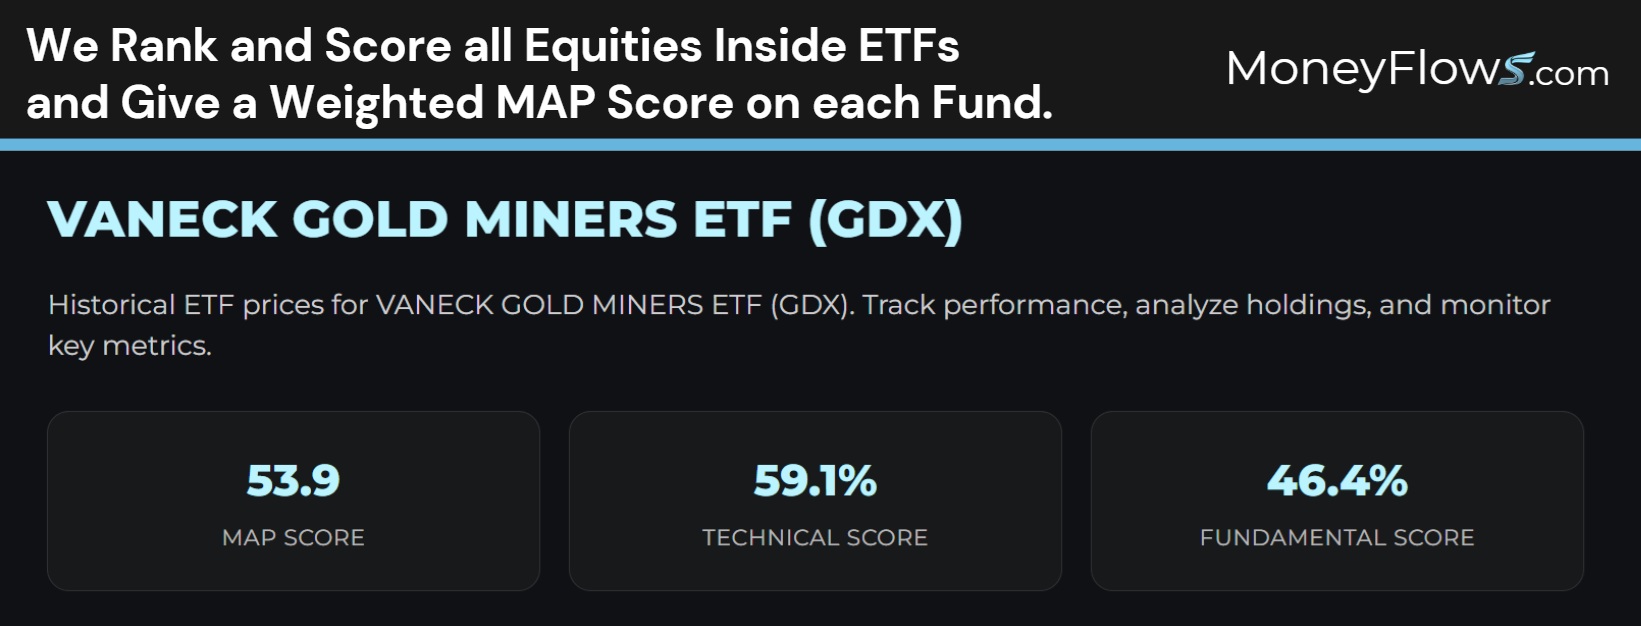
We rank and score all equities inside ETFs and give a weighted MAP Score on each fund. GDX currently spots a MAP Score of 53.9, comprised of a Technical Score of 59.1% and Fundamental Score of 46.4%:
But we all know a basket of stocks will have studs and duds.
We profile the top ranking names in each ETF making it easy to find outliers beaming with institutional support.
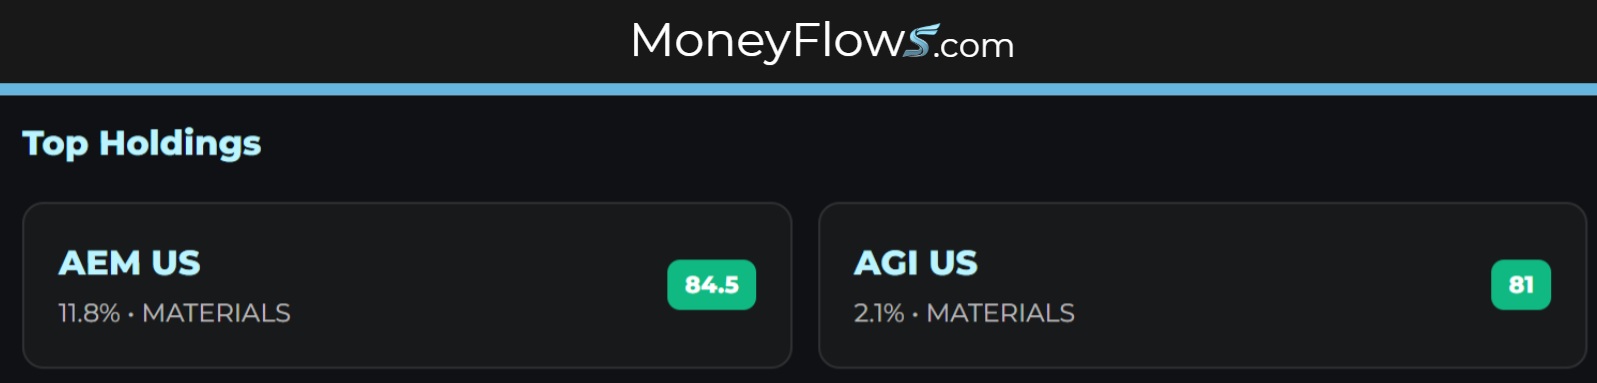
Here we can see that the top 2 ranking stocks are: Agnico Eagle Mines (AEM) and Alamos Gold (AGI):
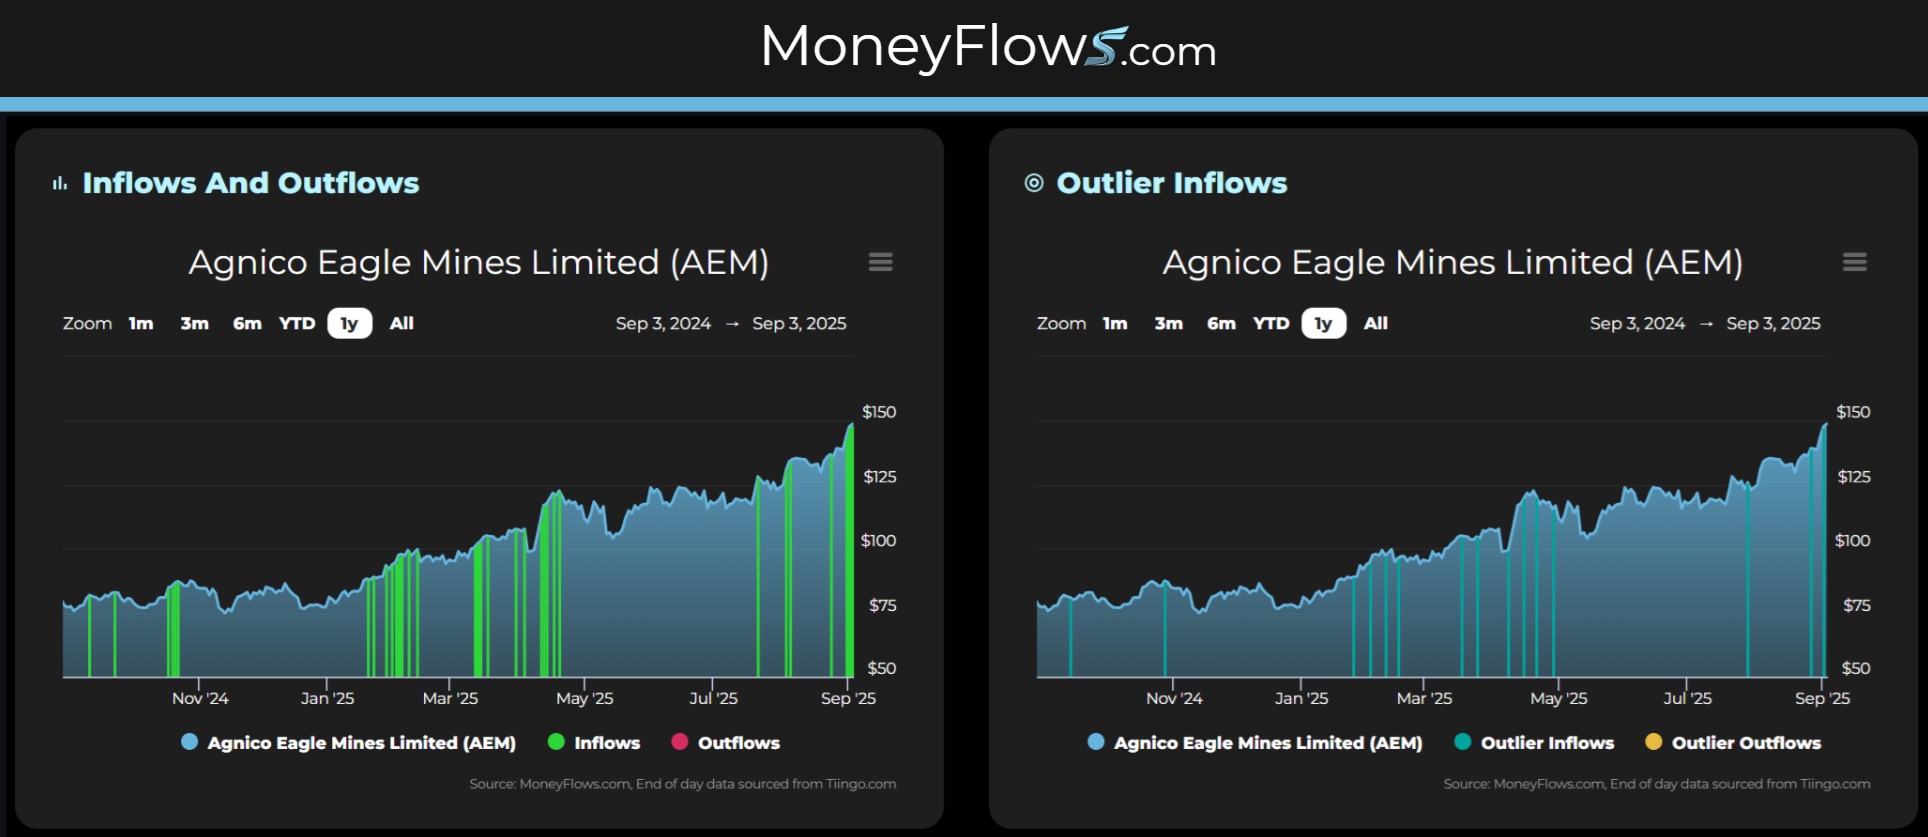
By clicking on AEM, we can see that this stock has seen non-stop inflows (green signals on the left) and more importantly, it’s been one of most recurring stocks on our Outlier 20 Report (blue signals on the right):
This showcases the power of the MoneyFlows system. No matter what worries investors are facing, capital is flowing somewhere.
You just need a map to see it!
Stop worrying about interest rates…focus on all-star stocks loved by institutions.
Your portfolio will thank you!
As we head into a pivotal Fed decision in 2 weeks, now’s an amazing time to upgrade your research.
Get started with a PRO subscription and spot the handful of stocks under accumulation day after day.
If you’re a money manager or RIA, our Advisor solution will provide you with data-driven insights you can’t find anywhere else.