August 2025 Stock Market Rotation
Money rarely leaves markets.
It rotates.
We’ve seen a lot of this lately.
Let’s visualize the August 2025 stock market rotation.
There’s been a big change in equity behavior in August. Growth stocks have come under pressure while defensive areas thrive.
Some will ascribe this bobbing and weaving to nervousness heading into Jackson Hole tomorrow…which is true.
However, I see much of what’s occurring as typical low-liquidity summertime weakness.
We’ve seen this pattern over and over again throughout the years.
Just 2 weeks ago I wrote how seasonal weakness and market rotations often appear in August and September. That’s the situation we’re facing.
And we’re likely in for more bumpiness in the weeks ahead.
That’s the bad news.
The better news is that cooldown periods are needed after monster rallies…and this presents a window of opportunity for those patiently waiting to buy the dip.
August 2025 Stock Market Rotation
Equities oscillate from one extreme to the other.
In April we saw extreme capitulation.
That forced selling ignited a ferocious rally for the ages.
Only recently did the tide shift under the surface. August signaled a notable change in our North Star, the Big Money Index (BMI).
The fall from overbought territory typically means volatility is ahead:
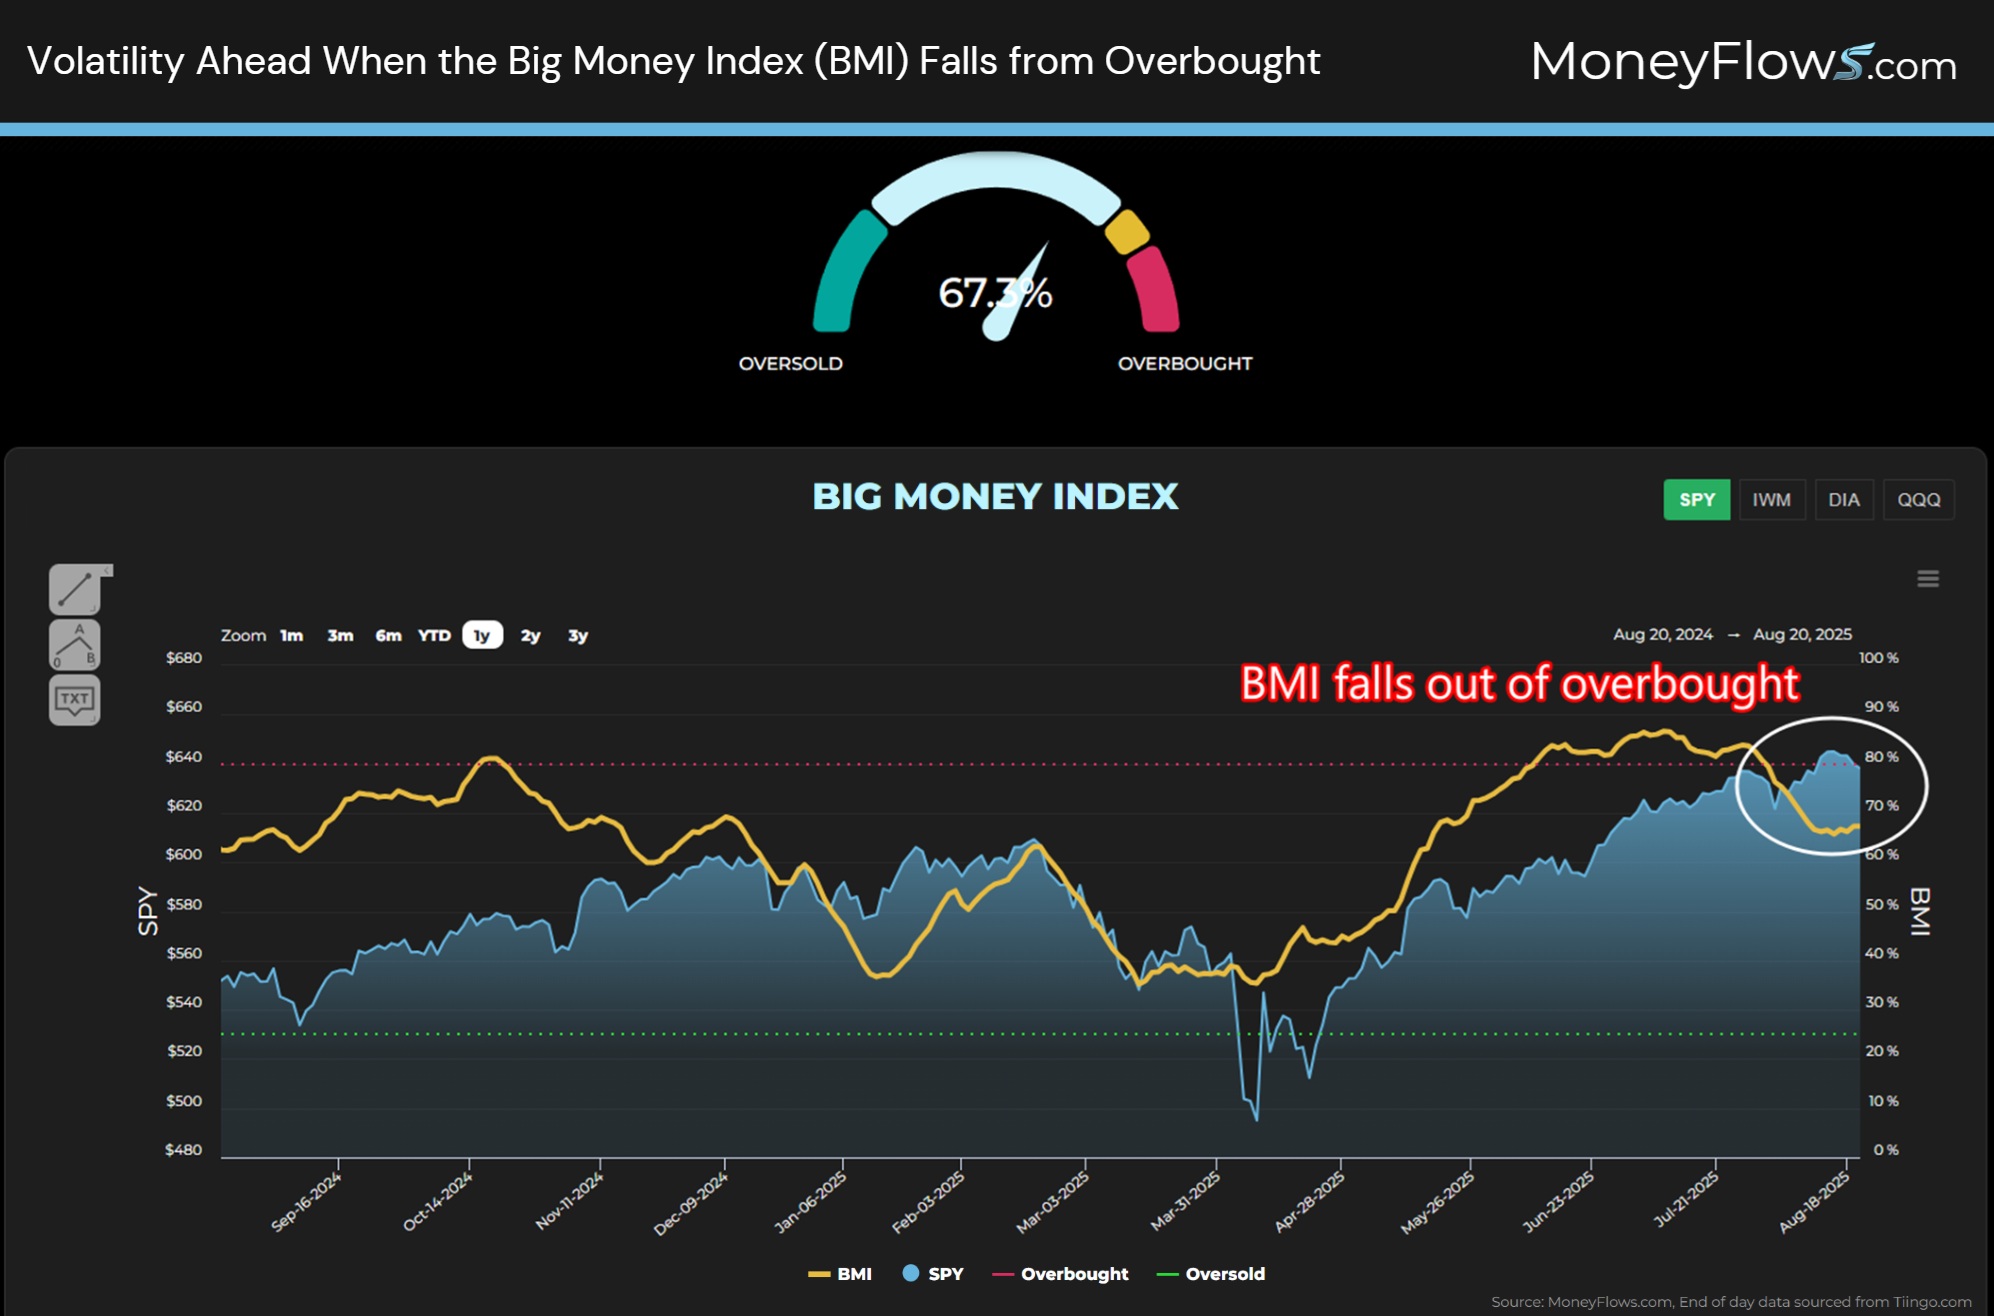
We discussed this potential situation a month ago when we prepared you to buy any summertime dip.
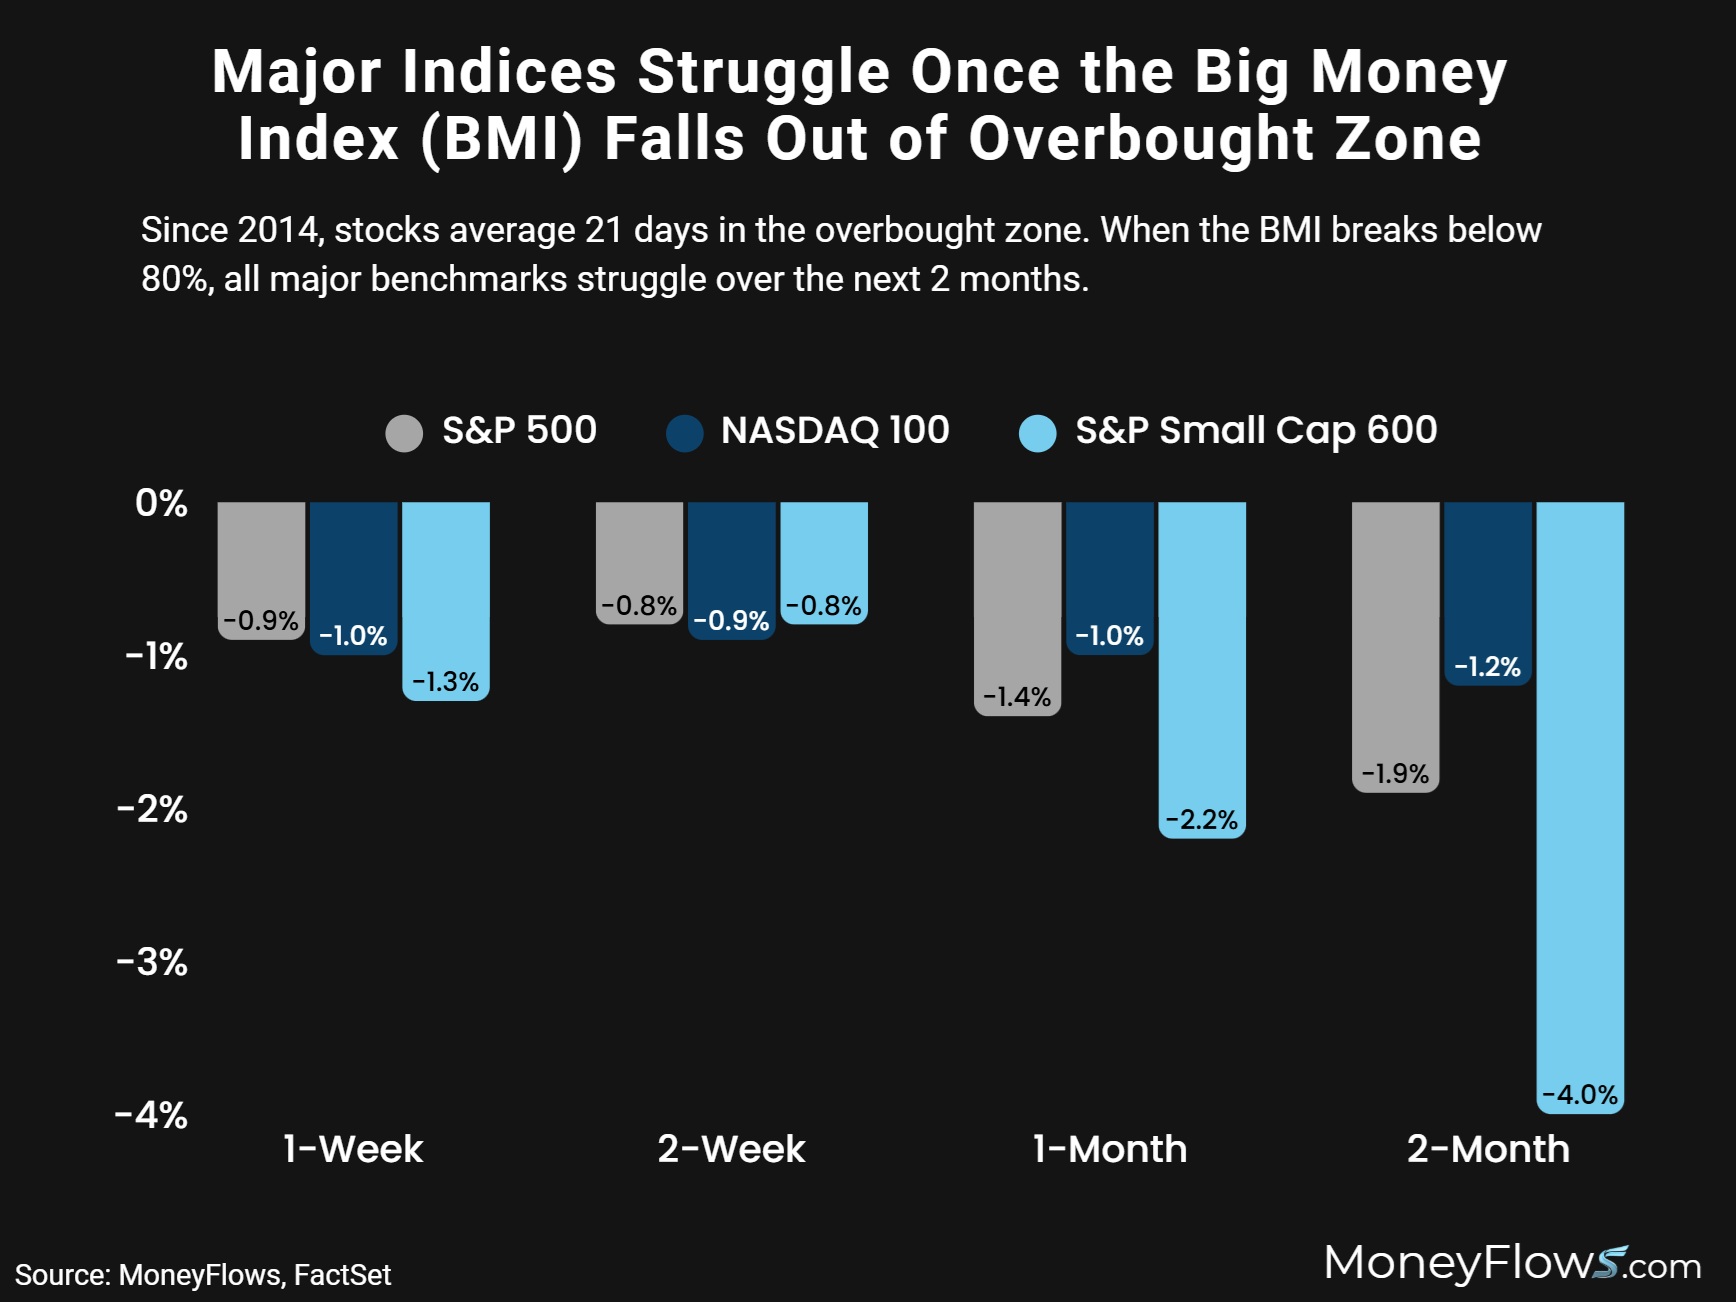
Stocks are no match once the BMI falls out of the red zone. You can see this below with 2-month average returns for major indices post a declining BMI:
Now we know that pullbacks take different shapes and forms.
Sometimes the declines are in unison where all stocks fall together, i.e., correlation of 1.
Other times, you see a healthy rotation where money flips from one hot area to another lagging area.
That’s the situation today.
Hot areas like semiconductors and Technology have taken a hit while prior underperforming groups like the S&P 500 Equal Weight and Russell 1000 Value show life.
From August 14th near the market peak, the PHLX Semiconductor index has shed 4.33% and the growth-heavy NASDAQ 100 has slipped 2.45%.
The S&P 500 EW and Russell 1000 Value have eked out gains of .05% and .16% respectively:

Let’s keep drilling down. The fact that the S&P 500 Equal Weight is flat tells us there has clearly been some winners and losers recently.
Under the surface it’s clear as day. Money is rotating out of popular areas and into defensive lagging areas.
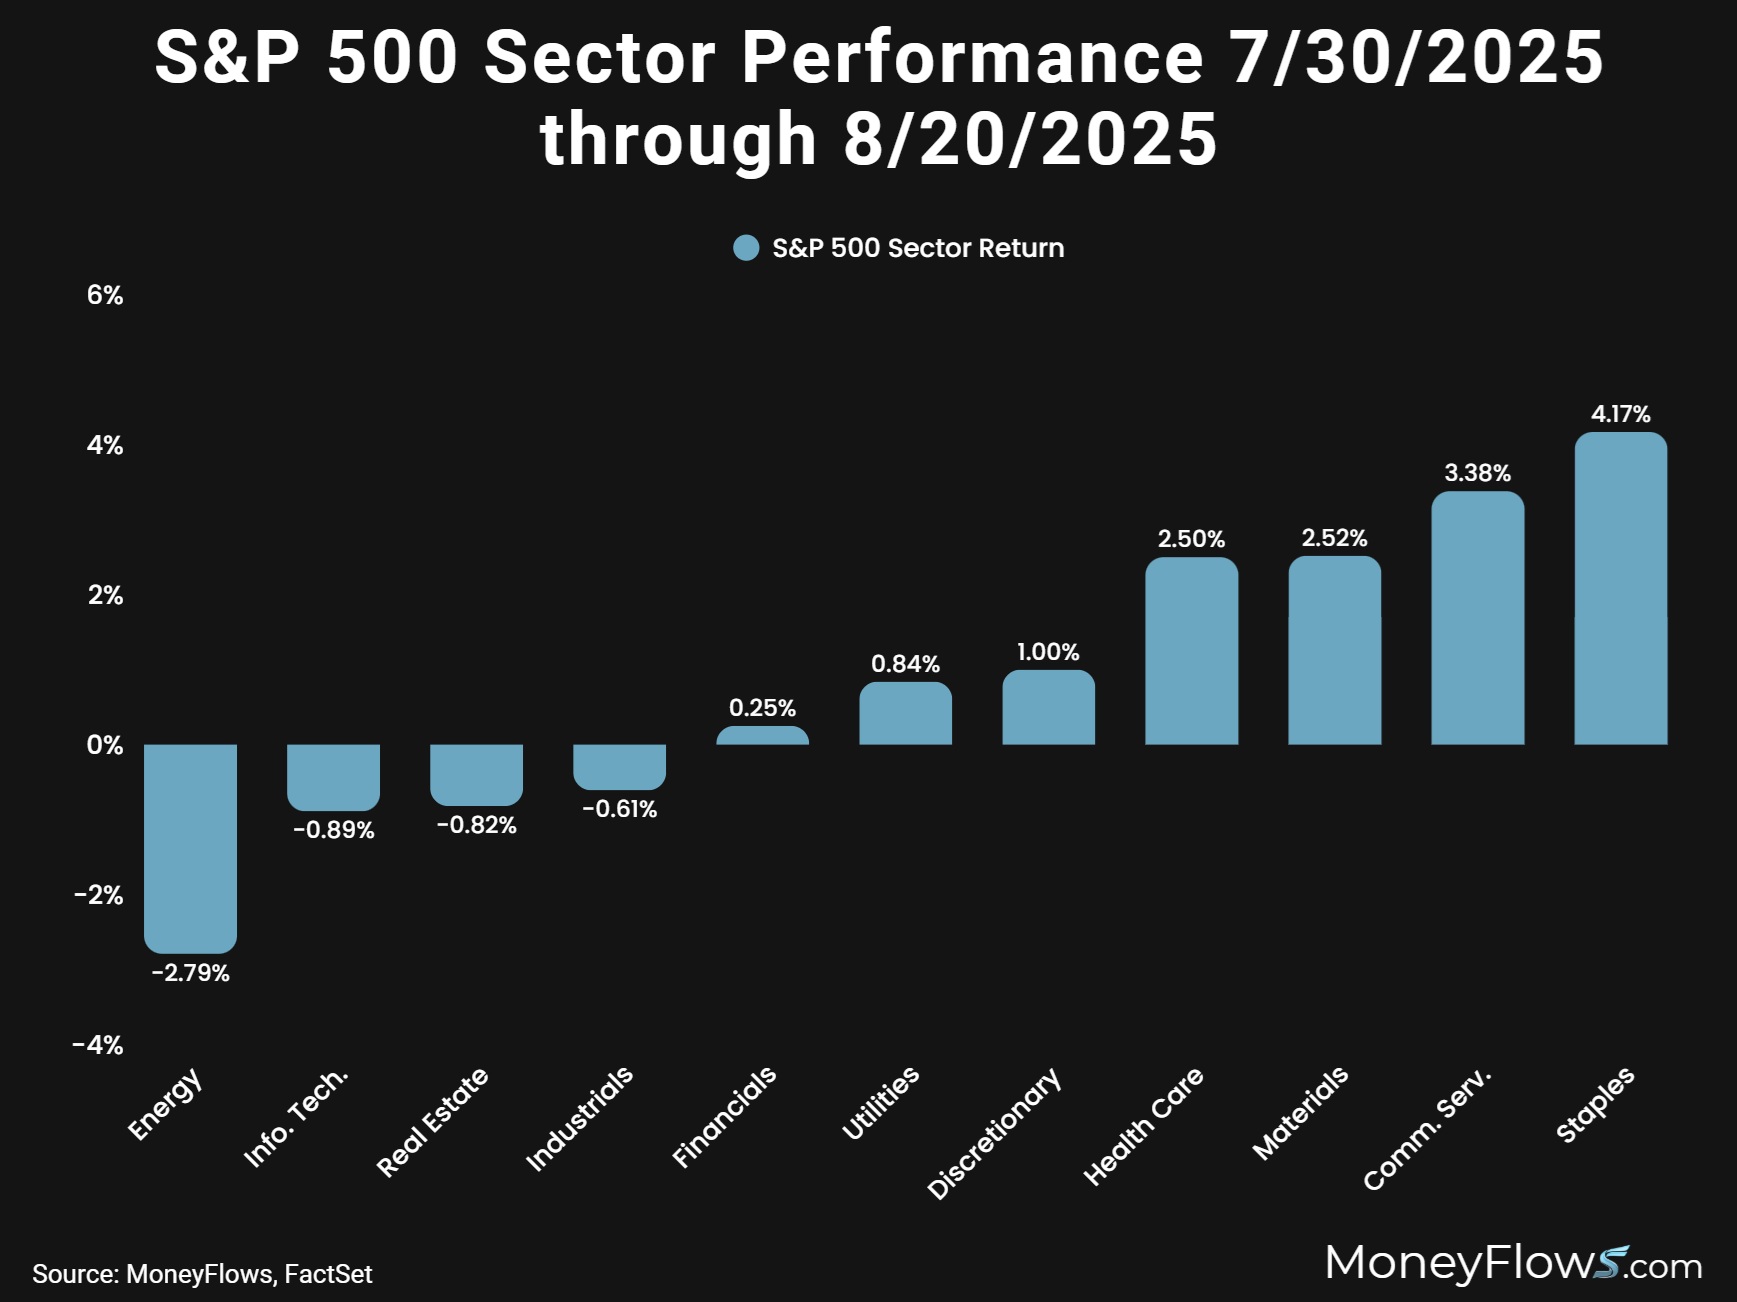
Let’s view the S&P 500 sector returns from July 30th. This is when our BMI started to head lower.
Here we can see how Energy, Tech, and Industrials have fallen while Health Care, Materials, and Staples have soared.
This is typical risk-off positioning as the summertime doldrums are in full swing:
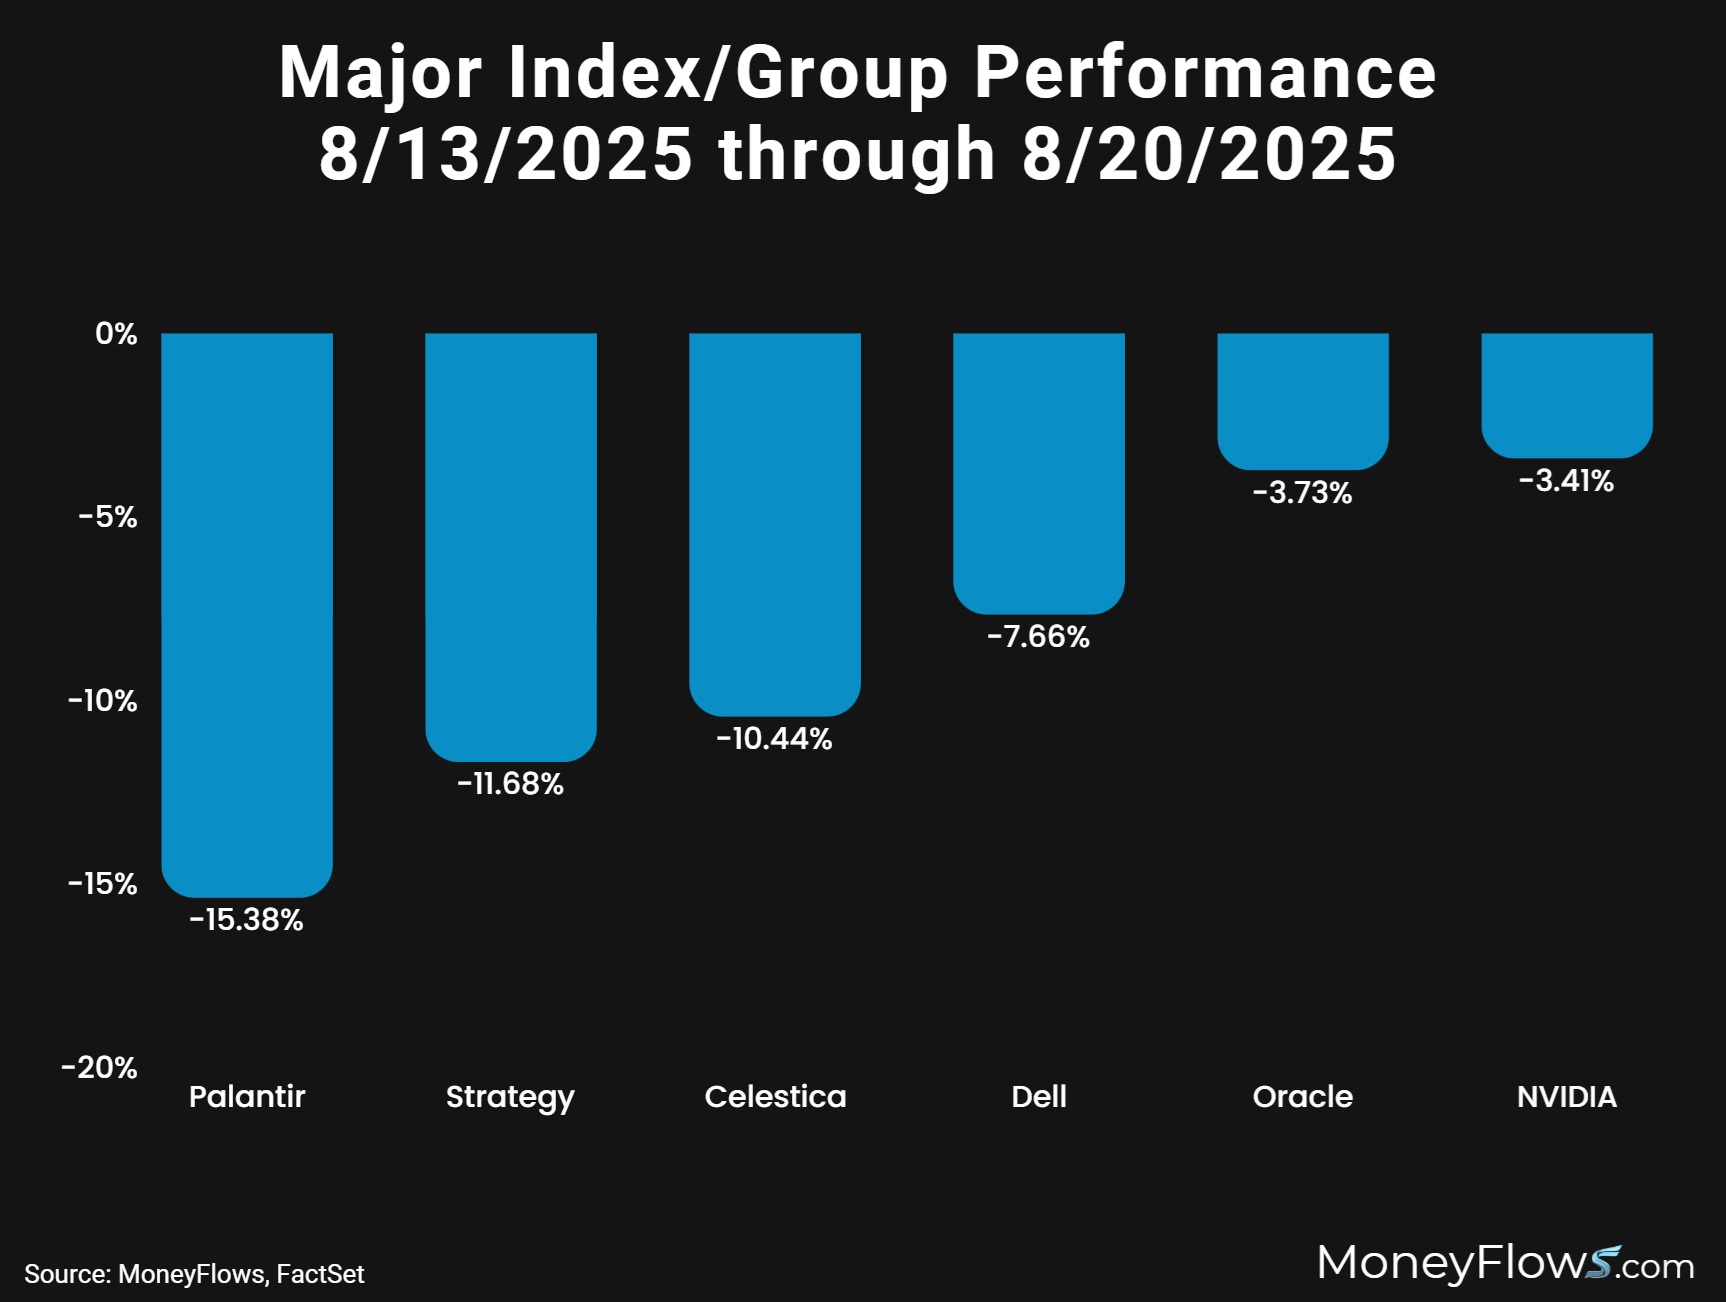
And this picture doesn’t really grasp some of the pain occurring in the growth areas of the market.
Over the past week some of the highest fliers have had their wings clipped!
From August 13th, popular Palatir (PLTR) has declined 15.38% with Strategy (MSTR) dumping 11.68%.
Even NVIDIA (NVDA) has dropped 3.41% during the tech swoon:
And our data has shown this shift very clearly in the technology world.
For months we saw nothing but non-stop inflows. That’s changed as more and more equities come under distribution.
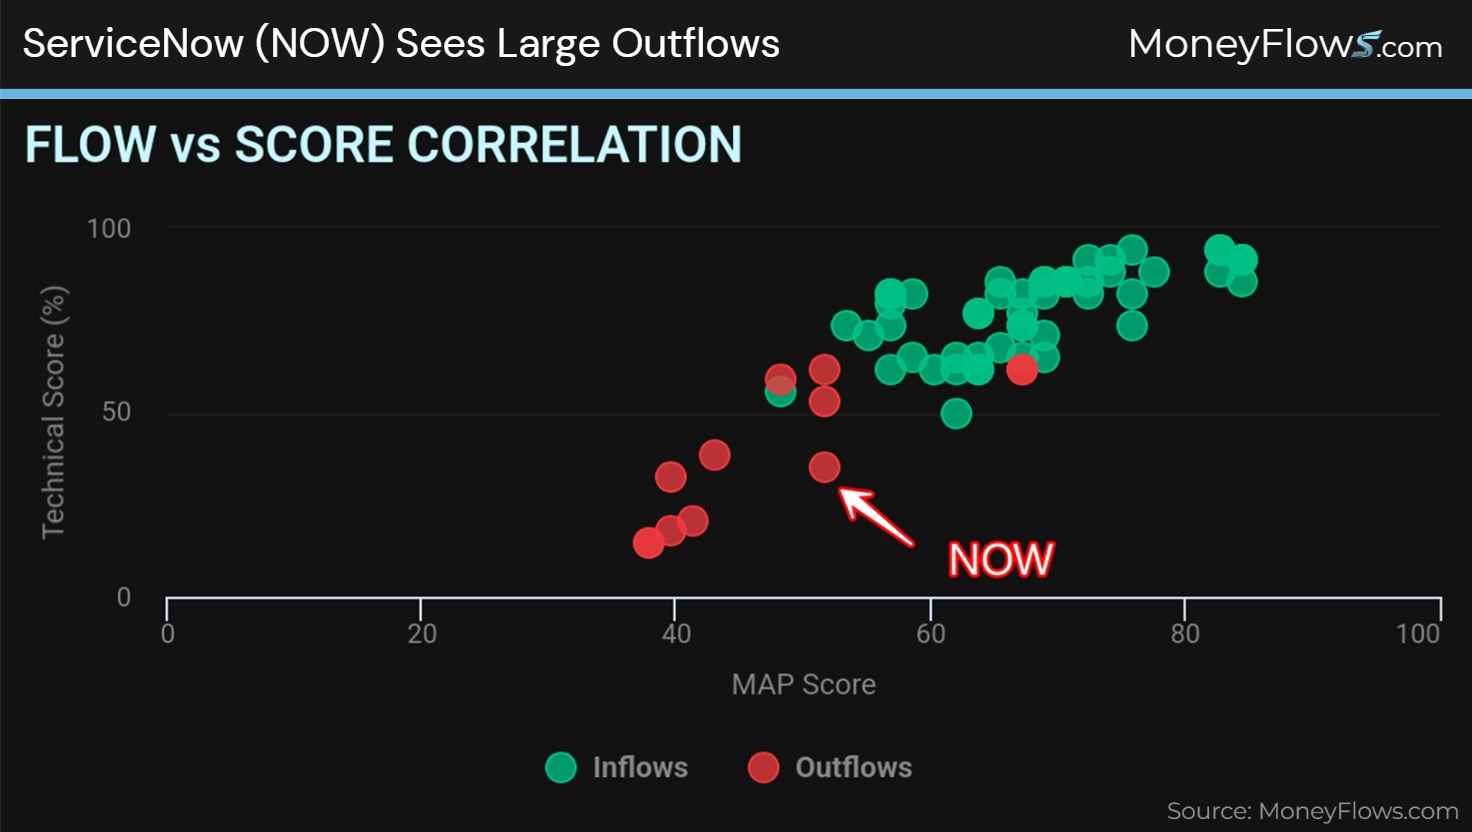
Here’s our Technology inflows and outflows from August 13th. You can see the flow scores too highlighting the variance in the group.
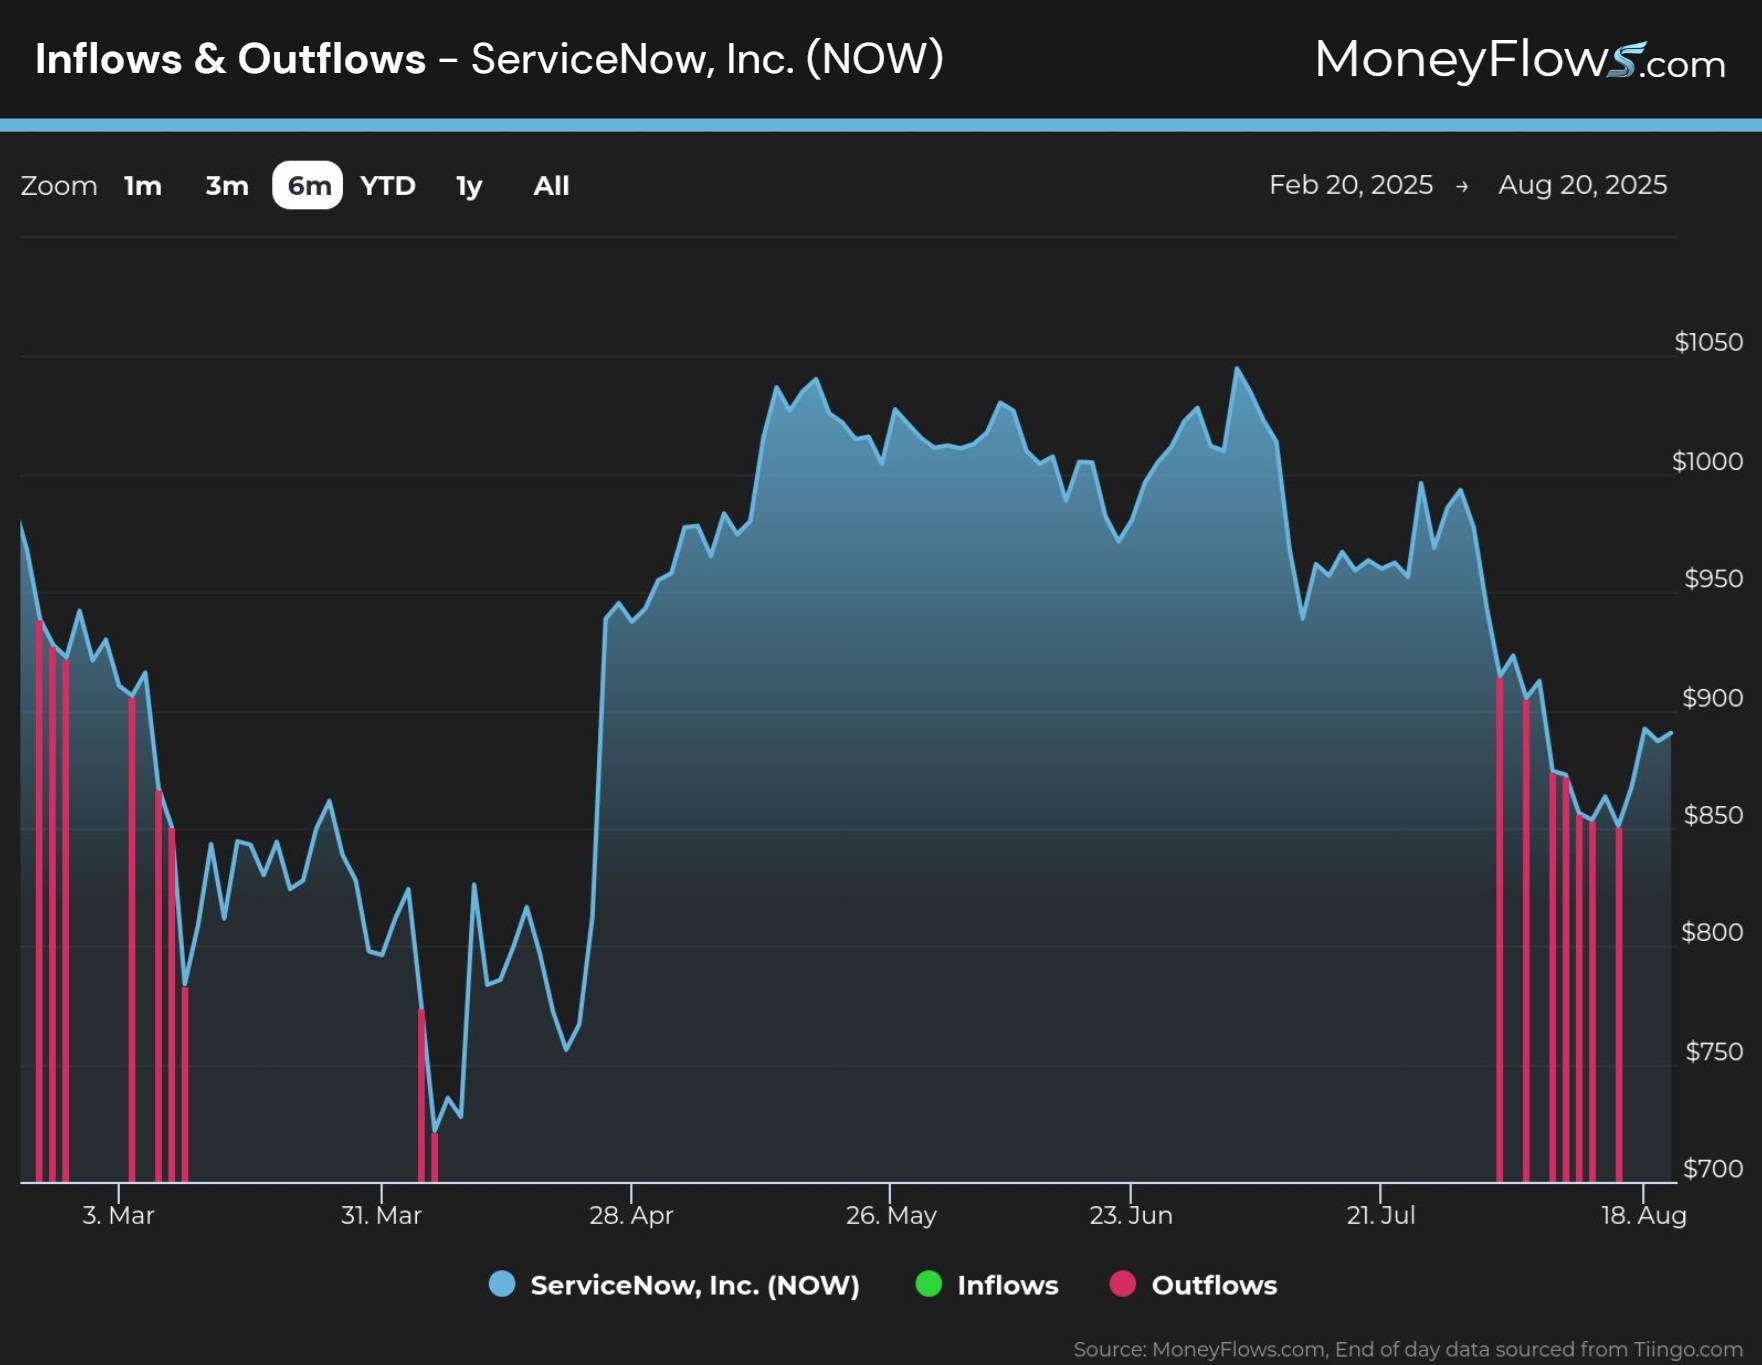
ServiceNow (NOW) has been another victim in the selloff:
Here’s a 6-month view of ServiceNow. Note that once outflows start, they tend to hang around for a while before the sell pressure stops:
And while we can sit and blame inflation fears and nerves around Jackson Hole as the culprit, I find it fascinating how this current pullback under the surface rhymes with history.
Traders are on vacation right now …volumes are extremely light.
This opens the door for added volatility.
From 1990, late July through September is a seasonally weak period with average negative returns for the S&P 500:
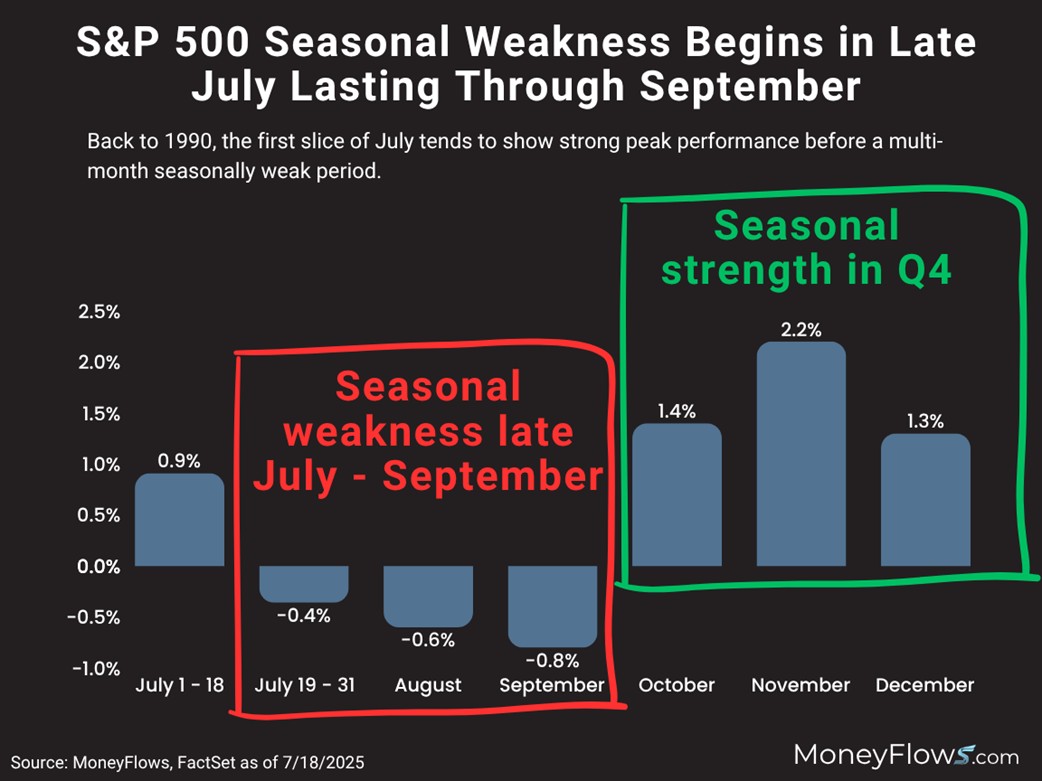
But when you glance off to the right of this image, you’ll see the big opportunity. Seasonal weakness spills over into seasonal bullishness beginning in October.
That’s the important takeaway.
The August 2025 stock market rotation is in full swing. We’ve discussed it for over a month.
Start making your buy list now. Once the tide turns and money rushes back into growth stocks, you’ll want to be prepared to act.
That’s what we’re doing at MoneyFlows.
Buy any summertime dip.
Ride the rip!
If you want to learn more about our proprietary indicators and how we find the best stocks in the market, check out our PRO subscription.
If you’re a money manager or RIA and want portfolio solutions, reach out about our Advisor solution here.
***Join Jason Bodner LIVE in Orlando at the MoneyShow TradersExpo, Oct. 16th -18th, as he presents: Using MoneyFlows to Identify Winning Investments.
Click the image below to register now. You don’t want to miss this!