
Small-Cap Power Thrust Signals
The last 2 days have shown an incredible appetite for smaller companies.
Some groups saw the most inflows all year.
Investors finally believe that interest rate cuts are coming soon.
That’s caused 2 small-cap power thrust signals to fire.
After the July CPI print came in better than expected, it virtually guaranteed that a rate cut is slated for September.
That acknowledgement ignited a monster small-cap rally.
Just 3 weeks ago I discussed how when the Fed cuts rates, buy small-cap stocks. That rotation is well underway.
Today we’ll unpack a lot of new data insights.
Then I’ll offer up 2 powerful signal studies suggesting small-caps have a lot more upside.
Finally, I’ll zero-in on the best subgroup to play for the next year…and the highest ranked stocks in the bunch.
The small-cap rally that many have been waiting for could be in the early innings.
Small-Cap Power Thrust Signals
Our call for market breadth deterioration came and left quickly. Small-caps, in particular, saw a steep decline before a breathtaking rally.
From July 23rd – August 1st, the Russell 2000 fell 5.4%. Which ultimately led to a huge risk-on event.
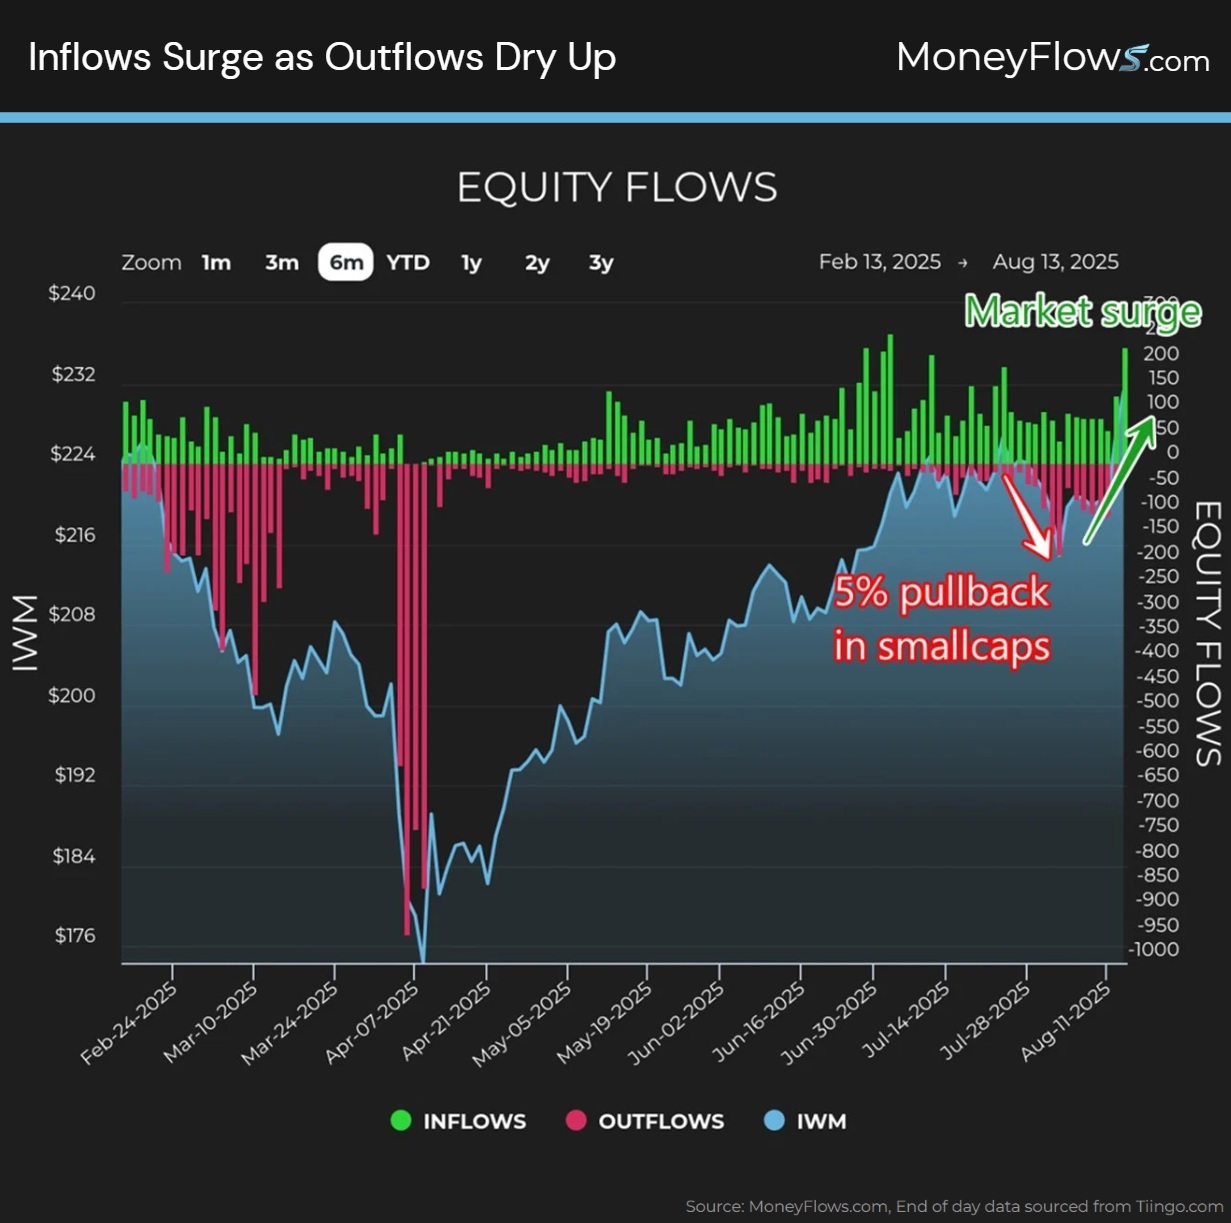
Below details our Equity Flows chart overlaid on the Russell 2000 ETF (IWM).
Since the August 1st low, outflows dried up and inflows surged:
So what changed over the last 2 days?
The odds of a September Fed rate cut surged to 100%. This is meaningful for the left-behind small-cap cohort.
Check this out. When we slice Tuesday and Wednesday’s flows data by market cap, 91% of inflows were focused in companies below $50B market cap:
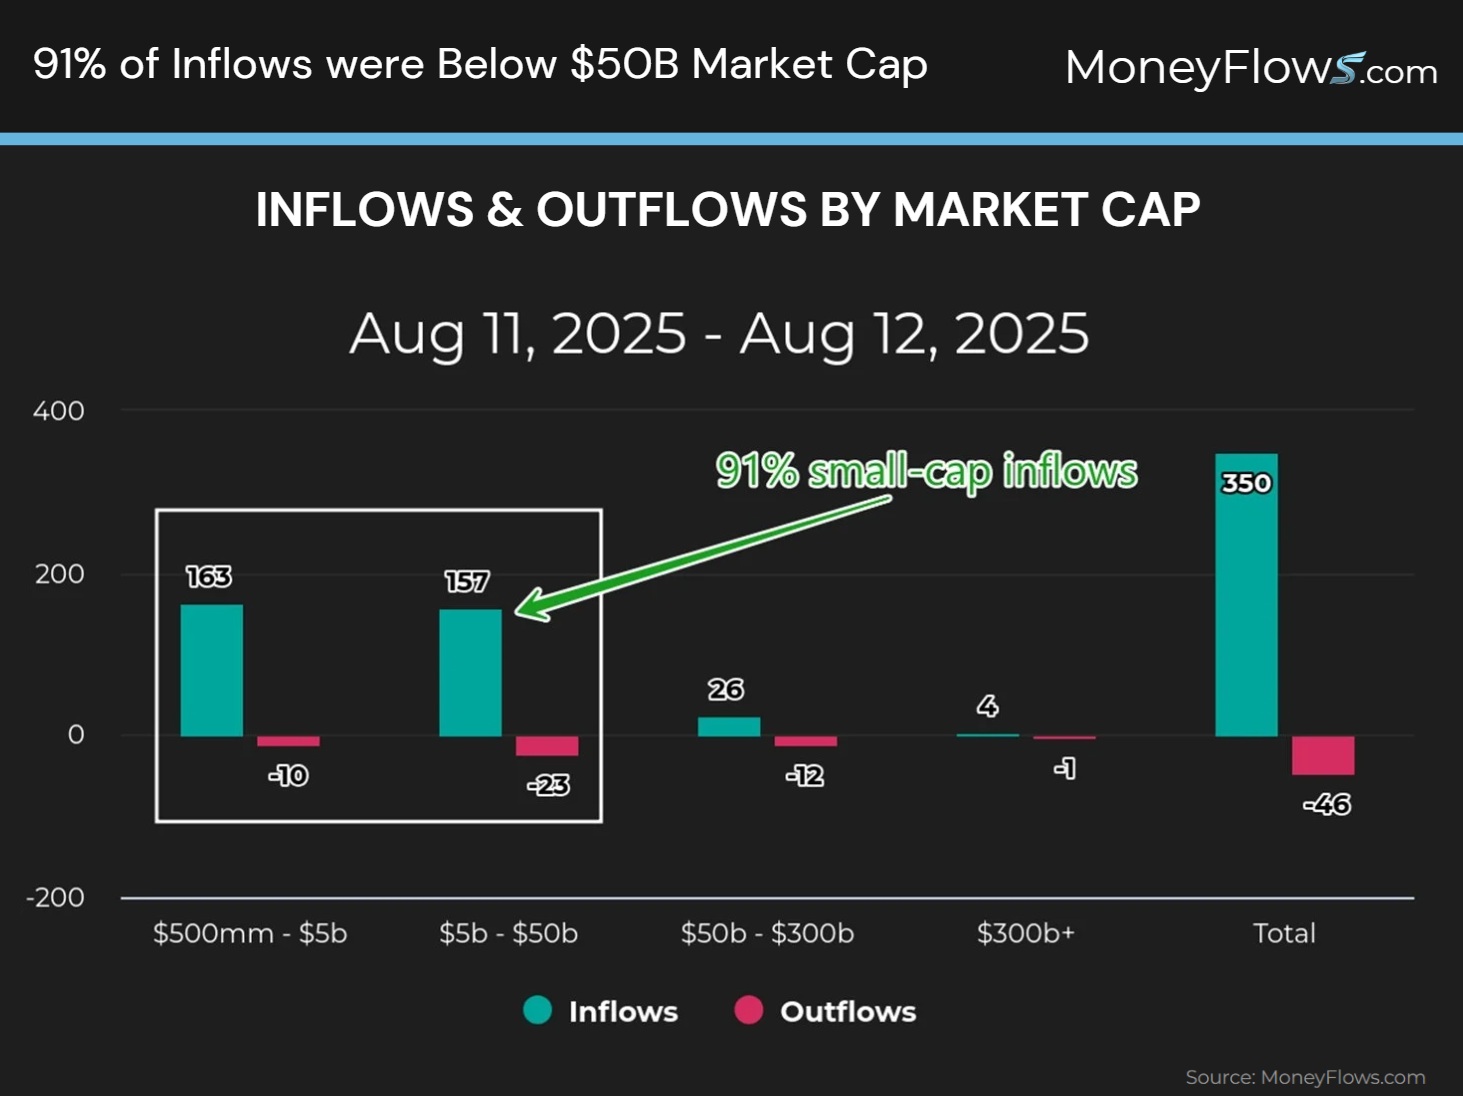
Folks, this didn’t happen by chance.
The Big Money knows who benefits from rate cuts: Smaller undercapitalized firms.
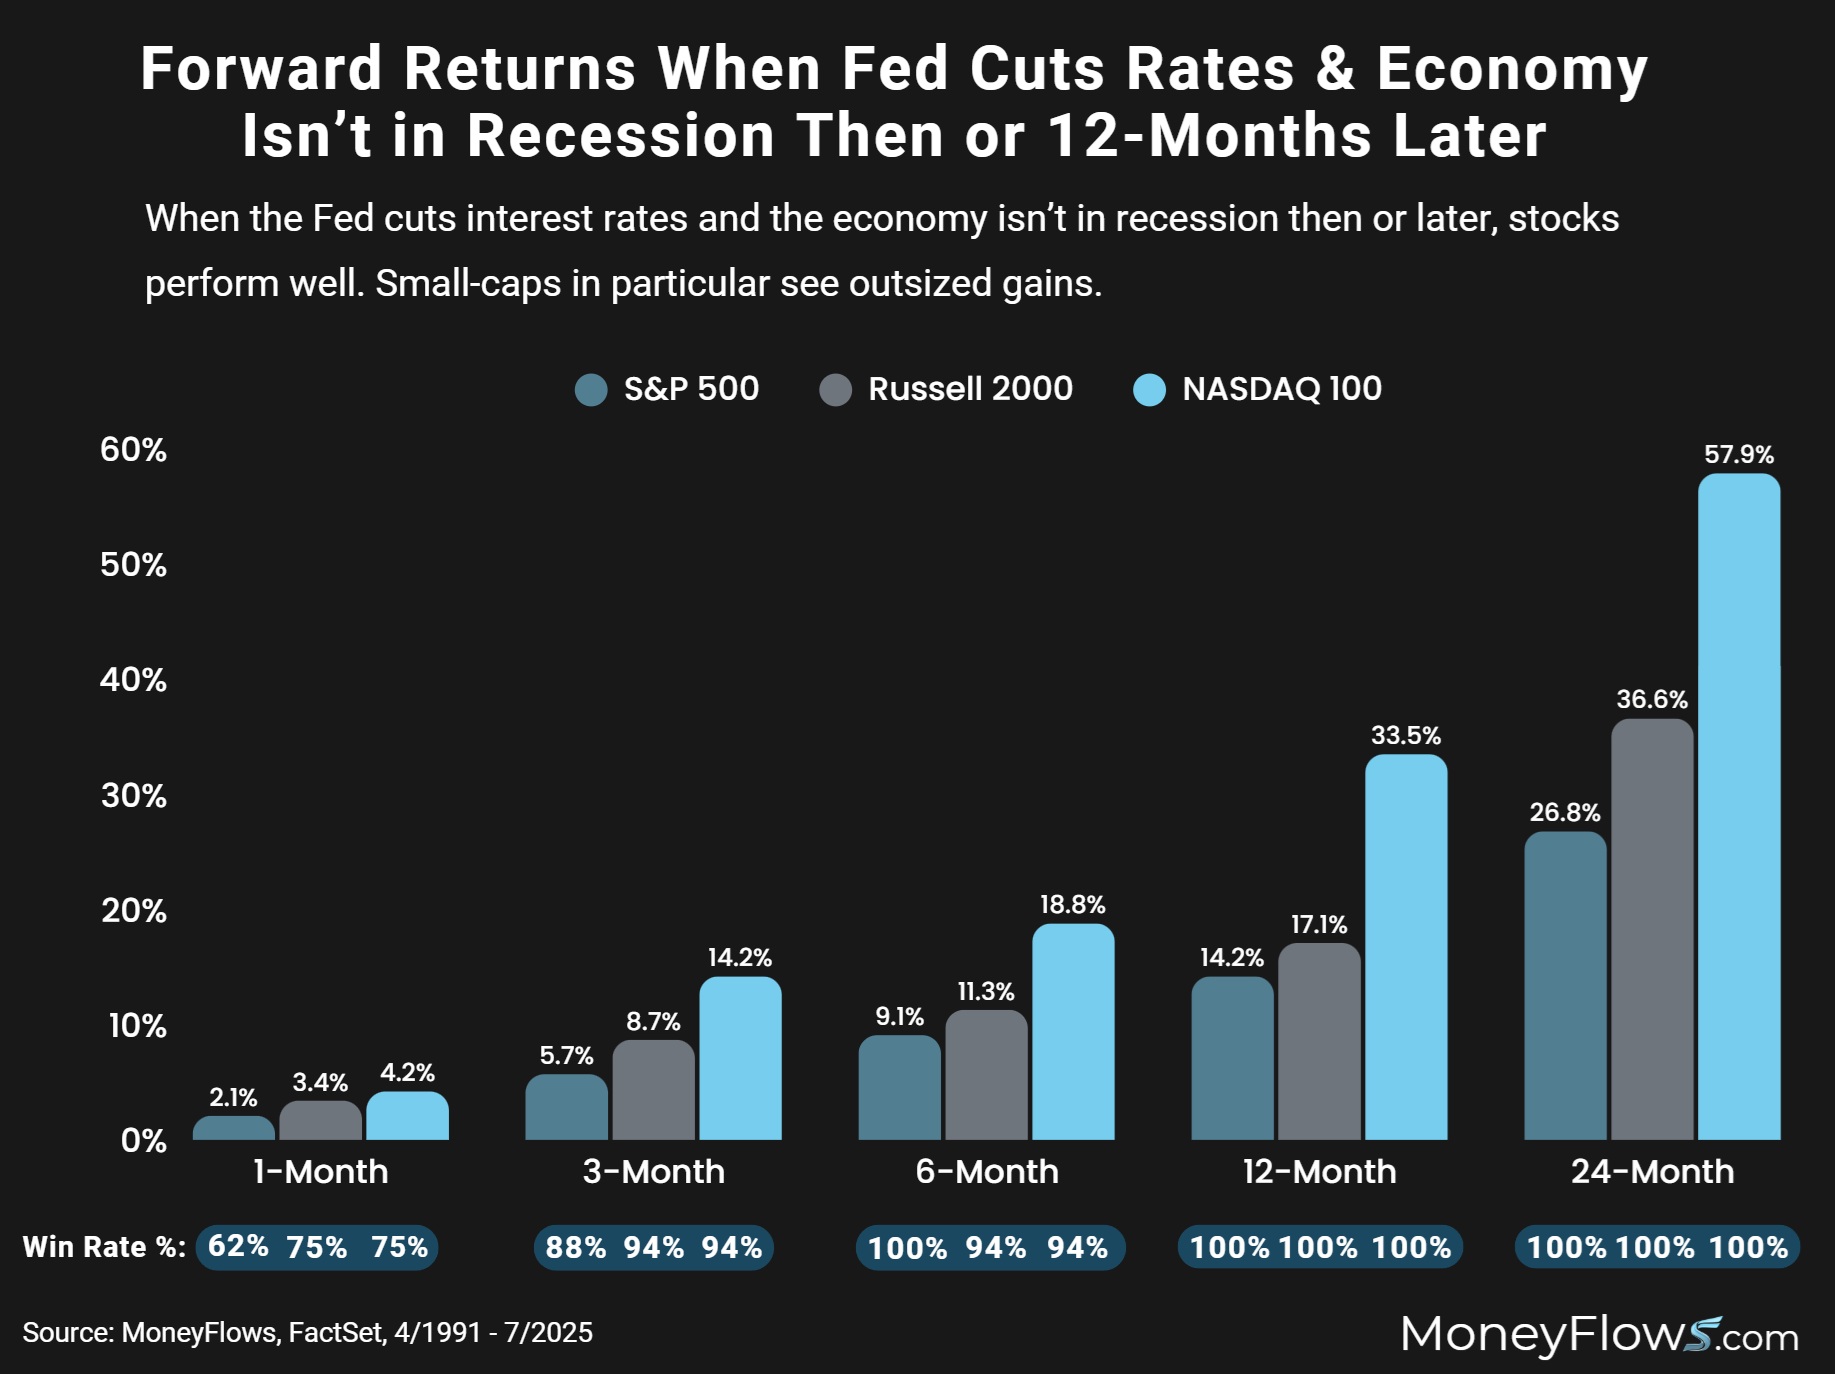
To revisit the study from my prior post, when the Fed cuts rates and the economy isn’t in a recession and doesn’t fall into recession 12-months later, small-caps soar.
Below, note how 12-months after rate cuts, the Russell 2000 jumps 17.1% on average:
The latest rally this week means that the party is just getting started. Not just because of the study above…but due to what technically happened this week.
A violent up-move of this magnitude rarely comes along. When it does, pay attention!
Check this out.
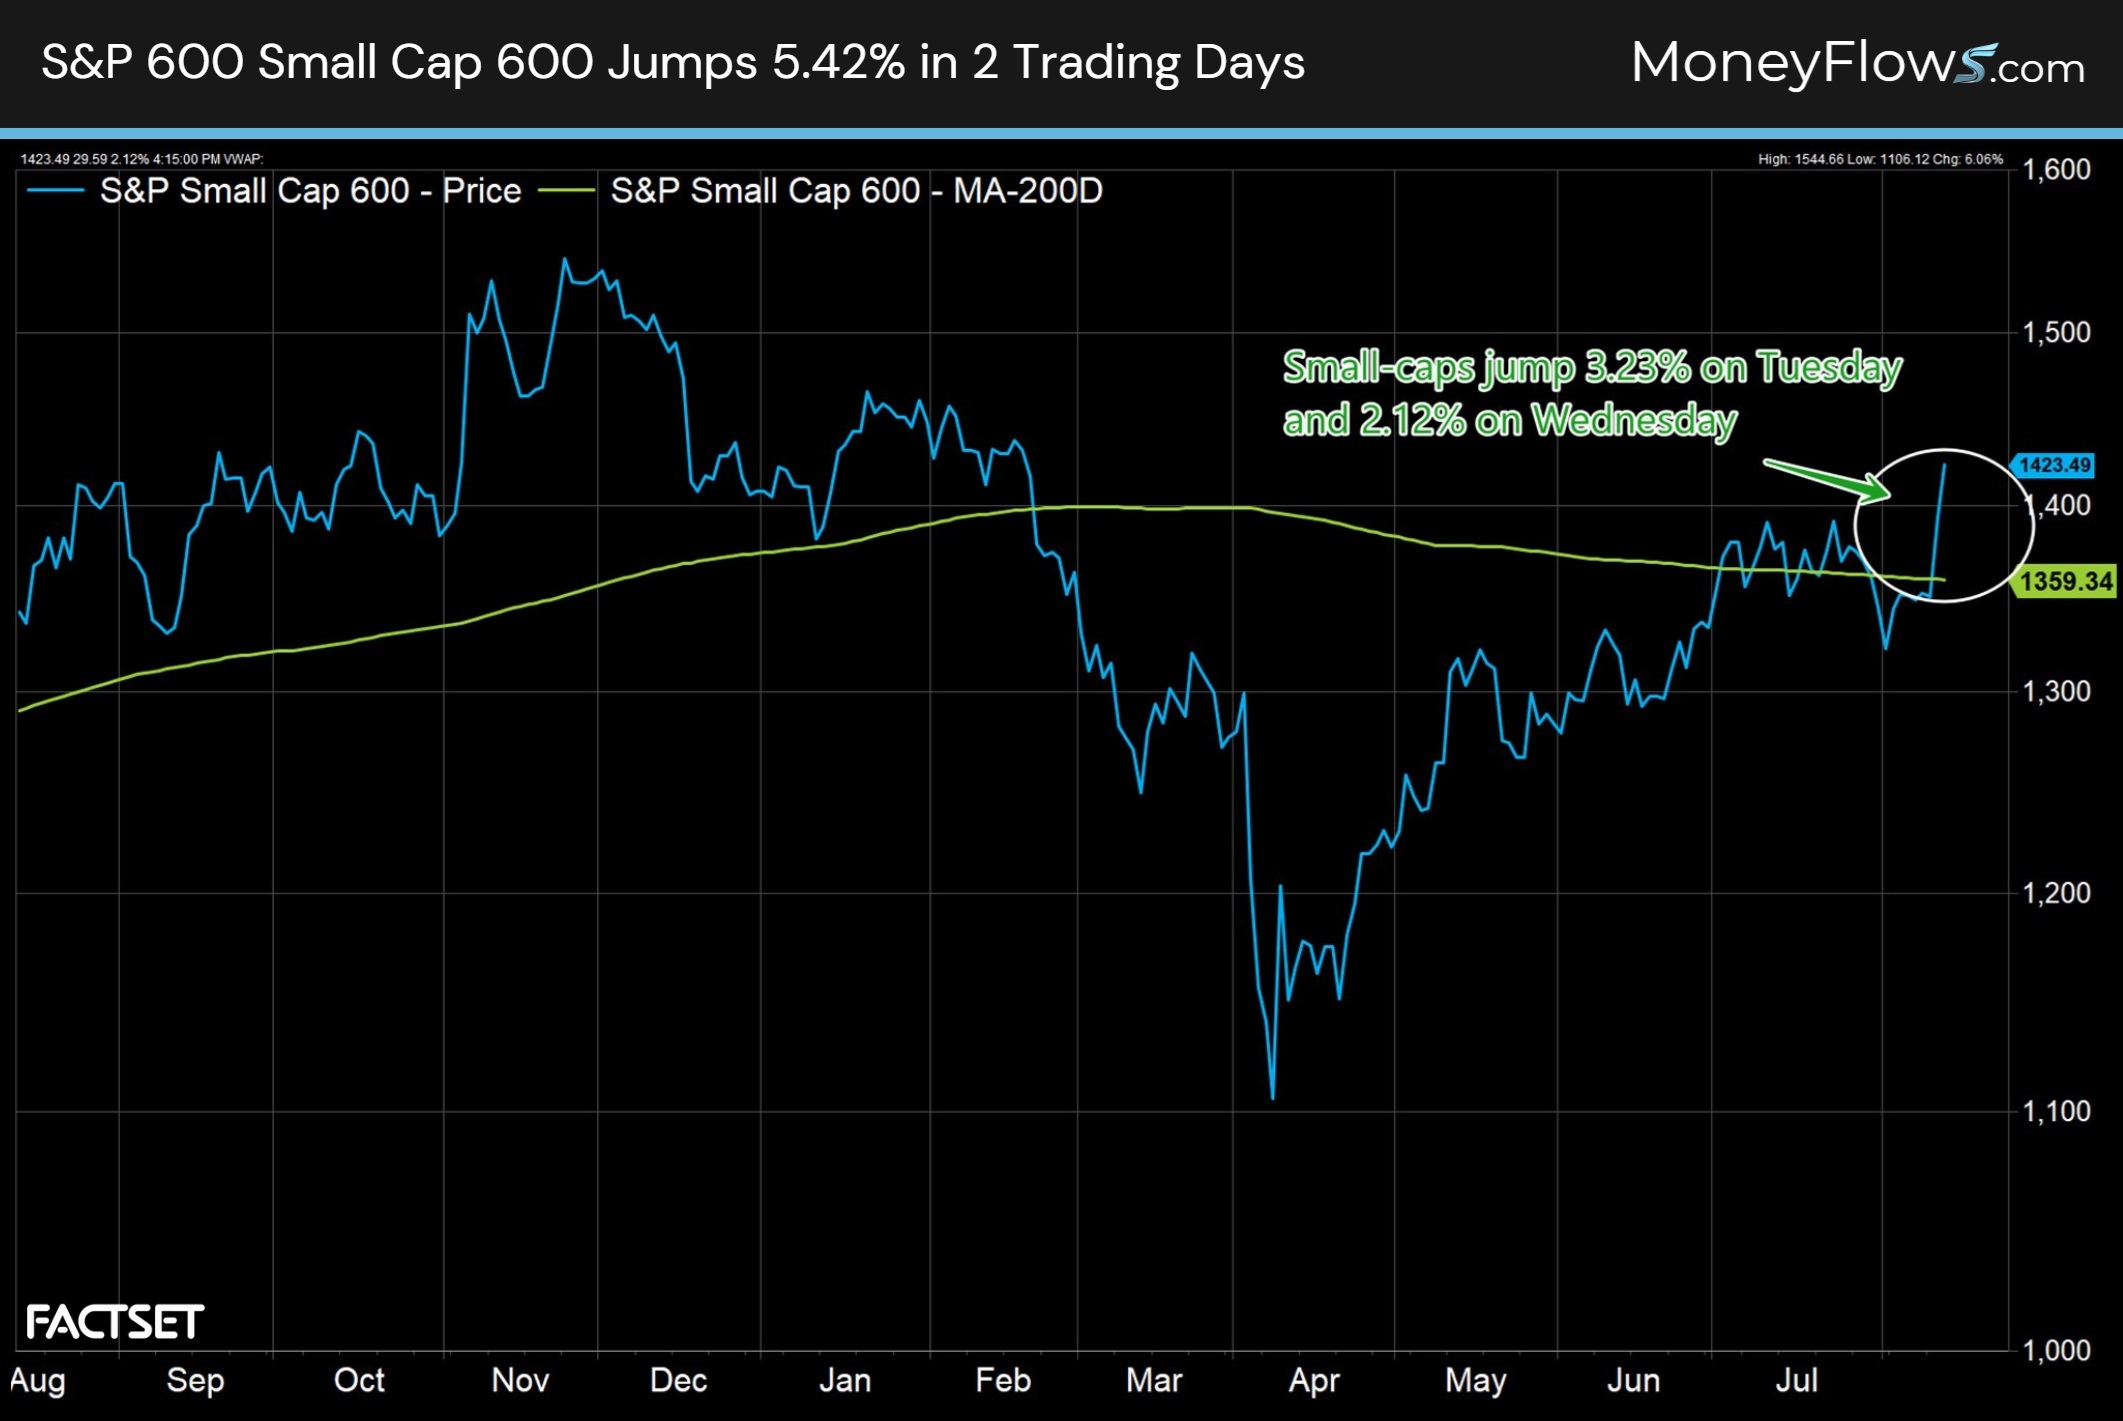
The S&P Small Cap 600 jumped an incredible 5.42% in 2 trading days.
This amounted to a 3.23% gain on Tuesday followed by a 2.12% gain on Wednesday:
Now let’s put this level of thrust into historical perspective.
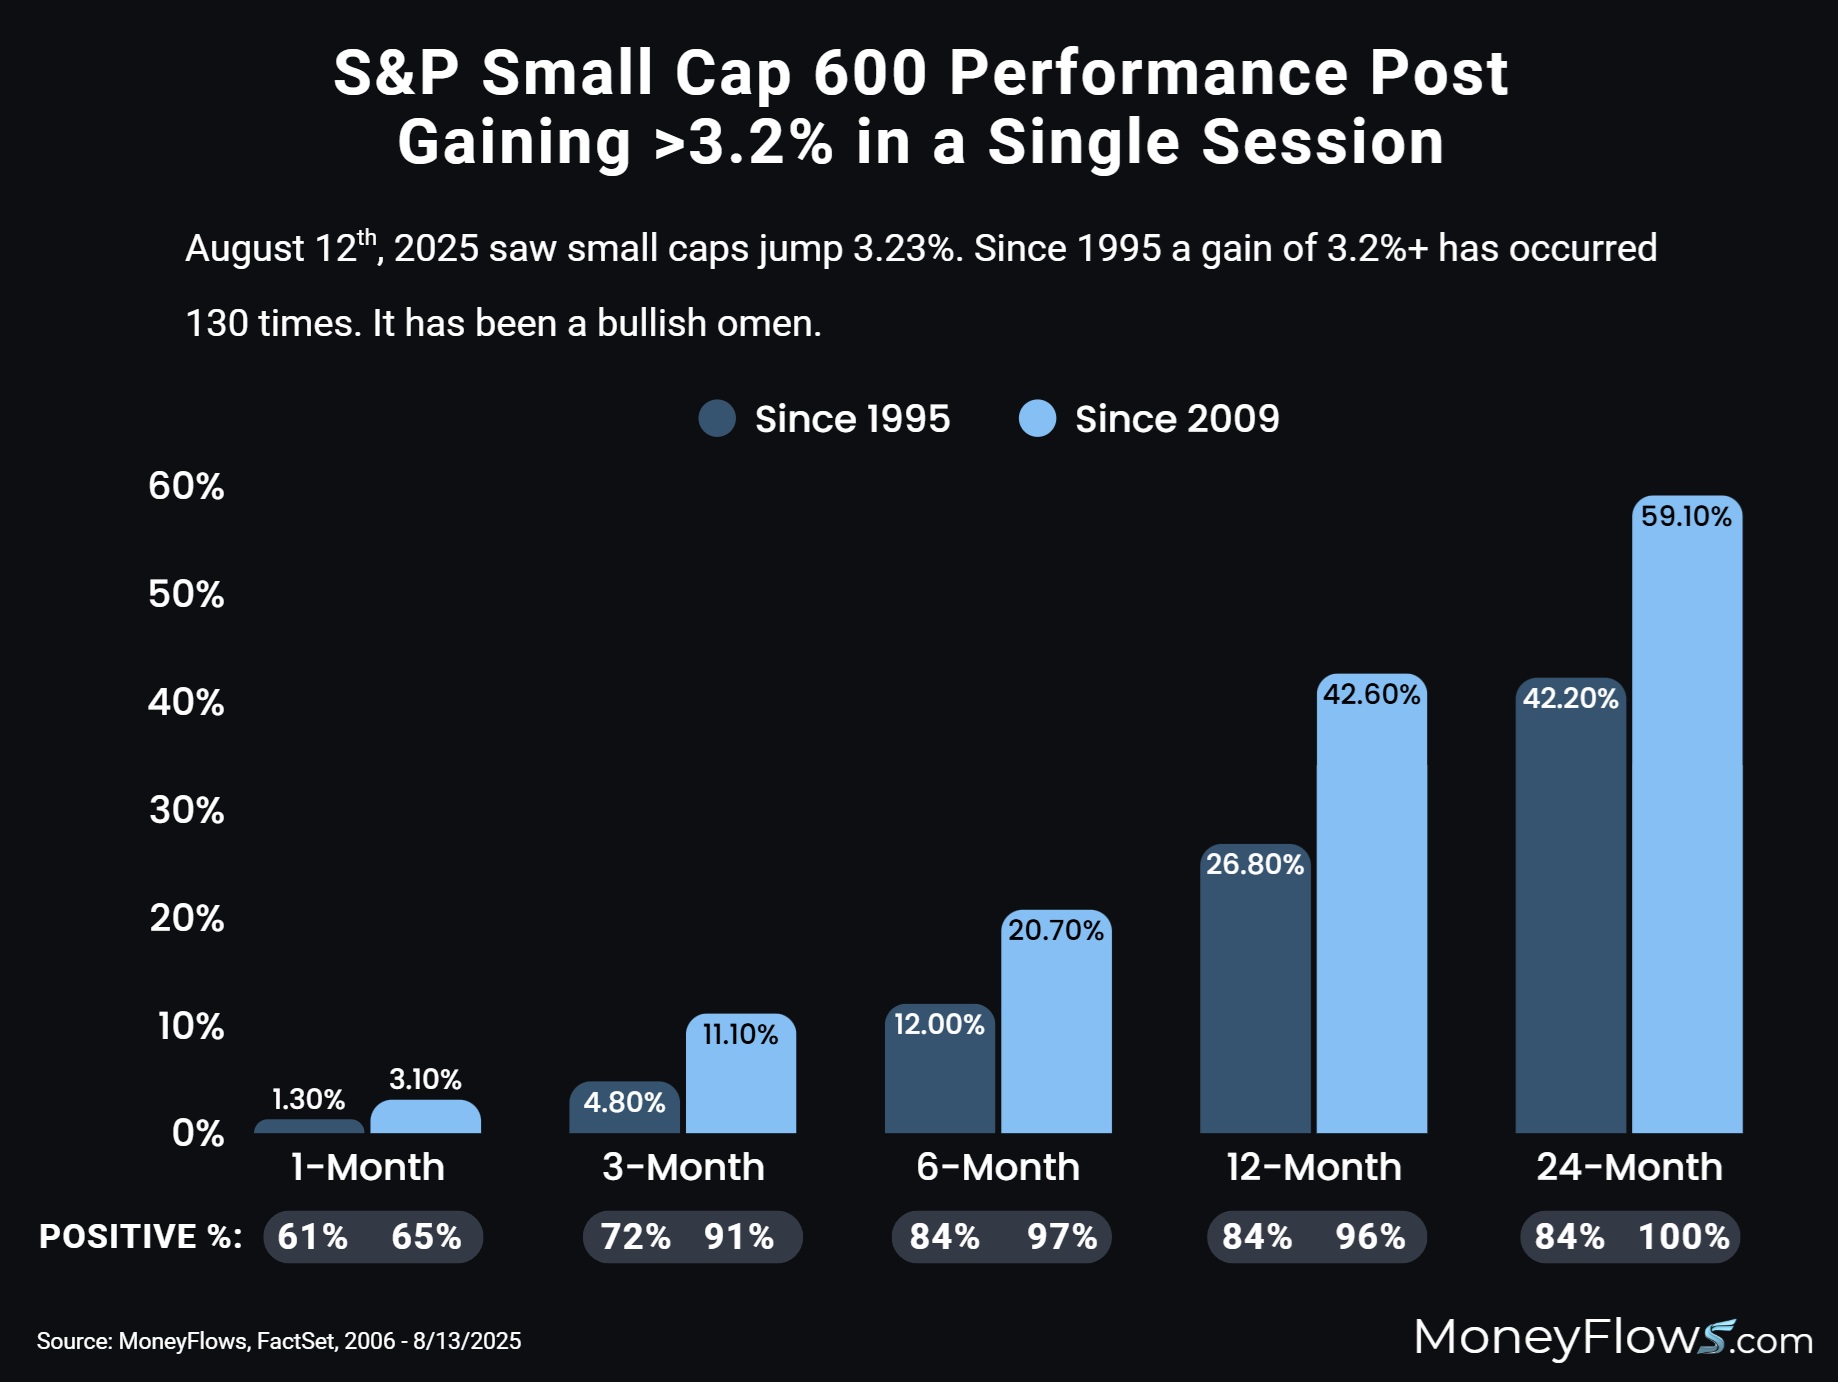
How rare is a 3.2% gain in the S&P Small Cap 600? Back to 1995, a gain of 3.2%+ has occurred just 130 times.
For the return study, I am showcasing all returns from 1995, and those post 2009 for added clarity on recent data.
Here’s what happens after small-caps rally 3.2%+ in a single session since 1995:
- 3-months later small-caps rally 4.8%
- 6-months later they jump 12%
- 12-months later small-caps surge 26.8%
Here’s what happens post 2009:
- 3-month jumps of 11.1%
- 6-month rips of 20.7%
- 12-month surges of 42.6%
This study alone suggests that you don’t want to underweight this group heading into 2026:
This should bolster your mood for small-caps…if not, there’s more!
Let’s do a similar study on the 2-day rally thrust.
On August 13th, the S&P Small Cap 600 jumped 5.41% on a 2-day basis. A climb of 5.4%+ has only occurred 66 times back to 1995.
Incredibly, it forecasts breathtaking gains.
Since 1995, whenever the S&P Small Cap 600 gains 5.4% or more in 2 trading sessions here’s what happens next on average:
- 6-months later they jump 14.2%
- 12-months later they climb 36%
- 24-months after they average 51.4% gains
From 2009, those gains are only larger:
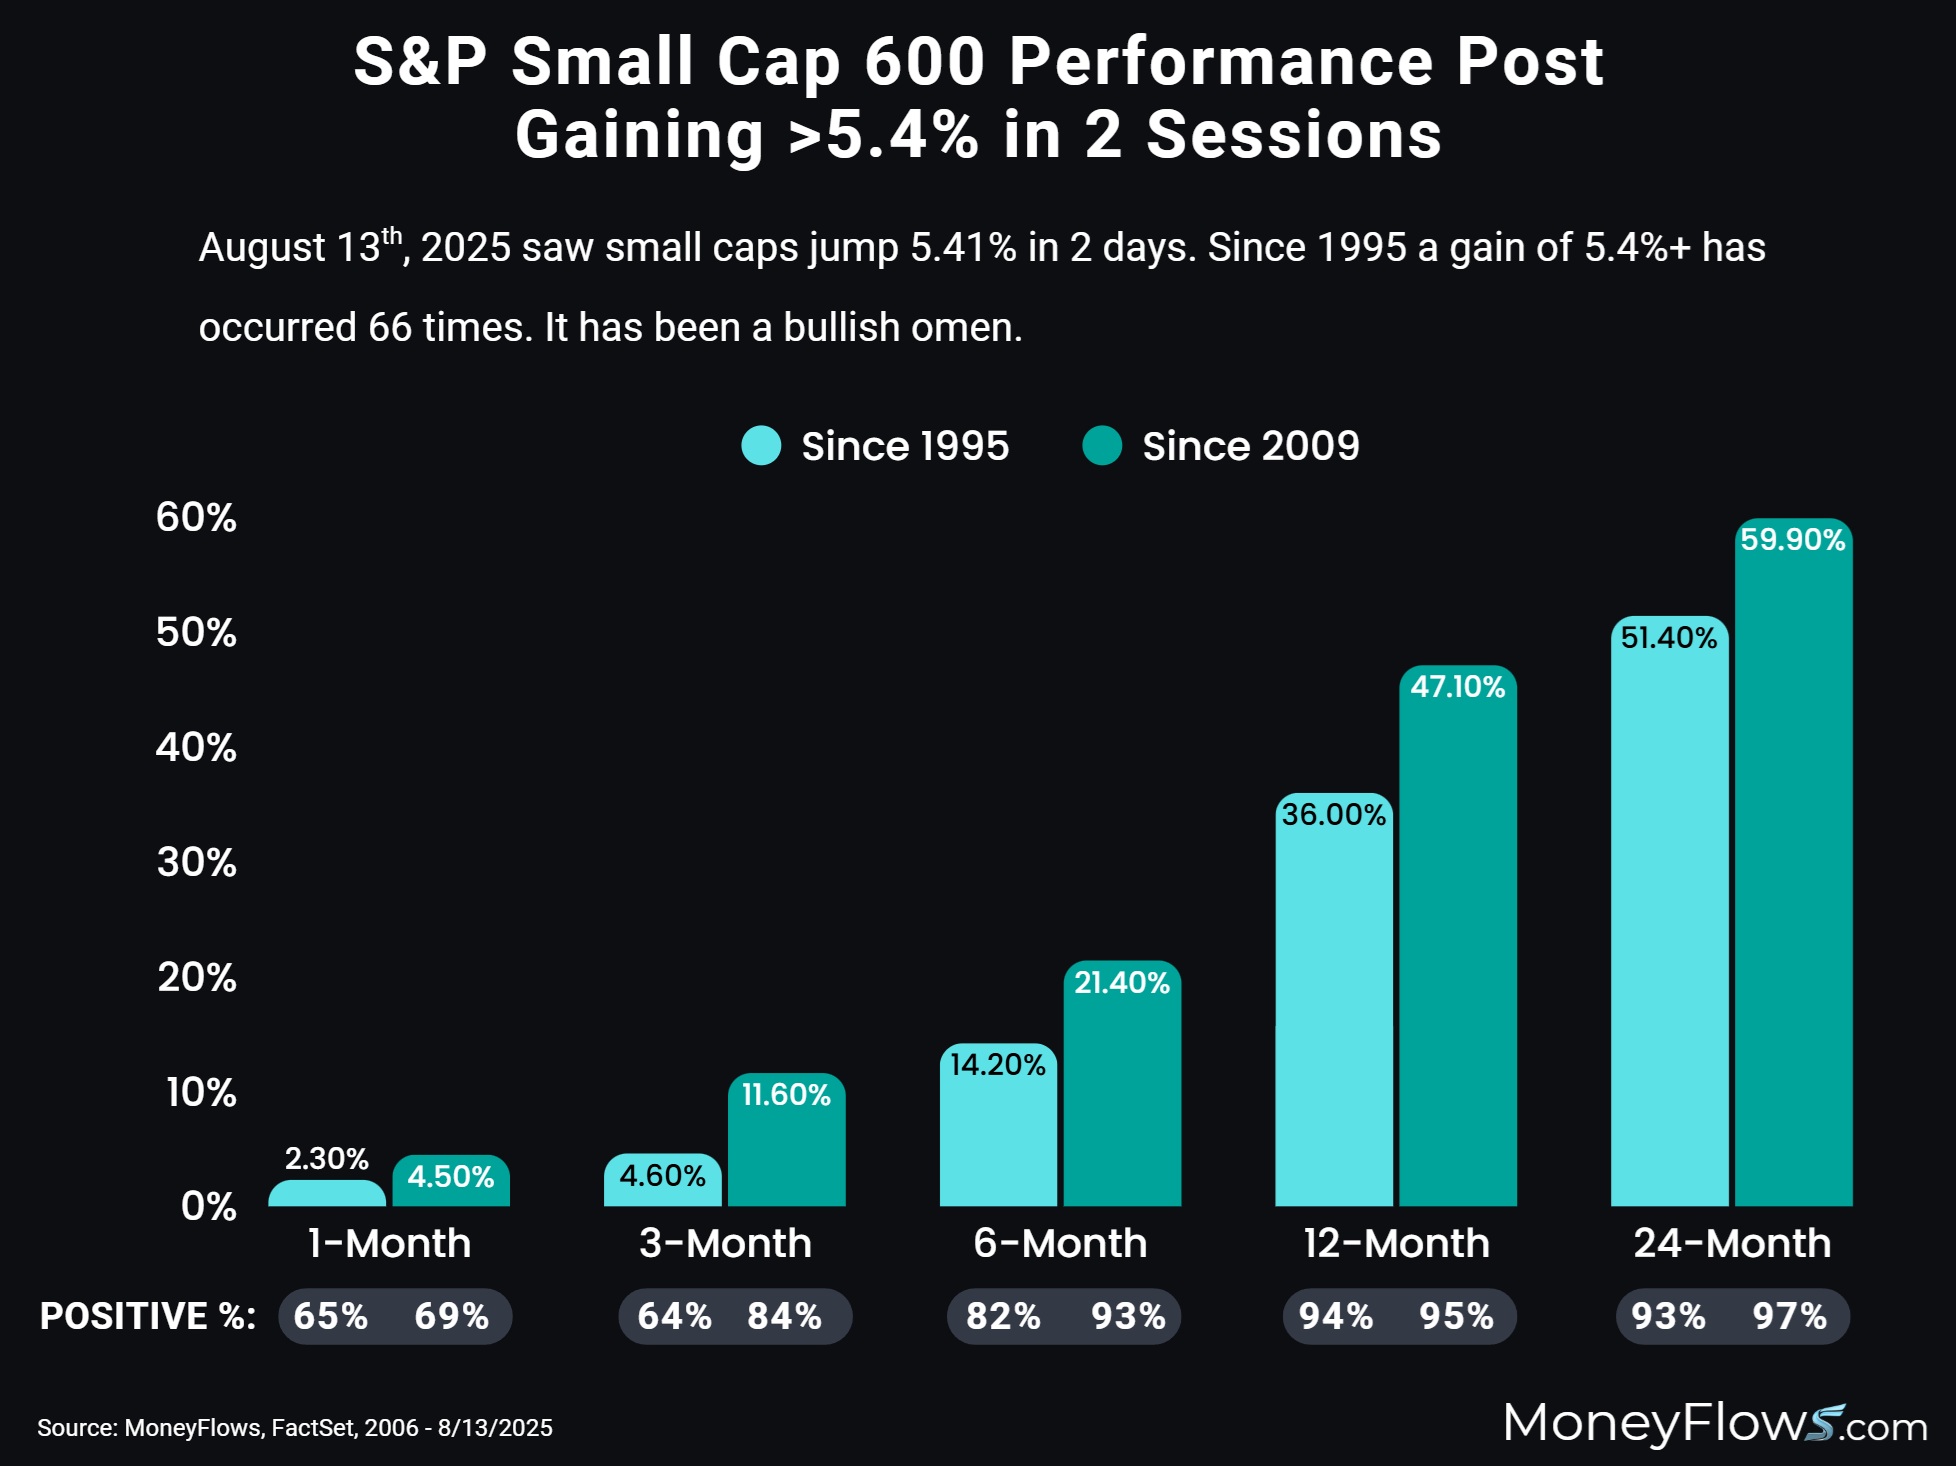
The message is clear – start broadening out your stock list.
As rates come down, this will unlock pressure on smaller companies that have been penalized for years.
There’s a whole world of alpha outside of the Mag 7.
Given these mammoth shifts this week, expect new leadership to emerge. Our data shows the individual names getting accumulated day after day.
For PRO and Advisor level subscribers, I’m adding one subgroup below that is slated to jump more than the small-cap benchmarks.
Here’s an updated website navigation video. It covers our research reports too:
If you’re looking for alpha-generative data, we’ve got you covered.
Keep it simple…go with the flows.
Inside the small-cap rally a few subgroups drove the train.