
Market Rally Breadth & Future Projections
The equity rally has been breath-taking.
A month ago, the crowd capitulated.
Today they are buying in droves.
Let’s unpack the market rally breadth & future projections.
Here’s an interesting fact. Stare into a mirror and your reflection will appear double the distance. Standing 5 feet away from the looking glass will reflect an image with a virtual distance of 10 feet.
We all know the actual distance is 5 feet, yet our brains recreate the distant image by looking through the metal.
This looking through concept is essential when it comes to the stock market.
Investors with the ability to think forward, envisioning tomorrow’s situation – that’s the secret to success.
Every great investor I’ve ever met had this skill…focusing out in the distance rather than being influenced by the prevailing media narrative.
Lucky for us, our unique research lens has a data-driven forecasting ability.
A month ago, we saw an incredibly bullish setup as capitulation was extreme.
Today, the other extreme is flaring. Breadth has expanded violently.
I’ll seek to answer 2 burning questions on investors’ minds today:
- 1. Are we due for a healthy pause? I believe so…and we’ll unpack why.
- 2. Will stocks make all-time highs in 2025? The evidence suggests YES.
Let’s now look through the money flows landscape. We are in a raging bull market.
Market Rally Breadth & Future Projections
Rarely do extremes last.
From the recent lows, stocks have surged. And the Big Money Index (BMI) is ramping. In fact, we just eclipsed February highs for this indicator.
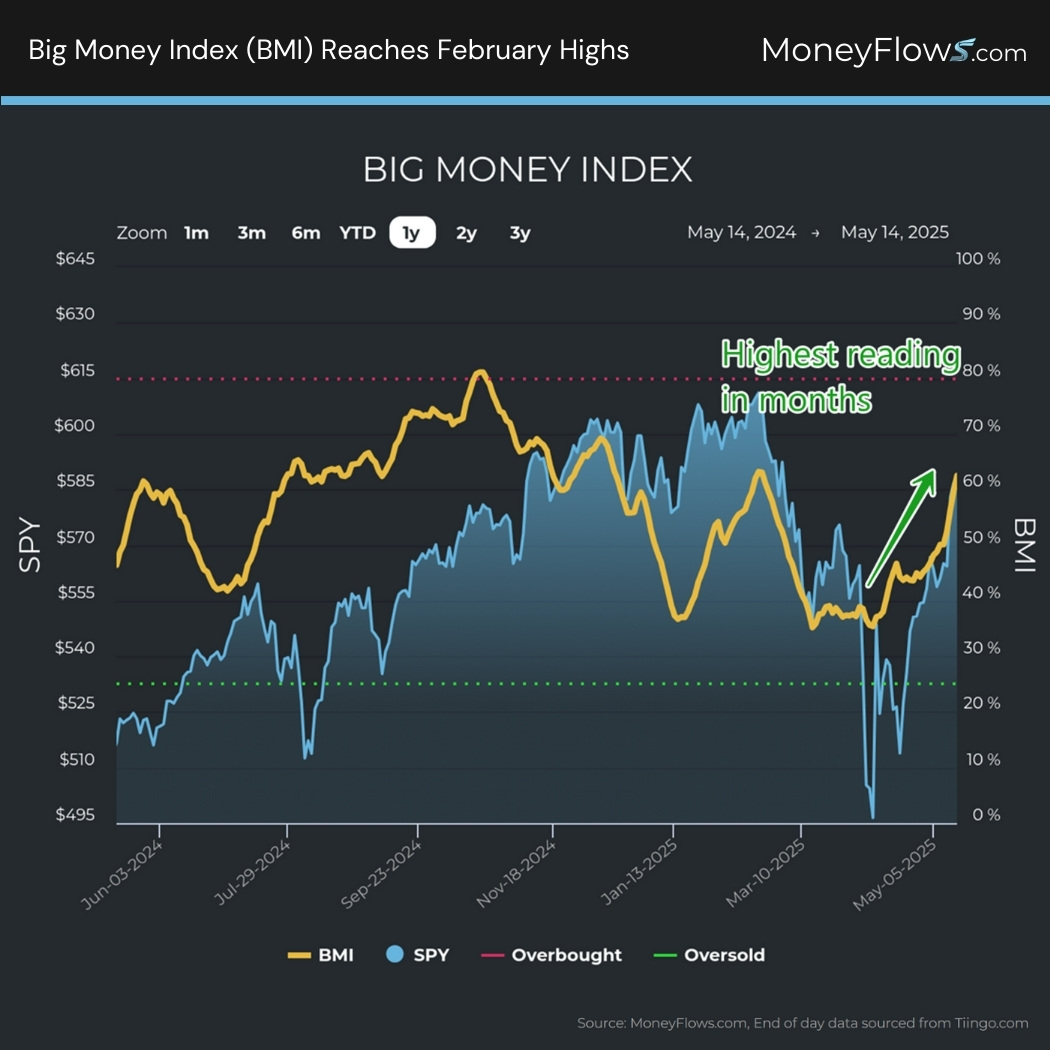
Let’s now unpack this incredible snapback.
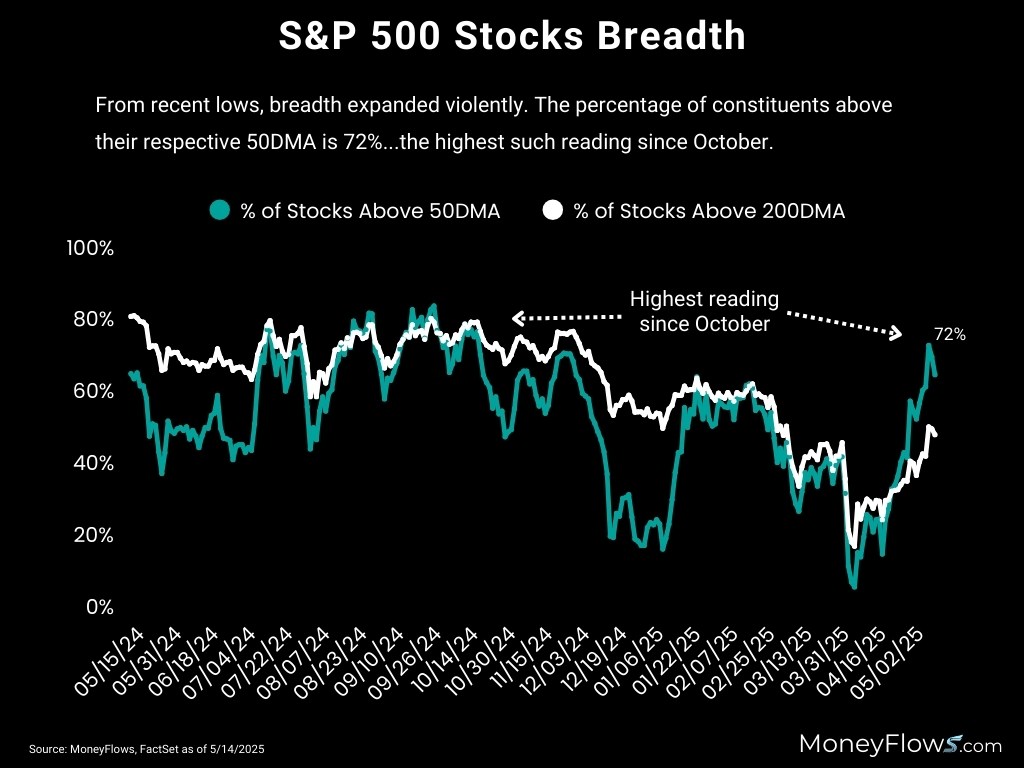
First, let’s measure traditional breadth indicators for information. I like to check in on the popular 50DMA and 200DMA of S&P 500 constituents.
Recently, the percentage of S&P 500 stocks above their 50-day moving average surged to 72%. This is the strongest breadth since October 2024.
Check it out:
Understanding what is happening is interesting.
Understanding why this is happening is more powerful.
Next, let’s marry these traditional breadth indicators with our equity flows data. Here’s where having a looking glass comes in handy during times of distress.
The powerful rally was ignited because forced selling (capitulation) grounded to a halt. It’s simple. When selling stops, equities have nowhere to go but UP.
Below showcases the same moving average data on the S&P 500, and below that I’ve included our daily equity flows.
Notated is the extreme capitulation from April, marking the market bottom.
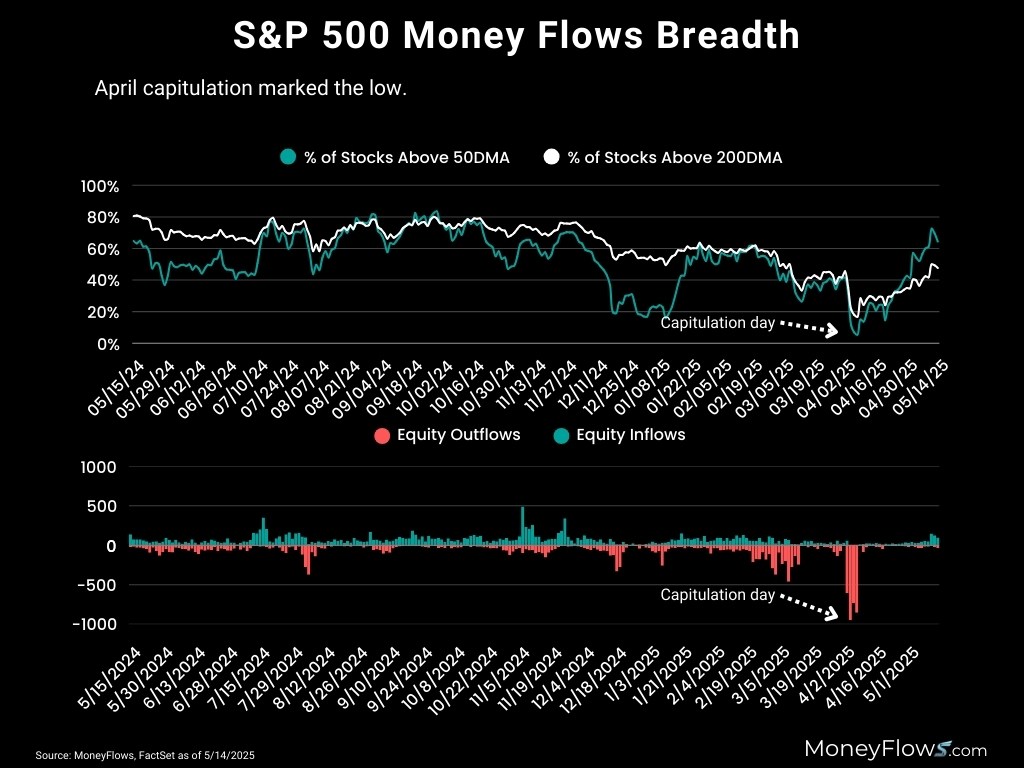
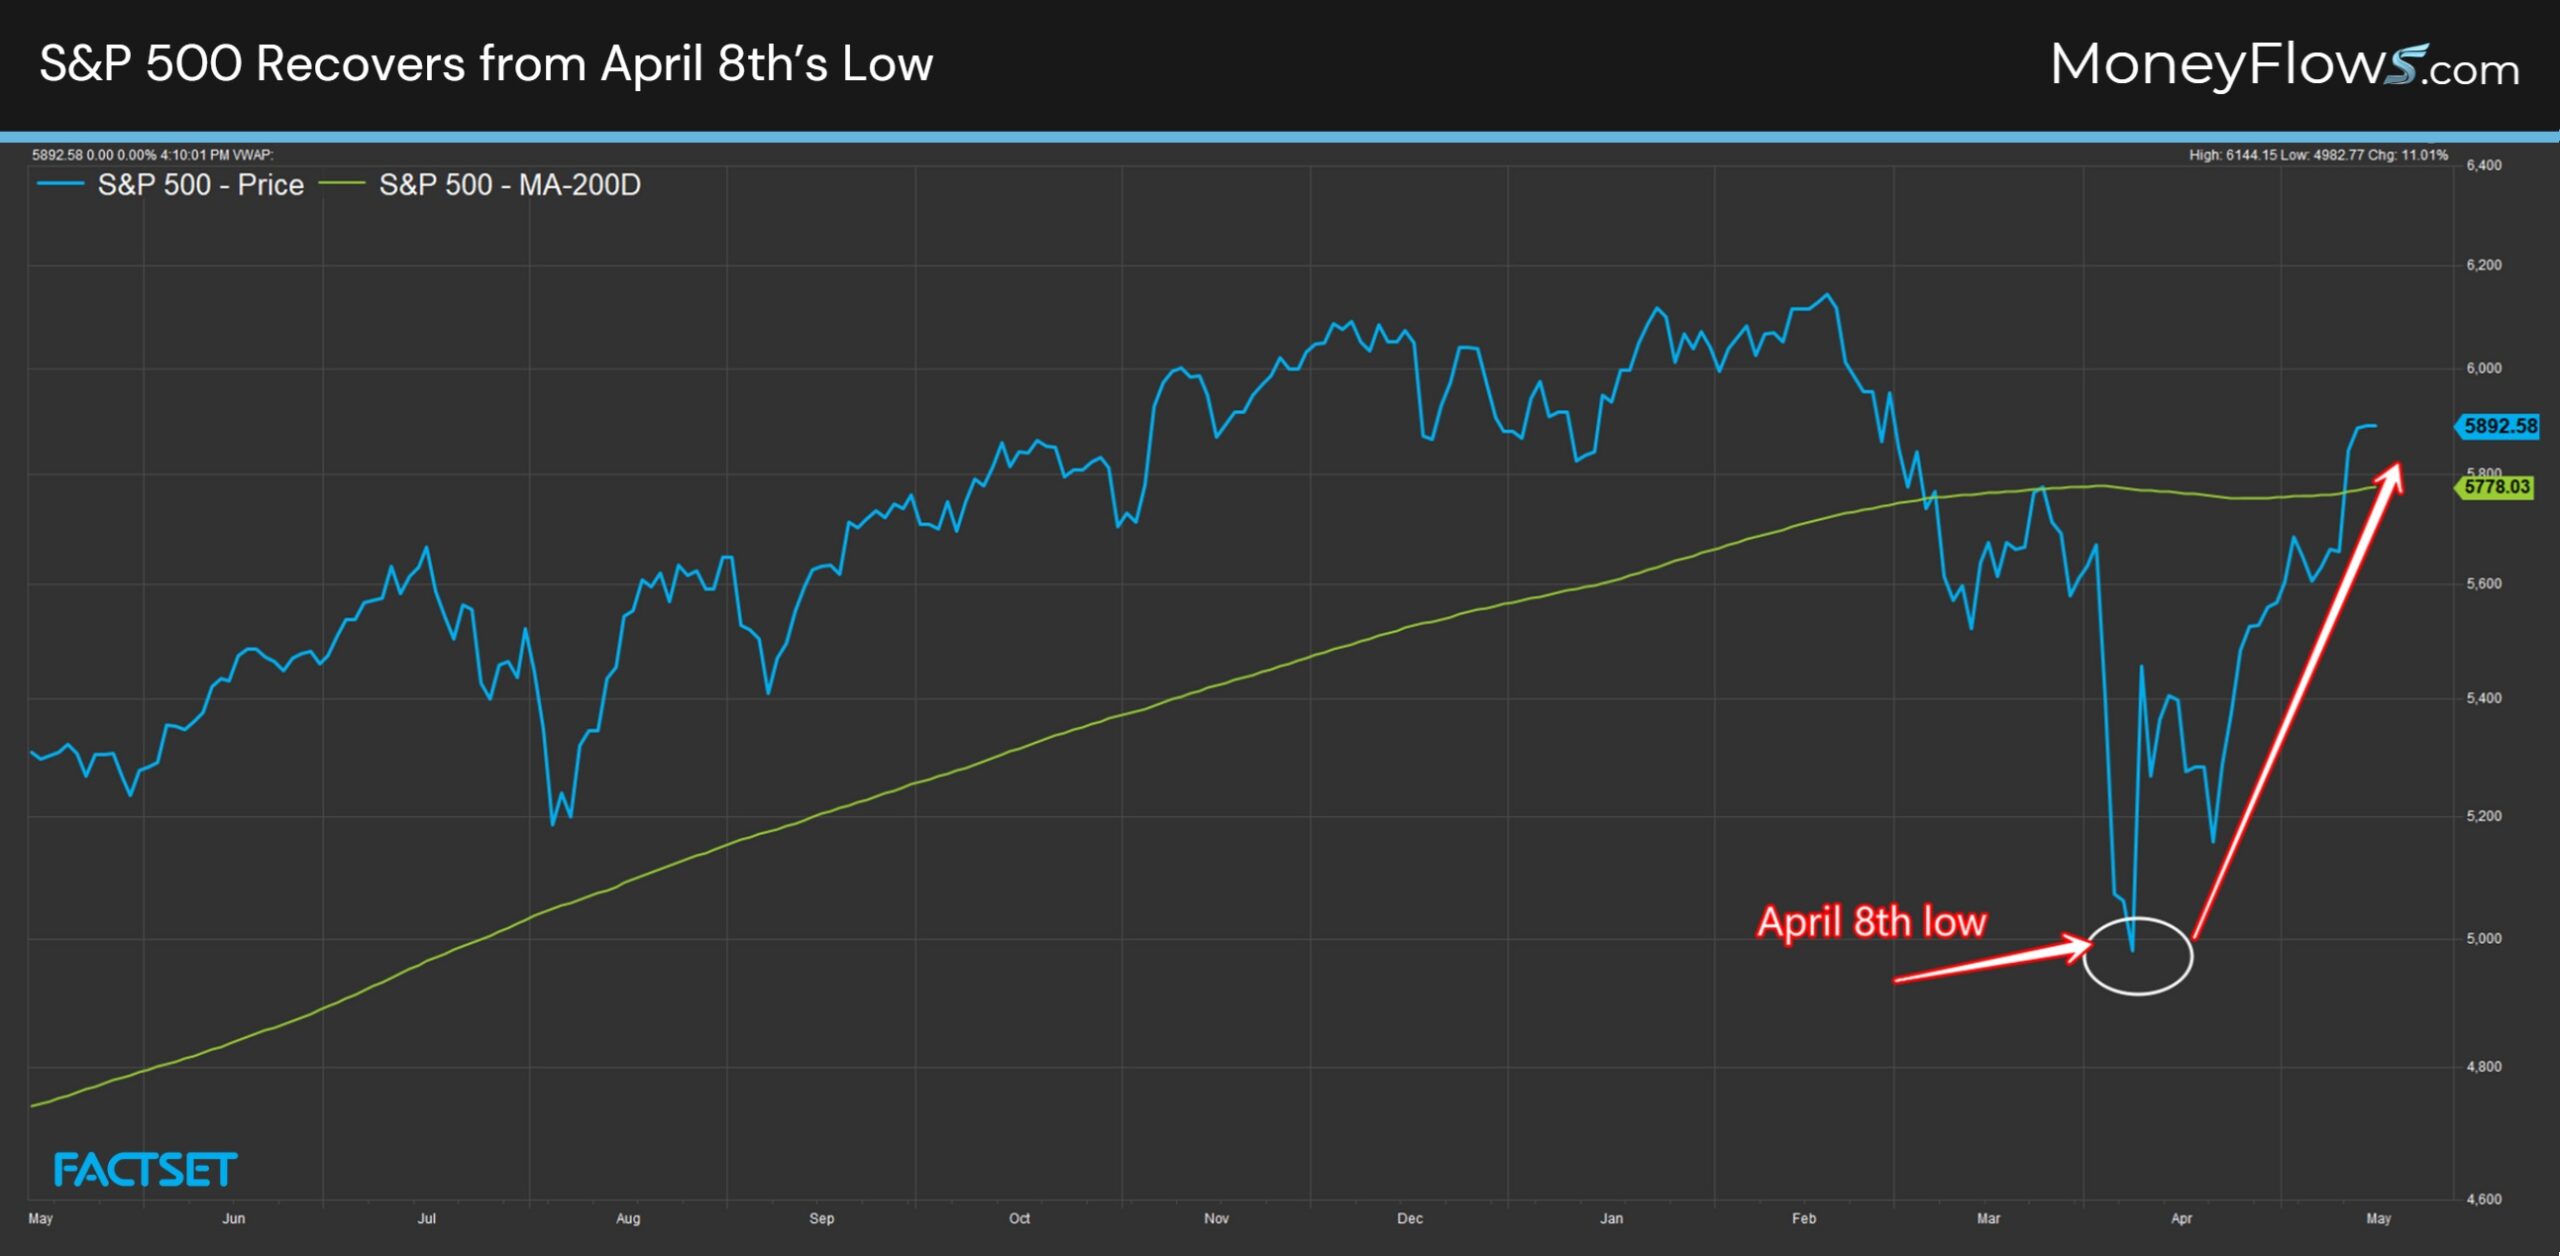
Those large red outflows occurred during 4 trading days: April 3rd – 8th. One look at the S&P 500 from the day the outflows stopped (April 8th) it’s apparent the relationship that capitulation has with equity prices:
After spending years on institutional trading desks, we’ve learned 2 things about extreme capitulation:
- First, capitulation rarely lasts forever
- Second, capitulation ignites crowd-stunning rallies
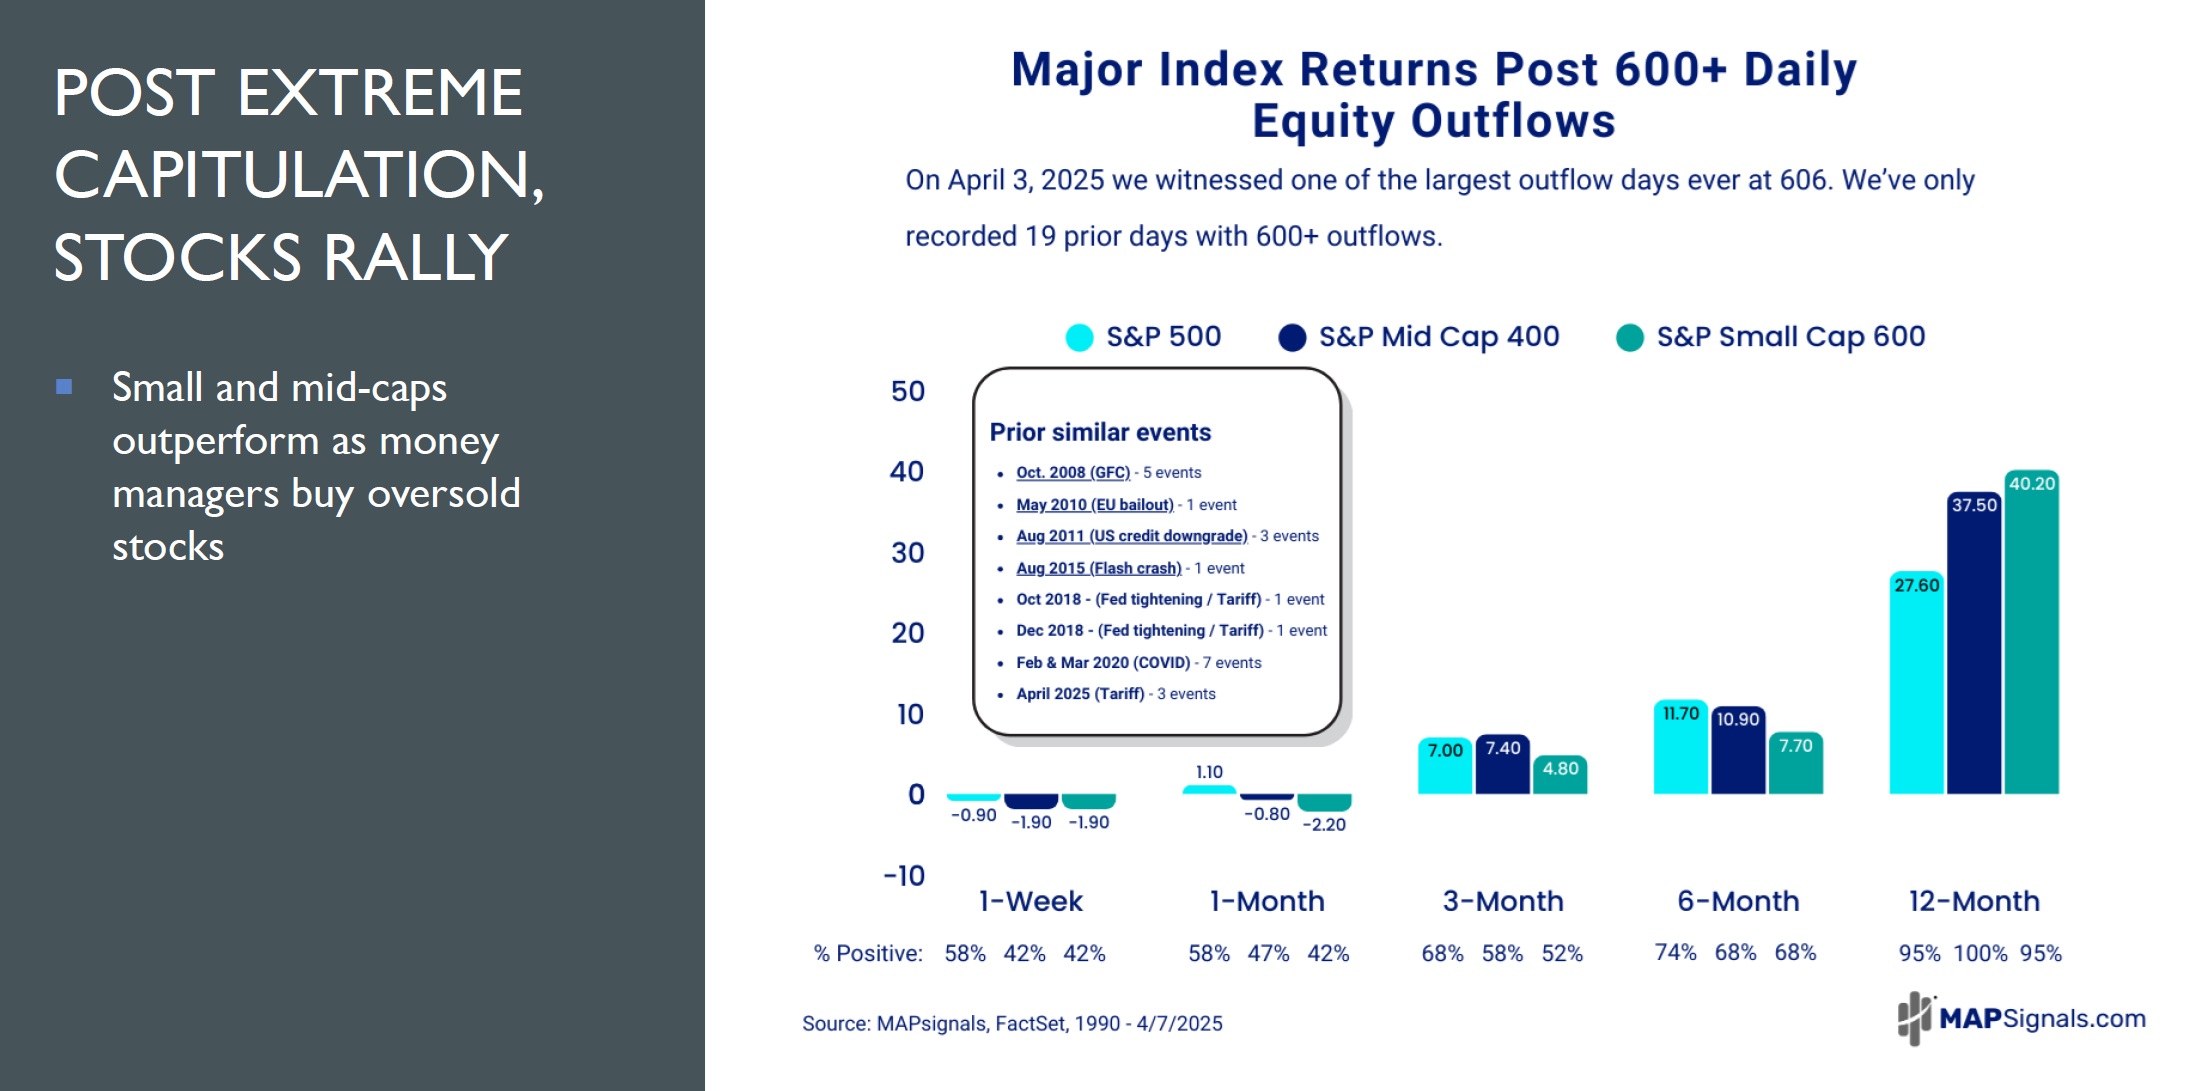
Below quantifies the average S&P 500, S&P Mid Cap 400, and S&P Small Cap 600 average returns post daily equity outflows of 600 or more.
Returns 3, 6, and 12-months later are quite positive for all indices with market-beating average returns.
Historically, you’re supposed to buy during these liquidation events…this past month surely didn’t disappoint.
Now that stocks have screamed higher, what are we to do now?
That’s the million-dollar question!
Clearly, stocks may in fact be near-term overbought by traditional measures…I’d expect a healthy giveback is in order.
If you were fortunate enough to have bought stocks during the crisis, odds are you’re sitting on big profits. Taking some off the table isn’t a terrible idea.
That said, I wouldn’t stay cautious too long.
Something super rare occurred recently…indicating new highs are coming for stocks in soon order.
On May 2nd, the S&P 500 capped off a 14.1% gain in 17 trading sessions.
Have a look:
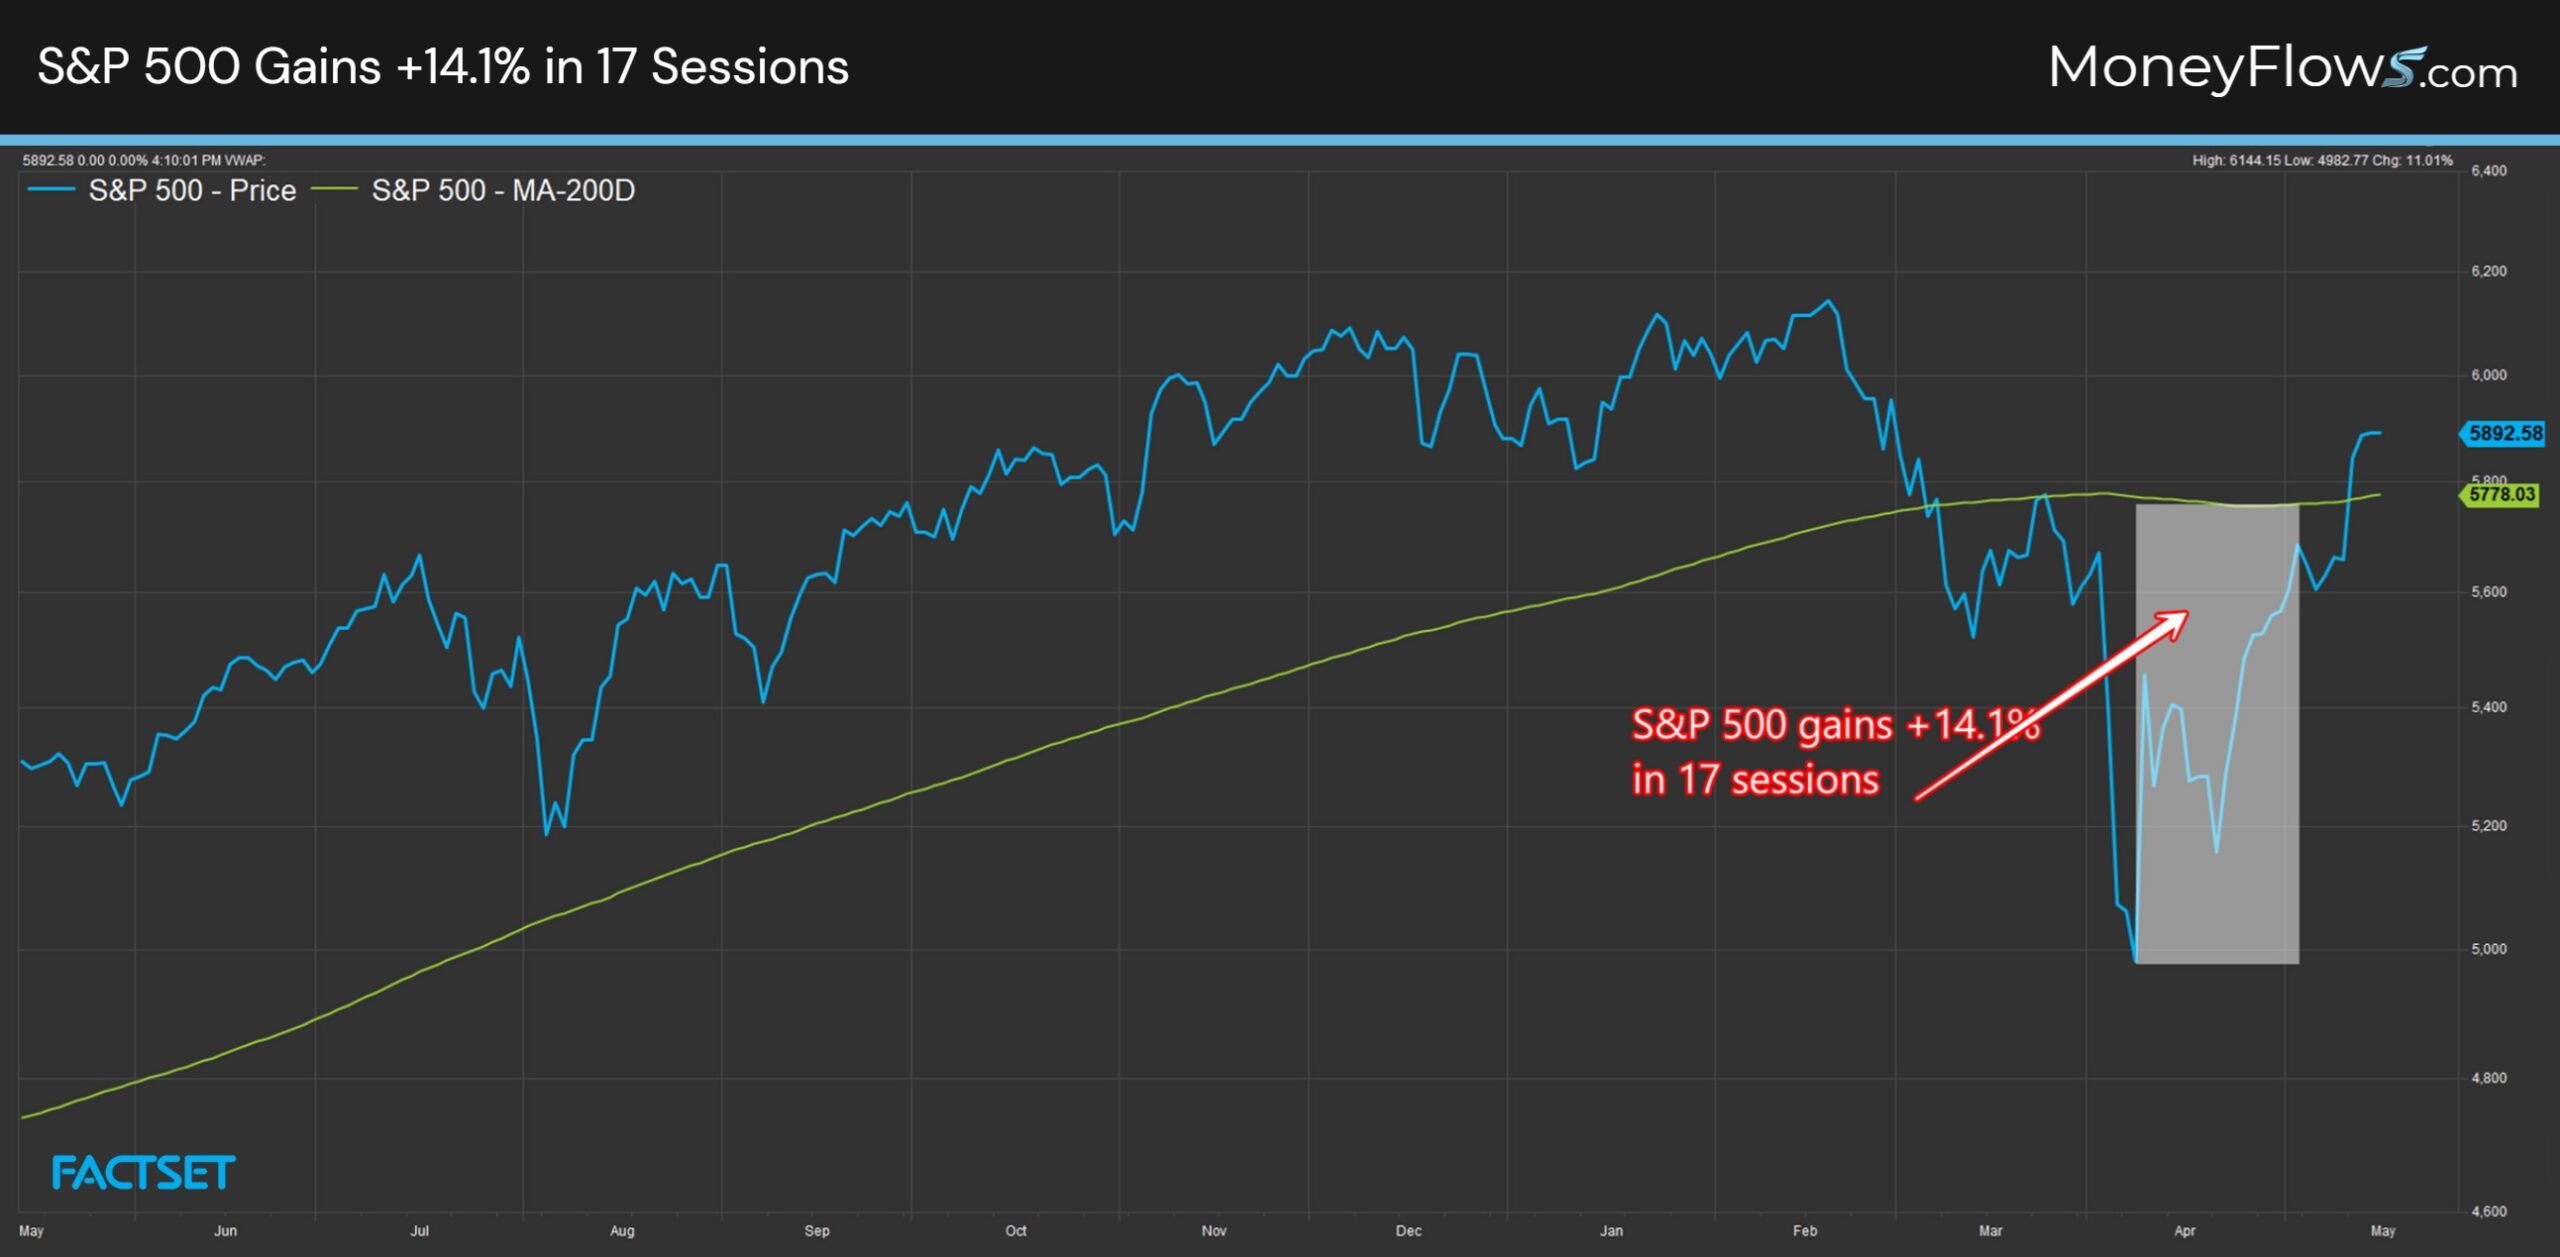
This may not appear significant from the eyeball test.
We crunched the numbers and found something staggering about this level of extreme bounce back.
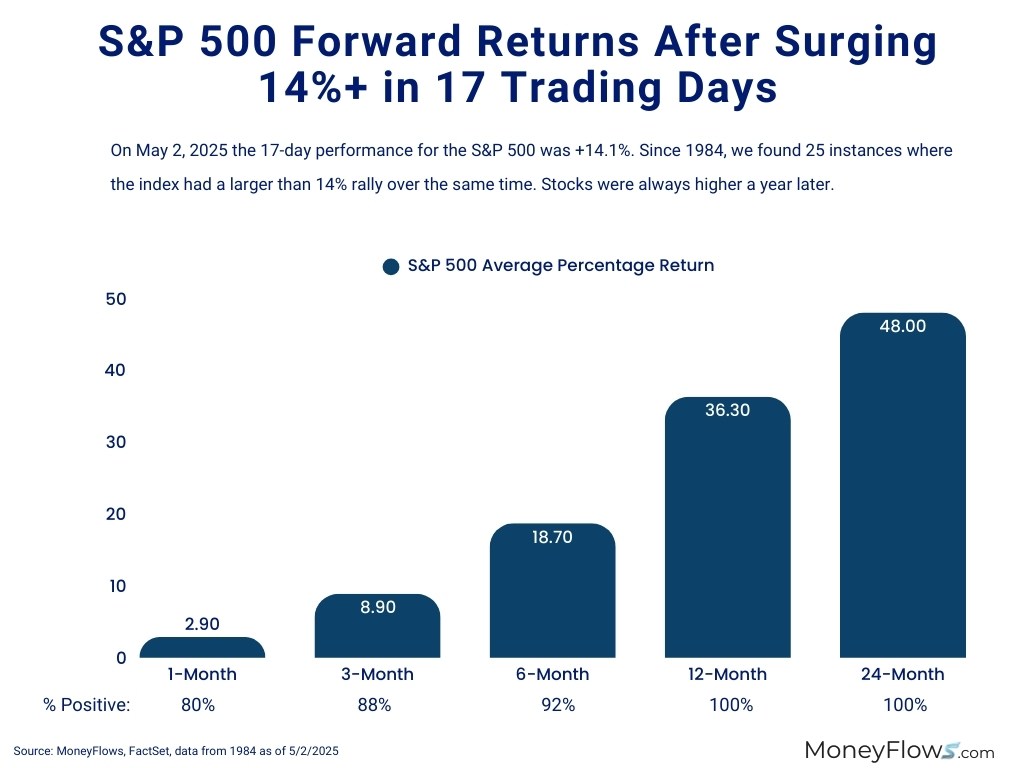
Over the past 4 decades since 1984, the S&P 500 has only recorded 25 instances where the index gained 14%+ in 17 trading sessions.
Future market projections are nothing short of epic.
Here’s what came next for the S&P 500:
- 3-months later stocks jumped 8.9%
- 6-months later equities surged 18.7%
- 12-months later stocks were never lower with and average performance of 36.3%
- 24-months later stocks gained a staggering 48%
Hug a bear. They’ll need it.
Here’s the reality. Without question it’s a murky market environment.
Trade war headlines are changing daily.
Investors must look through the news narrative of today…and visualize tomorrow.
That’s the same strategy we suggested one month ago, when few could imagine a rally was even possible.
Based on the recent market rally breadth and future projections, be careful playing defense for too long.
Money is flowing into new growthier pockets of the market like technology, discretionary, industrials, and financials.
Our Outlier 20 report highlights the Top 20 highest ranked stocks loved by institutional investors.
That’s where the biggest winning stocks reside.
This is a great time to become a PRO member if you aren’t already. Get access to the daily flows and see exactly which stocks are under accumulation.
Don’t wait for the media to blow the bull whistle…by then it’ll have been too late!
Below are a handful of ultra-high-quality stocks with plenty of upside.
These names are only available to PRO members.